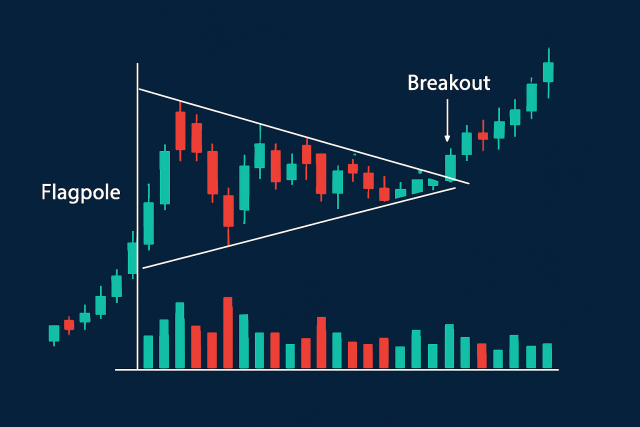
Pennant Pattern Basics to Identify Clear Breakouts
Master the pennant pattern in technical analysis to spot clear breakout opportunities. This guide br...
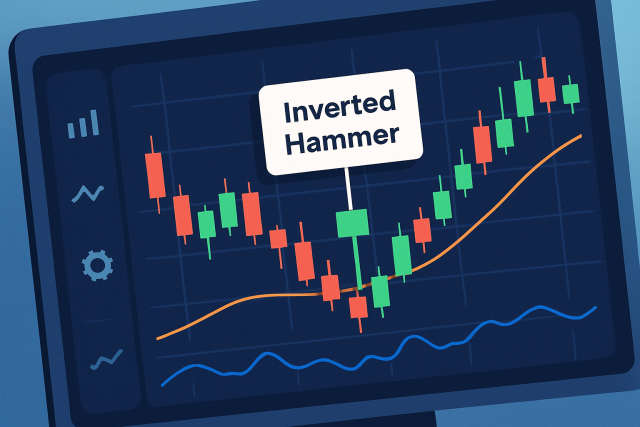
Discover how to identify the hammer inverted candlestick pattern on your trading charts and use it t...
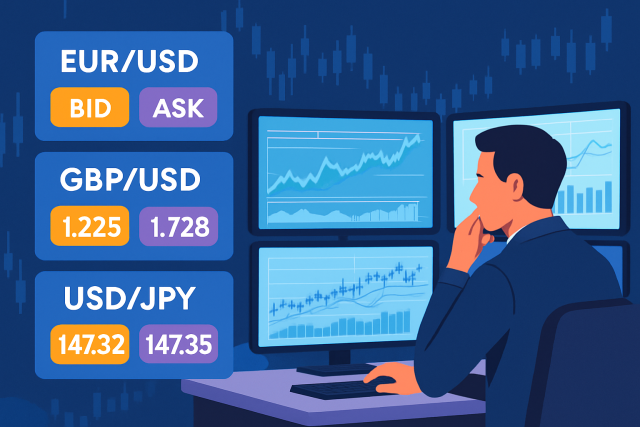
Master the fundamentals of bid price and ask price in forex trading. This guide breaks down complex...
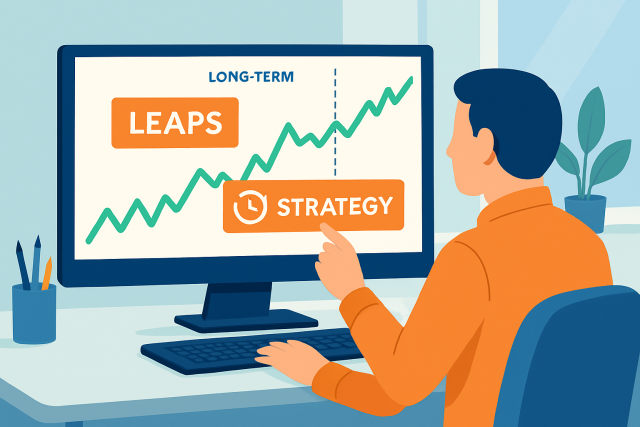
LEAPS options provide a longer-term, less stressful way to trade options compared to regular short-t...
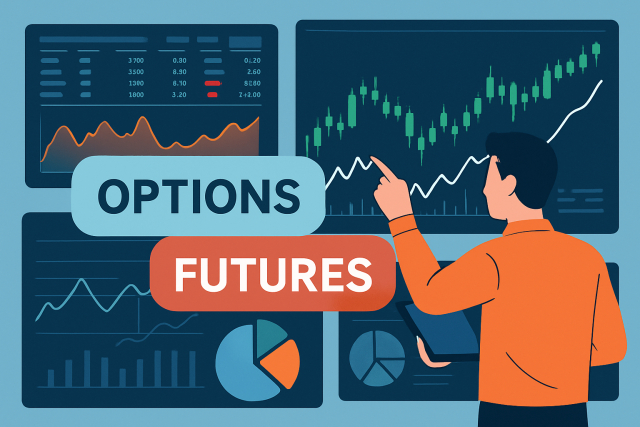
Options and futures represent key derivatives in markets. Understand their differences in obligation...
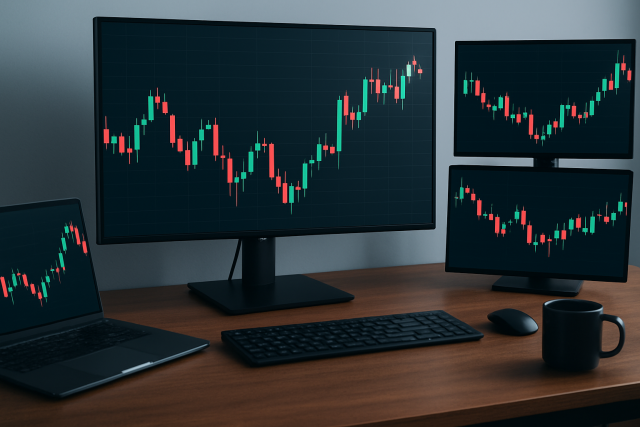
Master reversal candle patterns with our step-by-step guide to identifying trend changes and improvi...
Coinbase is a leading cryptocurrency exchange platform that offers trading services for a wide range of digital assets....
TrendSpider offers cutting-edge automated technical analysis tools for traders in the Trading industry. Their platform p...
Discover answers to frequently asked questions.
Stocks represent ownership in a company and are traded on stock exchanges, while forex trading involves buying and selling currencies in the global foreign exchange market. Stocks tend to have more predictable movements based on company performance, whereas forex can be more volatile due to economic and geopolitical factors.
The amount needed to start trading varies depending on the market and your goals, but many brokers allow you to begin with as little as $100. However, having a larger capital base can help manage risk more effectively and give you more flexibility in your trades.
Some common beginner-friendly strategies include trend following, swing trading, and day trading with simple indicators such as moving averages and RSI. It's important to focus on understanding the market, risk management, and developing discipline before using more complex strategies.
Effective risk management involves setting stop-loss orders to limit potential losses, only risking a small percentage of your capital on each trade, and diversifying your portfolio. Consistently reviewing and adjusting your strategy based on market conditions also plays a key role.
Technical analysis involves using charts, patterns, and indicators to predict future price movements based on historical data. It helps traders identify trends, entry and exit points, and potential market reversals, making it a valuable tool alongside fundamental analysis.
While trading can be rewarding, it is not suitable for everyone due to its risks and the need for discipline, patience, and continuous learning. It’s important to assess your financial situation, risk tolerance, and time commitment before getting involved.
Economic news and events, such as interest rate decisions, employment reports, and geopolitical developments, can cause significant market volatility. Traders often monitor these events closely as they can create opportunities or risks by affecting market sentiment and price movements.
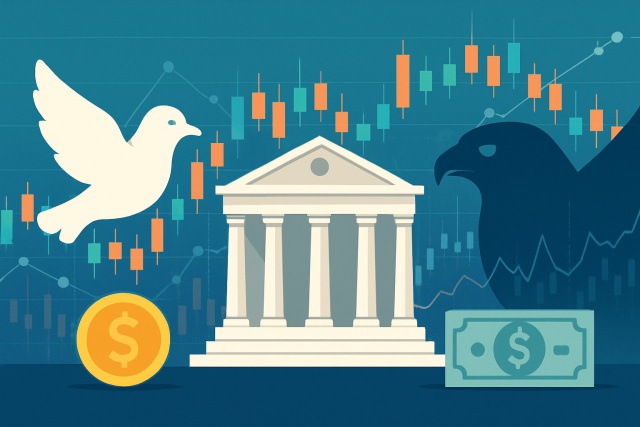
Discover how central banks' hawkish and dovish stances shape financial markets and affect your inves...
Discover what IOUs mean in finance, their role as informal debt acknowledgments, and how understandi...
Explore a detailed review of OspreyFX, highlighting its trading features, competitive pricing, and i...
Discover the bullish harami candlestick pattern—a key technical signal that can hint at trend revers...
Learn how the harami candlestick pattern signals potential market reversals. This guide breaks down...
Unlock the power of candle patterns to decode market psychology and improve your trading precision....
Find articles, guides, and resources across our content library.