
Spot a Triple Top Pattern and Avoid False Signals

The triple top pattern often acts as a important beacon for traders aiming to catch sneaky market reversals. Yet if I’m being honest plenty of traders get tripped up by false signals leading to costly slip-ups.
What Exactly Does a Triple Top Pattern Tell Us?
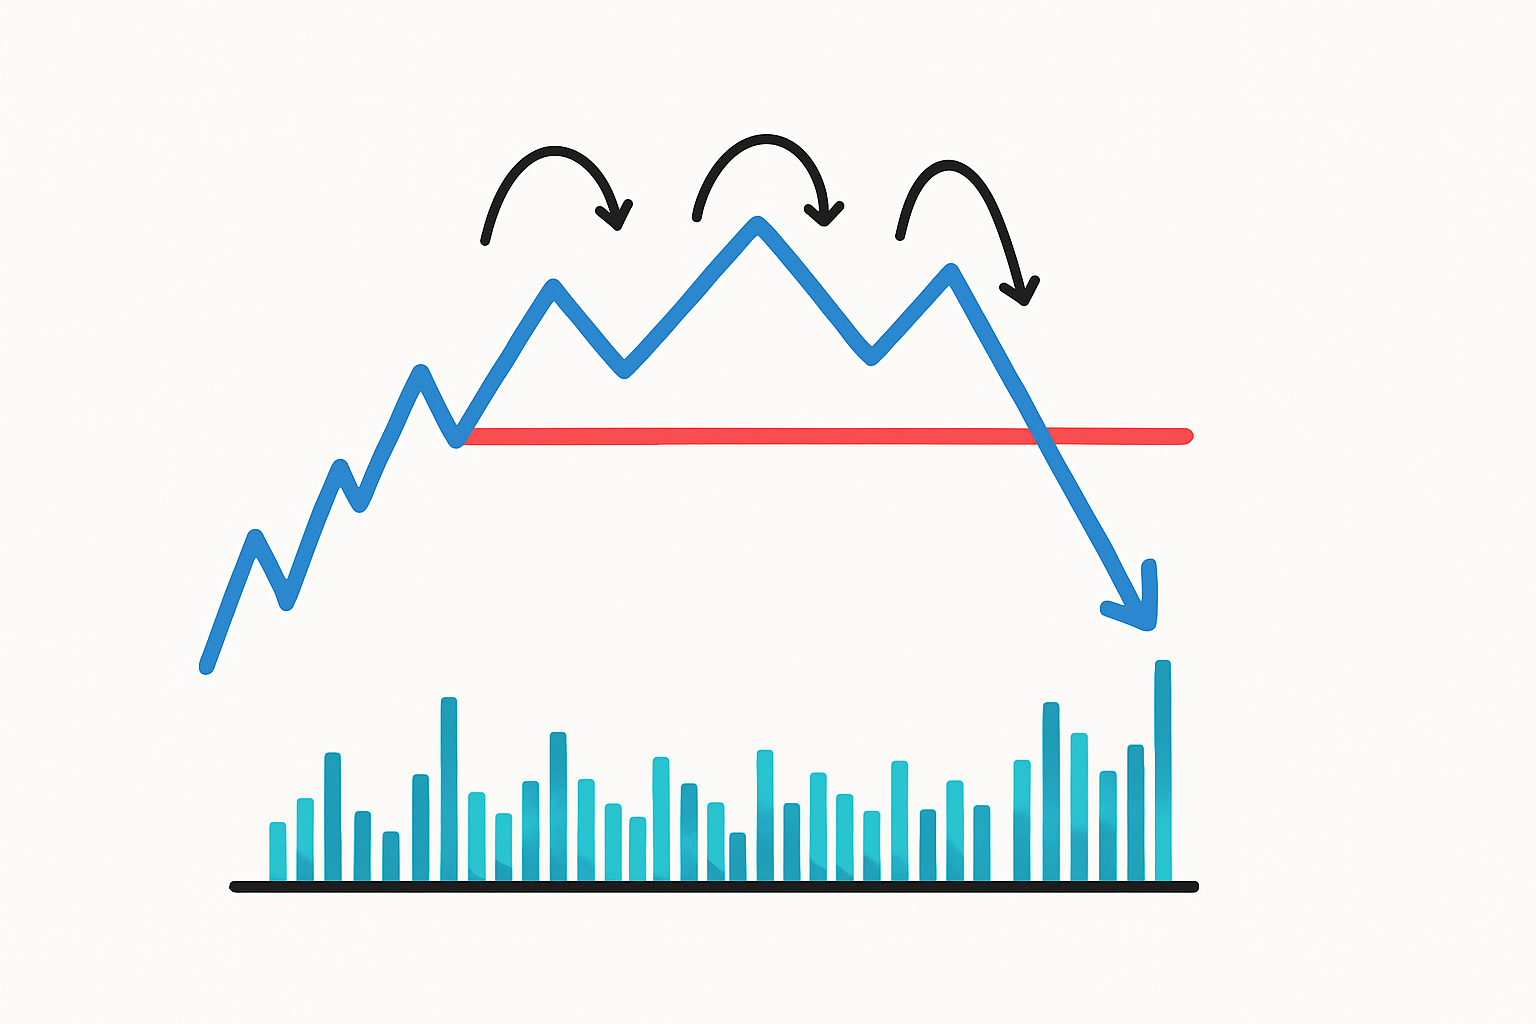
A triple top pattern is a classic bearish reversal setup you’ll often spot on price charts where the price taps a resistance level three separate times but can’t break through. These three peaks usually cluster around the same price point and quietly hint that the upward momentum might be running out of steam. Psychologically, it’s like buyers give it their all but fall short while sellers start to grab the reins.

Illustration of a triple top pattern with three peaks and neckline support on a price chart
Defining Features of a Genuine Triple Top Pattern—What to Watch For
- There are three distinct peaks clustered around the same price level that point to solid resistance holding firm
- You can spot clear volume spikes or shifts during those peaks and drops showing traders are tuned in and paying close attention
- The time gaps between the peaks are long enough for market sentiment to cool off and settle around that resistance level
- The pattern locks in once the price dips below the support level or neckline, confirming the reversal we have been waiting for
Each feature plays a vital role in strengthening the triple top pattern. When those peaks line up neatly in price and there is enough time between them, traders tend to feel more at ease and trust that the resistance level is real. Watching how the volume behaves helps confirm traders' commitment.
How to Spot a Triple Top Pattern, Step by Step (Without Breaking a Sweat)
Keep an eye on price charts for a resistance level that has been tested three distinct times at separate peaks.
Take a closer look at each peak’s height. They should be roughly neck and neck and within a pretty tight price range.
Notice the spacing between those peaks. There needs to be enough breathing room to hint at a genuine market consensus.
Don’t forget to check volume patterns during both the highs and the dips. Strong trader activity here gives the pattern some serious street cred.
Locate the neckline or support level connecting the lows between peaks. Then hang tight and watch for a breakout below it to truly seal the deal.
Take these steps carefully and try to resist the temptation to jump the gun. Keeping an eye on volume and price action at every stage can really save you from costly mistakes.
Detailed chart marking each step in spotting a triple top pattern with volume and breakout confirmation
Tips for Steering Clear of False Signals in Triple Top Pattern Trading Because Nobody Likes a False Alarm
False signals tend to pop up when traders mistake minor price jitters or half-formed patterns for a full-blown triple top. This often happens with early breakouts that barely move the needle on volume, muddling up patterns that look like twins but are really distant cousins. It’s also a common trap when trading during those sluggish, low-volatility spells.
- Always keep an eye out for a spike in trading volume to confirm breakout moves because it’s like the market’s way of shouting ‘this is for real.’
- Lean on longer time frames to filter out the noise since things look a lot clearer when you zoom out a bit.
- When you spot a triple top, don’t just take it at face value. Combine it with other indicators like RSI or MACD to get a better read on momentum.
- Be wary of patterns popping up during quiet, low-volatility times as they often pull the rug out from under you with fake signals.
- Hang tight and wait for the breakout level to get retested before jumping in. This is your best bet to avoid false alarms and confirm the move’s legit.
These steps usually help make the triple top pattern a bit more trustworthy by weeding out the weaker or misleading moves that can trip you up. Volume confirmation adds a nice layer of backup.
Practical Tips and Tools to Help You Pinpoint a Triple Top Pattern with Confidence
Modern charting platforms come packed with handy tools that really take the pain out of spotting triple top patterns. You’ve got features like volume overlays and drawing tools for those ever-important support and resistance lines, plus oscillators that help give those patterns the nod of approval. Traders often lean on backtesting to peek at how similar setups played out in the past.
- Volume indicators give you a front-row seat to the tug-of-war between buyers and sellers during those all-important pattern formation periods.
- Moving averages are like your trusty compass, helping to reveal the overall trend that often lends a hand to reversal setups.
- Oscillators such as RSI and MACD provide momentum clues that tend to play nicely alongside price action, making the picture a bit clearer.
- Drawing tools come in handy when you want to neatly highlight resistance peaks and neckline support, making your analysis feel just that much more precise.
- And let’s not forget backtesting features—these allow you to put your triple top trading strategies through their paces by running them against historical market behavior, which I have found can be a real confidence booster.
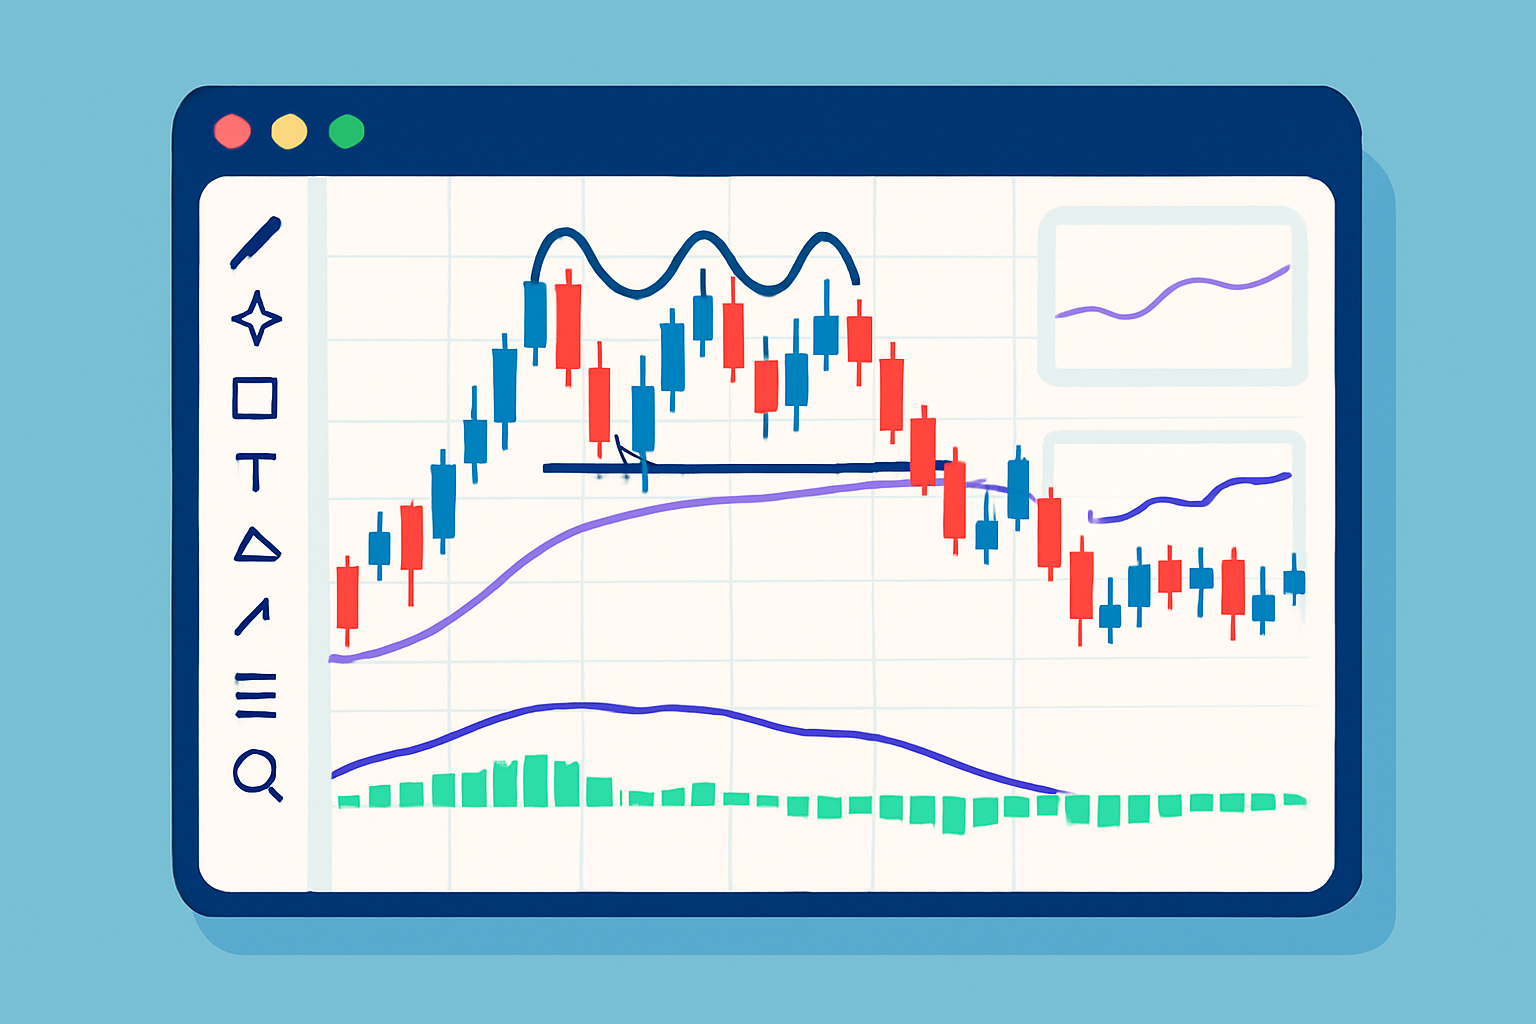
Charting platform demonstrating triple top pattern validation with volume and oscillator indicators
Examples of Triple Top Patterns Showing Both Genuine and Misleading Signals
Taking a close look at real-world cases really helps to separate the wheat from the chaff when spotting reliable triple tops versus tricky imposters. Genuine examples usually feature three distinct peaks almost neck and neck in height with solid volume and a clear breakout below the neckline—no guesswork there. On the flip side, false signals tend to limp along with weak volume or uneven peak heights that don’t line up. They also have peaks too close together in time or breakouts that fizzle out or jump the gun too early.

Comparison of a valid triple top pattern versus a false signal with key annotations
| Characteristic | Valid Triple Top | False Signal |
|---|---|---|
| Volume | You’ll usually see a noticeable surge in volume right at the peaks and during the breakout—kind of like everyone suddenly paying attention | Volume tends to be low or all over the place, lacking that convincing punch |
| Peak Consistency | Three peaks that pretty much hover around the same price level, giving a neat and tidy look | Peaks jump around in height and spacing, like they can’t quite make up their mind |
| Time Between Peaks | Well-spaced out peaks that hint at the market taking a breather, maybe chewing over its next move | Peaks bunch up too closely or are spaced way too far apart, missing that natural rhythm |
| Breakout Behavior | The breakout usually gets the stamp of approval when it dips below the neckline and then pops back for a retest—like a double-check | Breakouts that come too early or just fizzle out, leaving you hanging without any real follow-through |
| Confirmation Indicators | Backed up nicely by RSI and MACD, both flashing signs of weakening momentum to keep you confident | Indicators often clash or send mixed messages, making it tough to trust the signal |
FAQs
How can I confirm a triple top pattern is not just random price fluctuations?
What time frame is best for identifying reliable triple top patterns?
Can a triple top pattern still be valid if the peaks are not perfectly aligned?
What other indicators should I use alongside a triple top to improve accuracy?
How soon after the neckline breakout should I enter a trade?
Are triple top patterns equally effective in all markets?
Useful Links

Unlock Your Trading Potential with Edgewonk
Struggling to improve your trading performance? Edgewonk's advanced analytics tools are designed to give you the edge you need.
With detailed trade journaling, robust strategy analysis, and psychological insights, you'll gain a comprehensive understanding of your strengths and weaknesses. Don't miss out on this game-changing opportunity.


Sophia Dekkers
21 posts written