
Automating Quantitative Trading Strategies with Python

Quantitative trading has revolutionized the way markets are analyzed and trades are executed. Automating quantitative trading strategies python is now a central theme in transforming trading from an art to a data-driven science. In today’s fast-paced financial markets, algorithms built with Python can parse vast amounts of historical and real-time data, develop systematic trading signals, and execute trades with minimal human intervention. This article provides an in-depth exploration of how automation is reshaping the trading landscape, and why Python, with its extensive libraries and community support, is the tool of choice for many quantitative traders. In the sections to follow, we will cover everything from setting up your Python environment for algorithmic trading to advanced strategies such as machine learning-enhanced models, risk management, and even a detailed case study showcasing a moving average crossover strategy.
Understanding Quantitative Trading
Quantitative trading is a method of executing trades based on mathematical computations and number crunching. Rather than relying solely on human intuition, traders and hedge funds now rely on data analysis and statistics to make decisions. This section will delve into the core principles of quantitative trading, explain how automation enhances these strategies, and discuss both the opportunities and challenges that come with implementing such systems.
What is Quantitative Trading?
Quantitative trading involves the use of mathematical models to identify trading opportunities and execute orders automatically. It leverages techniques such as statistical analysis, time series analysis, and predictive modeling to forecast market movements. Traders use historical data to backtest strategies, fine-tune algorithm parameters, and validate the robustness of their models under various conditions.
Automating quantitative trading strategies python means developing sophisticated trading bots that can scan multiple financial instruments in real time and detect patterns imperceptible to human traders. The ability to quickly process data and execute orders can significantly enhance the probability of achieving superior returns.
The Role of Automation
Automation in quantitative trading is about reducing human error and latency, while improving consistency across strategy implementation. Algorithms can operate 24/7, making decisions based on predefined criteria without the psychological biases that may affect human decision-making. Developers can employ Python’s robust ecosystem—libraries like NumPy, pandas, SciPy, scikit-learn, and TensorFlow—to streamline data analysis and algorithm development.
Automation also facilitates:
- Speed: Automated systems can respond to market conditions in microseconds.
- Consistency: Trades are executed based on well-defined criteria, avoiding the pitfalls of human emotion.
- Backtesting Capability: Strategies can be tested using historical data, ensuring they perform under different market conditions.
- Scalability: Multiple instruments and markets can be monitored simultaneously.
These benefits come with the challenge of ensuring the algorithms perform as expected, particularly during extreme market conditions where models may break down. Testing and continuous improvement remain critical.
Advantages and Risks
While automated quantitative trading provides numerous advantages, it is not without risks:
- Overfitting: When models perform well on historical data but poorly in live trading.
- Market Anomalies: Sudden economic events can lead to significant deviations from normal behavior.
- Technical Failures: Connectivity issues or system errors can result in missed trading opportunities or losses.
- Regulatory Concerns: Automated systems must comply with financial regulations, which may vary across regions.
Quantitative models must be robust and flexible to adapt to rapidly changing market conditions. Proper risk management protocols, robust stress testing, and thorough backtesting are essential to mitigate potential downsides.
Setting Up Your Python Environment for Trading Automation
A strong foundation is crucial for developing and deploying automated trading systems. This section guides you through setting up your Python environment, installing necessary libraries, and configuring your workspace for efficient development.
Installing Python and Essential Libraries
Python’s versatility is one of the main reasons it is favored for financial applications. The following steps outline how to install Python and some essential libraries for quantitative analysis and trading automation:
Download and Install Python:
Set up a Virtual Environment:
Example command:
python -m venv trading_env
Install Key Libraries:
Integrated Development Environments (IDEs):
Configuring Your Environment
After installing the necessary tools, configuration is key:
- IDE Configuration: Set up your IDE to support code linting, debugging, and version control with Git.
- Data Sources: Configure access to financial data sources. APIs such as Alpha Vantage, Quandl, or Interactive Brokers provide historical and real-time data feeds.
- Backtesting Frameworks: Libraries like Backtrader and Zipline allow you to simulate trades using historical data to validate your strategies.
Using Docker for Isolation
For those who want robust reproducibility across various environments, Docker can be a powerful tool. A Dockerfile that encapsulates your trading bot’s requirements can ensure consistency in both development and production stages.
Environment Best Practices
- Version Control: Always use Git to track changes. Implement continuous integration pipelines for automated testing.
- Documentation: Keep comprehensive documentation. Proper commenting and README files help new contributors understand the project.
- Security Measures: Secure any API keys or sensitive credentials using environment variables rather than hard-coding them in your scripts.
With your Python environment configured, you’re well-equipped to transition from theory to practice. This foundational step is crucial before diving into the intricacies of data analysis and algorithm development.

Data Sources and Financial Data Analysis
Accurate data is the lifeblood of quantitative trading strategies. This section examines the importance of quality data, explores various sources, and demonstrates how Python tools can be used to acquire, clean, and analyze financial data.
Data Acquisition
Financial data can be categorized into historical data, real-time prices, and alternative data sources:
- Historical Data: Essential for backtesting strategies. Providers such as Yahoo Finance, Quandl, and Google Finance offer free or subscription-based data.
- Real-Time Data: Critical for live trading. APIs from brokers like Interactive Brokers and services such as IEX Cloud deliver live feeds.
- Alternative Data: This includes sentiment data, social media feeds, and news analytics. Although less traditional, these datasets can reveal market sentiments and hidden trends.
Cleaning and Preprocessing Data
Data acquired from various sources often requires cleaning:
- Handling Missing Data: Use interpolation or imputation techniques to fill gaps.
- Normalization: Standardize different data sets to ensure compatibility.
- Data Merging: Combine different sources for a more holistic market view.
Python’s pandas library is instrumental in this process. With functions like isnull(), fillna(), and merge(), you can efficiently preprocess large datasets.
Sample Code Snippet:
import pandas as pd

data = pd.read_csv('historical_data.csv')

# Handle missing values by filling forward
data.fillna(method='ffill', inplace=True)

# Normalize the data columns
data['NormalizedPrice'] = data['Close'] / data['Close'].iloc[0]

print(data.head())
This snippet demonstrates basic data cleaning steps crucial for accurate analysis and strategy formulation.
Financial Data Analysis Techniques
Once your data is in shape, you can perform various analyses:
- Statistical Analysis: Calculate means, medians, and standard deviations to assess market behavior.
- Time Series Analysis: Identify trends and seasonality in asset prices.
- Correlation Analysis: Examine correlations between different assets or indicators to optimize portfolio diversification.
Visualization of Financial Data
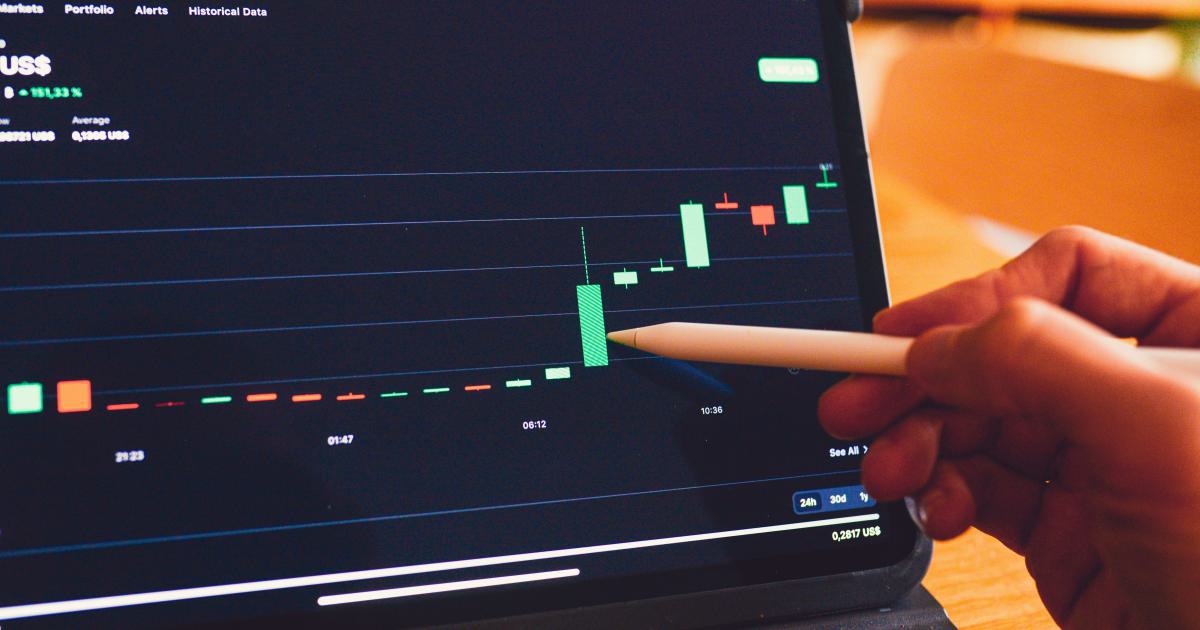
Visualization plays a significant role in understanding complex data. Libraries such as matplotlib and seaborn enable you to create graphs and charts that reveal insights. Visual representations help in identifying trends, patterns, and outliers that might be missed with raw data analysis.
For example, candlestick charts, line graphs, and scatter plots are standard tools in the quantitative trader’s toolkit. They provide clarity on price movements and inform adjustments to your trading algorithms. Ensure that the charts you produce are clear and tailored to show meaningful relationships.
Automating Trading Decisions
A cornerstone of algorithmic trading is the ability to automate decision-making processes. In this section, we explore how to turn data signals into actionable trading decisions using Python. We also discuss backtesting strategies, simulation environments, and practical methods for paper trading.
Algorithmic Trading Basics
Algorithmic trading relies on predefined rules to determine when to enter or exit a market position. Some common approaches include:
- Mean Reversion: Based on the assumption that prices will revert to their mean over time.
- Momentum Trading: Taking advantage of market trends by following the direction of price movements.
- Statistical Arbitrage: Exploiting price differences between correlated assets.
Python provides the frameworks necessary to design these algorithms. Using libraries like NumPy and pandas, you can perform rapid computations and iteration over large datasets. Moreover, Python’s readability and extensive community support make it ideal for building trading systems that are both powerful and maintainable.
Backtesting Strategies
Backtesting is the process of testing a trading strategy on historical data. It allows you to simulate trades and evaluate performance metrics such as profitability, drawdowns, and risk-adjusted returns. The key steps include:
Strategy Definition: Clearly outline entry/exit rules and risk management guidelines.
Data Preparation: Ensure that historical data is cleaned, normalized, and properly aligned.
Simulation: Execute the trades in a simulated environment, avoiding lookahead bias.
Performance Analysis: Assess key statistics including the Sharpe ratio, profit factor, and maximum drawdown.
Reliable backtesting frameworks like Backtrader and Zipline are popular in the Python community. They offer robust features that let you simulate complex strategies with ease.
Paper Trading and Simulations
Before deploying any trading algorithm in a live environment, rigorous testing through paper trading is crucial. Paper trading involves simulating real-world trade executions without actual monetary risk. It serves as a final validation stage to catch any potential issues in trade execution or strategy logic.
Simulations provide insights into:
- Execution Delays: Understanding how the algorithm responds to market fluctuations in real time.
- Parameter Sensitivity: Testing various parameter combinations to optimize performance.
- System Robustness: Ensuring the system handles different market conditions without failure.
Incorporating the Key Phrase
In one of the subsections below, we directly reference our key phrase in a natural context:
Automating Quantitative Trading Strategies Python in Action
Integrating real-time data feeds with well-calibrated algorithms is essential for success in today's markets. Automating quantitative trading strategies python not only enhances speed but also ensures that the decision-making process remains unbiased and driven by data. As we combine key performance metrics with algorithmic efficiencies, the trading systems become more resilient and adaptable to market dynamics.
By iteratively refining parameters and using live simulations, traders can achieve greater precision. Experimentation through backtesting combined with robust paper trading creates a self-correcting system that continuously evolves.
Automating Trade Execution
While identifying profitable opportunities is important, the actual execution of trades is equally crucial. This section explains how Python interfaces with broker APIs, manages orders, and ensures a seamless execution flow.
Integration with Brokerage APIs
Many brokers now offer application programming interfaces (APIs) that allow direct integration with trading platforms. Using Python, you can automate tasks like placing orders, monitoring positions, and managing risk in real time. Examples include:
- Interactive Brokers API: Offers extensive functionalities for managing complex portfolios.
- TD Ameritrade API: Provides access to market data and order management.
- Alpaca API: A commission-free platform popular among retail algorithmic traders.
Integration steps typically involve:
- Authentication: Securely accessing the API using tokens or keys.
- Data Retrieval: Fetching market data, order status, and portfolio details.
- Order Execution: Sending buy/sell orders based on predefined strategy conditions.
Managing Orders and Trade Execution
Effective order management is critical. Automated systems must handle various types of orders such as market, limit, stop-loss, and others. Python scripts can be designed to:
- Monitor Order Status: Ensure that orders are filled, partially filled, or cancelled appropriately.
- Handle Slippage and Latency: Incorporate mechanisms to adjust for execution delays or market volatility.
- Rebalance Portfolios: Automatically rebalance asset allocations based on real-time data inputs.
Automated order management minimizes risks associated with manual trading and ensures consistent strategy adherence. It is also imperative to log every transaction for later analysis, audits, and continuous system improvement.
Testing Execution Systems
Just like with the strategy development process, thorough testing is essential for trade execution systems. Rigorous simulations and paper trading are further extended to order management systems to confirm that orders are executed as intended. During testing, it is crucial to simulate various market conditions, ensuring that the system handles unexpected spikes in volatility or connectivity issues gracefully.
Advanced Techniques in Trading Automation with Python
Modern markets are increasingly complex, and simple strategies may no longer suffice to capture the full potential of market movements. In this section, we explore advanced techniques that leverage machine learning and artificial intelligence to further automate and enhance quantitative trading.
Machine Learning for Predictive Analysis
Machine learning has emerged as an invaluable tool in financial markets. Predictive models can analyze historical data and forecast future price movements with improved accuracy. Python's robust libraries—such as scikit-learn, TensorFlow, and PyTorch—enable traders to build, train, and deploy models that fine-tune trading decisions.
Key steps include:
- Feature Engineering: Extract meaningful features from raw market data such as technical indicators, sentiment scores, or macroeconomic variables.
- Model Training: Use historical data to train models like regression, decision trees, or neural networks.
- Evaluation: Validate the predictive power of models using metrics such as mean squared error or accuracy rates.
- Deployment: Integrate the model into the trading pipeline to generate live trading signals.
Reinforcement Learning and Adaptive Strategies
Another innovative approach is using reinforcement learning (RL) where agents learn optimal policies by interacting with the market environment. In RL, the trading agent receives rewards based on its actions (profit or loss) and continuously learns to improve its strategy. This iterative process allows the algorithm to adapt to evolving market conditions.
Reinforcement learning frameworks can be integrated with simulation environments to train robust models. The continual adaptation aspect provides a dynamic edge where the system can recalibrate decisions based on new information.
Natural Language Processing (NLP) in Trading
Beyond numerical data, textual information such as news articles, financial reports, and social media sentiment can provide invaluable insights. Python libraries like NLTK and spaCy allow traders to perform sentiment analysis on textual data, incorporating these signals into trading algorithms. Combining these insights with traditional numerical indicators can result in a more balanced trading system that reacts to both market data and broader economic sentiment.
Building a Robust AI-Driven Trading Bot
Integrating machine learning and reinforcement learning techniques into a trading bot involves several important considerations:
Data Pipeline: Ensure a reliable data flow that feeds both historical and real-time data into your models.
Model Integration: Embed predictive models directly into the trading system for dynamic signal generation.
Feedback Mechanism: Implement a continuous feedback loop for models to learn from live trading outcomes and adjust accordingly.
Risk Control: Even with advanced AI, traditional risk management frameworks must remain in place to protect capital.
Performance Monitoring: Continuously track model performance, checking for degradation over time and recalibrating as needed.
These advanced techniques can elevate your trading strategy from simple algorithmic signals to a fully adaptive system that evolves with market conditions.
Risk Management in Automated Trading
As with any financial venture, risk management is paramount when automating trading strategies. A robust risk management plan includes not just protecting against losses, but also ensuring that the automated system can adapt and recover from unexpected market events.
Importance of Risk Management
Automated systems can sometimes trigger large positions inadvertently due to programming errors or unforeseen market conditions. Therefore:
- Stop-Loss Orders: Automatically limit losses on trades.
- Position Sizing: Carefully determine the size of each trade relative to your overall portfolio.
- Diversification: Spread risk across uncorrelated assets.
- Monitoring and Alerts: Set up systems that alert you when risk thresholds are breached.
Strategies for Risk Mitigation
Pre-Trade Checks: Implement validation layers that inspect market conditions and confirm the data integrity before executing orders.
Real-Time Monitoring: Continuously monitor various risk metrics such as volatility, margin usage, and exposure.
Stress Testing: Utilize historical crisis data to simulate extreme market conditions and evaluate system performance.
Fail-Safes: Incorporate automatic shutdown or manual intervention triggers should the algorithm behave unexpectedly.
Implementing Risk Controls in Python
Python makes it easy to integrate risk controls:
- Libraries: Use Python’s robust libraries for statistical analysis to calculate risk metrics such as Value at Risk (VaR) and Conditional Value at Risk (CVaR).
- Alerts: Automate email or SMS alerts to notify traders of unexpected behavior.
- Logs and Audit Trails: Maintain comprehensive logs for troubleshooting and ensuring that all trades are properly documented.
By integrating careful risk control measures directly into your algorithm, you can minimize the chance of catastrophic losses while maintaining the benefits that automation brings.

Case Study: Automating a Moving Average Crossover Strategy
To illustrate the practical aspects of automating quantitative trading strategies python, let’s delve into a case study featuring a popular technical analysis indicator—the moving average crossover. This strategy involves two moving averages: a short-term average and a long-term average. When the short-term average crosses above the long-term, it signals a potential upward trend, and vice versa.
Strategy Explanation
Selection of Moving Averages:
Entry and Exit Signals:
- Buy Signal: When the 10-day moving average crosses above the 50-day moving average.
- Sell Signal: When the 10-day moving average crosses below the 50-day moving average.
The simplicity of this strategy makes it an excellent candidate for automation and backtesting.
Implementation in Python
Below is a sample Python script demonstrating how to implement a moving average crossover strategy using pandas for data manipulation and matplotlib for visualization:
import pandas as pd
import matplotlib.pyplot as plt

# Load historical stock data (example: Apple Inc.)
data = pd.read_csv('AAPL_historical.csv', parse_dates=['Date'])
data.sort_values('Date', inplace=True)

# Calculate short-term and long-term moving averages
data['MA_short'] = data['Close'].rolling(window=10).mean()
data['MA_long'] = data['Close'].rolling(window=50).mean()

# Generate signals based on the crossover of moving averages
data['Signal'] = 0
data.loc[data['MA_short'] > data['MA_long'], 'Signal'] = 1
data.loc[data['MA_short'] < data['MA_long'], 'Signal'] = -1

# Visualize the results
plt.figure(figsize=(14,7))
plt.plot(data['Date'], data['Close'], label='Close Price', color='black')
plt.plot(data['Date'], data['MA_short'], label='10-Day MA', color='blue')
plt.plot(data['Date'], data['MA_long'], label='50-Day MA', color='orange')
plt.title('Moving Average Crossover Strategy')
plt.xlabel('Date')
plt.ylabel('Price')
plt.legend()
plt.show()
This code demonstrates the simplicity and effectiveness of a moving average crossover approach. The visual plot helps traders understand the relationship between the moving averages and the stock price, making it easier to interpret the signals.
Backtesting the Strategy
Before implementing the above strategy live, rigorous backtesting is essential. Simulate the trading conditions using historical data to evaluate key metrics such as:
- Total returns
- Maximum drawdown
- Win/loss ratio
- Sharpe ratio
The backtesting process helps validate the strategy’s performance across different market conditions and ensures any adjustments are made prior to live deployment.
Lessons Learned
This case study highlights several important lessons:
- Simple strategies can often be automated with relatively straightforward Python scripting.
- Visualization is a powerful tool for validating and understanding trading signals.
- Rigorous backtesting is indispensable for ensuring that the strategy works as expected in live conditions.
- Automation couples these elements together into a dynamic system that works continuously.
Best Practices for Debugging and Maintenance
Maintaining an automated trading system is a continual process. This section describes best practices for debugging, ensuring system reliability, and handling live market conditions.
Regular Code Reviews and Testing
- Unit Testing: Create unit tests for each module of your trading algorithm to catch bugs before they affect live trades.
- Integration Testing: Regularly test the integration of your Python modules with live data feeds and broker APIs.
- Logging: Maintain detailed logs of system activity. Tools like Python’s logging module can help record critical events, which is essential for troubleshooting during high-volatility market periods.
Real-Time Monitoring Tools
Implement real-time dashboards using tools like Grafana or custom web interfaces built with Flask. These can offer immediate insights into system performance, order execution, and risk metrics. Automated alerts, via email or SMS, can notify you if certain risk thresholds or performance indicators are breached.
Managing System Updates
Financial markets evolve, and so should your trading algorithms:
- Version Control: Use Git to manage code versions and roll-back changes if needed.
- Modular Architecture: Develop your system in a modular fashion to simplify updates and testing.
- Continuous Integration/Continuous Deployment (CI/CD): Automated builds and testing pipelines can significantly reduce deployment risks.
Dealing with Unforeseen Market Events
Even well-designed systems can experience anomalies:
- Circuit Breakers: Incorporate mechanisms that pause trading in the event of extreme market conditions.
- Manual Overrides: Ensure that your system allows for manual intervention if necessary.
- Frequent Audits: Regularly review system performance and audit logs to detect undesirable behaviors early.
Future Trends in Trading Automation
As technology continues to evolve, so too does the field of automated trading. Emerging trends include the integration of cloud computing, increased use of artificial intelligence, and even blockchain for settlement and trade verification.
Cloud-Based Trading Systems
Cloud computing offers scalability and resilience that are attractive for data-intensive trading applications. Deploying your trading bot on a cloud platform like AWS or GCP can provide:
- High Availability: Distributed servers ensure constant uptime.
- Scalability: Dynamically allocate resources based on market load.
- Advanced Analytics: Benefit from integrated machine learning services that further enhance predictive capabilities.
Integrating Big Data and Alternative Data Sources
In addition to traditional market data, alternative sources such as social media sentiment, economic indicators, and geopolitical news are becoming increasingly relevant. Big Data frameworks like Apache Spark, when coupled with Python, can process huge volumes of information in real time to refine trading insights.
The Rise of Decentralized Finance (DeFi)
Decentralized finance is disrupting traditional markets by enabling programmable, trustless financial operations using blockchain technology. Python developers are beginning to build algorithms that interact with decentralized exchanges and smart contracts, opening up new frontiers for automated trading.
Continuous Learning and Adaptive Systems
The future of trading automation will likely feature systems that continuously learn and adapt using real-time data. Reinforcement learning models that adjust parameters on the fly and self-healing architectures ensure that trading systems remain robust even in the face of market evolution. This convergence of traditional quantitative methods with modern AI techniques promises to yield systems that are both highly profitable and resilient.
Conclusion
The journey from a conceptual strategy to a practical, automated trading system involves a blend of data analysis, coding expertise, rigorous testing, and continuous maintenance. Python, with its robust ecosystem, stands out as the ideal programming language for achieving these goals. By exploring topics ranging from environment configuration and data analysis to advanced machine learning and execution strategies, we have demonstrated the multifaceted nature of automating quantitative trading strategies python.
As markets continue to innovate, the edge lies in the ability to adapt and evolve. Embracing automation not only speeds up the execution of well-defined strategies but also opens up new avenues for leveraging data-driven insights. Whether you are a professional trader, a data scientist, or a hobbyist, the time to leverage Python in your trading strategy is now.
Moving forward, remember that robust risk management, continuous improvement through backtesting, and the flexibility to integrate emerging technologies are the hallmarks of a successful automated trading system. With proper planning, disciplined execution, and relentless testing, you can navigate the complexities of financial markets and transform raw data into actionable insights, all while maintaining efficiency and reducing emotional biases.
Embrace the journey, and let the power of Python propel your trading strategies to new heights.
Unlock Trading Potential with Automated Analysis
Tired of missing opportunities and making suboptimal trading decisions? TrendSpider's cutting-edge platform automates complex technical analysis, saving you time and reducing human error.
With multi-timeframe analysis, dynamic alerts, backtesting, and customizable charting, you'll gain a competitive edge in identifying trends and making informed trades across global markets.

Unleash the Power of Automated Trading Analysis
Are you struggling to keep up with the fast-paced trading world? TrendSpider empowers you with cutting-edge tools for optimal strategy execution.
Our automated technical analysis suite eliminates guesswork, backtests strategies, and delivers real-time alerts, saving you valuable time and effort.


Leila Amiri
36 posts written
Similar Topics