
How to Use Optuma Charting Software
Optuma Charting Software is a powerful tool designed for market analysts, traders, and investment professionals. In this comprehensive guide, we will explore how to use optuma charting software to its full potential, from initial setup to advanced charting techniques. Whether you are new to charting or a seasoned analyst, this article will provide detailed, step-by-step instructions along with actionable insights to enhance your trading strategies and market analysis. By leveraging optuma charting software, you can gain a competitive edge in understanding market trends and making informed decisions.
In the following sections, we will dive deep into every facet of the software. We begin with installation and initial configuration, then move on to the basic and advanced features. Real-world examples, case studies, and expert tips are included throughout the article to ensure that every reader can put the lessons learned into practical use.
Getting Started with Optuma Charting Software
Before you begin your journey with optuma charting software, it is essential to understand the basics. In this section, we discuss installation, system requirements, and the initial setup process to ensure that you start on the right foot.
Installation and System Requirements
Optuma Charting Software is available for multiple platforms, including Windows and macOS. To install the software, follow these steps:
Visit the official website and download the appropriate version for your operating system.
Ensure that your system meets the minimum requirements, which typically include a modern processor, at least 4GB of RAM, and a reliable internet connection.
Run the installer and follow the on-screen instructions. The setup process is straightforward, guided by a wizard that helps configure initial settings tailored to your preferences.
The software may ask you to register with your email address. Registration not only opens the door to premium features but also provides access to regular updates and technical support. After installation, it is advisable to check for any updates or patches that may enhance performance or introduce new functionalities.
For users on older hardware, optuma charting software offers a lightweight mode that prioritizes essential tools without sacrificing speed. This adaptability makes the platform accessible to both high-end traders and hobbyists alike.
Once the installation is complete, you will be greeted by a clean user interface designed to streamline your analytical workflow. The dashboard is divided into several panels, each offering quick access to essential tools and charts. Familiarize yourself with the layout by exploring each section—this is where your charting journey begins.

Configuring Your Workspace
After installation, customizing your workspace is crucial to making the software work for you. Optuma charting software allows for extensive personalization:
- Layout Customization: Rearrange panels, adjust chart sizes, and choose themes that reduce eye strain.
- Toolset Configuration: Select which tools and indicators appear on your toolbar for quick access during analysis.
- Data Feeds and Connections: Integrate real-time market data feeds to ensure your charts reflect the latest information. You may also configure connections to external databases or financial news services.
Spend some time arranging your workspace to optimize your workflow. A well-organized workspace not only increases efficiency but also helps in better managing the complex data and numerous tools that optuma charting software offers.
Navigating the Interface
Understanding the interface is a prerequisite to mastering optuma charting software. The primary components include:
- Main Menu: This is where you access file operations, settings, and help resources.
- Chart Window: The central area where all charting takes place. This window supports multiple chart types such as candlestick, bar, and line charts.
- Indicator Panel: A repository of technical indicators, from moving averages to oscillators, that you can overlay your charts with.
- Drawing Tools: Tools to annotate charts, draw trend lines, add Fibonacci retracements, and more.
Each section is intuitively designed, but it may require some exploration to become comfortable. To ease the transition, optuma charting software includes tooltips, hover-based information, and an integrated help section. The intuitive design is a key selling point of optuma charting software: its balance of simplicity and power is ideal for both new and experienced users.
Core Features of Optuma Charting Software
In this section, we explore the core functionalities that make optuma charting software an indispensable tool for market analysis. From basic charting tools to sophisticated technical indicators, understanding these features is key to leveraging the software effectively.
Chart Types and Visualization Options
Optuma charting software supports an array of chart types, each designed to meet specific analytical requirements:
- Candlestick Charts: Widely used by traders to display open, high, low, and close values, these charts provide a detailed visual snapshot of market activity.
- Bar Charts: These offer a straightforward representation of price movements and are favored for their simplicity.
- Line Charts: Ideal for visualizing long-term trends and moving averages, line charts provide a clear view of market patterns.
- Point and Figure Charts: Less common but extremely useful for spotting price patterns without the noise of time.
Each chart type can be customized extensively. Users can modify colors, adjust time frames, and fine-tune the scale and layout. This flexibility allows both short-term traders and long-term investors to focus on the critical aspects of market data.
Built-in Technical Indicators
Technical indicators are vital for detecting market trends and making informed trading decisions. Optuma charting software comes with a comprehensive suite of built-in indicators, including:
- Moving Averages: Simple, exponential, and weighted moving averages help smooth out price data.
- Relative Strength Index (RSI): This oscillator aids in identifying overbought or oversold conditions.
- MACD (Moving Average Convergence Divergence): A trend-following momentum indicator that shows the relationship between two moving averages.
- Bollinger Bands: These measure market volatility, providing insights into price levels relative to a standard deviation.
Integrating these indicators into your charts is straightforward. You can simply drag and drop your chosen indicator onto a chart window and adjust the settings as needed. Each indicator comes with customizable parameters, allowing for precise alignment with your trading strategy.
Drawing and Annotation Tools
Annotating your charts is an essential part of technical analysis. With optuma charting software, you have access to a robust set of drawing tools:
- Trend Lines: Draw trend lines to identify price directions over time.
- Support and Resistance Levels: Mark key levels where the price has historically reversed or stalled.
- Fibonacci Retracements: Apply Fibonacci levels to predict possible areas of support and resistance.
- Text Annotations: Add notes directly onto your charts to record insights and trade ideas.
These tools are not only functional but are also fully customizable. Adjust colors, line thickness, and styles to suit your preferences and ensure that your annotations are both clear and aesthetically pleasing.
Data Management and Analysis Tools
One of the standout aspects of optuma charting software is its robust data management capabilities. Users can import, export, and process data from multiple sources:
- Historical Data Import: Load past market data to perform in-depth historical analyses.
- Real-Time Data Integration: Connect with live data feeds to keep your charts current.
- Custom Data Sets: Import proprietary data for specialized analysis and backtesting.
The software’s analytical prowess is further enhanced by built-in data analysis tools. Whether you’re examining basic trends or conducting complex algorithmic testing, optuma charting software provides the infrastructure to manage and analyze large sets of data efficiently.
Advanced Features and Functionalities
Once you have mastered the core features, it is time to delve into some of the advanced tools that setting optuma charting software apart from other charting platforms. This section provides insights into programming custom indicators, developing trading strategies, and integrating third-party data for a comprehensive market view.
Custom Scripting and Indicator Creation
Optuma charting software offers a powerful scripting environment that allows you to create custom indicators and automate routine tasks. For many analysts, this is a game-changer because it enables complete flexibility in tailoring the software to unique trading strategies. Some key features include:
- Script Editor: An integrated development environment where you can write, test, and deploy scripts using the platform’s proprietary language.
- Custom Variables: Define variables and parameters that reflect your specific market hypotheses.
- Automated Alerts: Set up scripts to trigger alerts when your custom indicators reach critical thresholds.
- Backtesting: Once your script is ready, you can perform historical backtesting to evaluate its performance over different market cycles.
For example, a trader might combine a custom momentum indicator with automated alerts to capitalize on short-term price movements. The scripting flexibility allows for a wide range of customizations—from simple modifications of built-in indicators to the creation of entirely new analytical tools.
Algorithmic Trading Integration
For those interested in algorithmic trading, optuma charting software offers integration with various third-party platforms. This integration is particularly beneficial for:
- Automating Trade Execution: Pair your custom indicators with live trade triggers to execute orders automatically based on pre-set criteria.
- Risk Management: Use algorithms to adjust stop loss levels, position sizes, or hedge existing positions automatically.
- Performance Analysis: Monitor trade performance with real-time analytics and adjust parameters accordingly.
The ability to seamlessly integrate algorithmic trading systems means that optuma charting software is not just a charting tool—it’s an essential component of a sophisticated trading ecosystem. By automating most of the trading process, traders can focus on strategy development and market monitoring rather than manual execution.
Multi-Chart and Workspace Management
Many advanced users operate with multiple charts simultaneously to gain a comprehensive view of the market. Optuma charting software excels in multi-chart management by allowing users to:
- Link Charts: Synchronize several charts so that navigating one automatically updates the others.
- Save Layouts: Create and save custom workspace layouts for different analytical scenarios (e.g., day trading vs. long-term investing).
- Compare Data: Run side-by-side analyses of different assets or indices, providing a richer context for decision-making.
This feature is particularly useful during market volatility when quick comparisons between different securities are necessary. For example, during an earnings season, an investor might compare multiple technology stocks on a single screen to identify sector trends and potential anomalies.
Advanced Data Analysis Tools
Beyond the routine charting features, optuma charting software exports a rich set of advanced data analysis tools. These are designed to help you:
- Statistical Analysis: Run regression analyses, correlation tests, and other statistical measures to validate your trading hypotheses.
- Volatility Analysis: Use specialized tools to gauge market volatility and adjust your trading strategies accordingly.
- Market Breadth Indicators: Analyze the overall health of a market by looking at multiple indicators that gauge underlying trends.
Integrating these analytical tools with the core functionalities of optuma charting software provides a holistic view of the market dynamics. As a result, traders can not only view what is happening in real time but also analyze historical data trends to forecast future movements.
Real-World Examples and Case Studies
Theory is important, but nothing beats practical application. In this section, we walk through several case studies and examples that illustrate how professionals have leveraged optuma charting software in real-world trading environments.
Case Study 1: Day Trading Strategy Optimization
Consider the example of a day trader who relies on intraday price movements. By configuring multiple short-term charts and overlaying technical indicators such as RSI, MACD, and moving averages with customized parameters, the trader was able to identify key inflection points during the trading day. Alerts set via custom scripts helped in executing trades precisely when conditions met predetermined criteria.
This approach allowed the trader to minimize losses and maximize returns in fast-paced market conditions. Detailed backtesting, which is built into the platform, allowed the trader to simulate various market scenarios, ensuring robust strategy performance before live implementation.
Case Study 2: Long-Term Market Trend Analysis
Another example involves a long-term investor focused on macroeconomic trends. By utilizing historical data import and advanced statistical tools available in optuma charting software, the investor was able to analyze multi-decade trends in various markets. The use of custom chart overlays identified long-term support and resistance levels which were instrumental in portfolio adjustments during periods of high market volatility.
In such cases, the ability to save complex workspace layouts and compare multiple charts proved invaluable. The investor could seamlessly switch between different analytical perspectives, such as price action, volume trends, and economic indicators, all within a unified interface.
Case Study 3: Risk Management in Volatile Markets
Risk management is at the core of successful trading. An example of this can be seen from a hedge fund manager who integrated optuma's advanced risk analytics with algorithmic trading. Custom scripts that monitored market volatility on a minute-by-minute basis automatically adjusted stop loss levels and position sizes. This proactive risk management approach allowed the fund to navigate unpredictable market conditions with a lower risk profile, thereby preserving capital while still exploiting market opportunities.
Across these case studies, one common thread is the flexibility and power of optuma charting software. Whether it is day trading or long-term investing, the platform adapts to the diverse needs of its users, offering a robust set of tools that are both easy to configure and deep in analytical potential.
Best Practices and Expert Tips
To maximize your experience with optuma charting software, it is crucial to follow best practices and incorporate expert strategies. Below are several tips that professionals recommend:
Customize Your Layout
One of the most effective ways to improve productivity is by customizing your workspace.
• Experiment with different layouts until you find one that suits your daily trading routine.
• Regularly update your theme and panel arrangement to keep the interface aligned with your workflow.
• Do not let default settings restrict your efficiency; instead, explore advanced customization options provided by optuma charting software.
Develop a Consistent Analysis Routine
Consistency is key when performing technical analysis:
- Begin your trading day by reviewing major charts and indicators.
- Update and annotate charts regularly to capture significant price movements.
- Maintain a trading journal to document trade setups, outcomes, and any adjustments to strategies based on chart analysis.
This routine not only builds expertise over time but also reduces errors caused by rushed decisions. Over time, this disciplined approach can improve your risk management and overall trading performance.
Leverage Community Resources
Optuma charting software is supported by a vibrant community of users:
- Participate in user forums and discussion groups to gain insights into best practices.
- Attend webinars and training sessions offered by experts in the field.
- Share your custom scripts and indicators with the community; collaborative improvement often leads to better tools for all.
Learning from peers who have faced similar market challenges can provide fresh perspectives and innovative strategies, further enhancing your analytical prowess.
Regularly Update the Software
Technical glitches and outdated functionalities can hinder your performance:
- Always install updates as soon as they are available.
- Read release notes to understand new features and improvements.
- Utilize the technical support offered by the optuma team whenever you encounter issues.
These updates not only ensure smooth operation but also enhance the software’s security and functionality over time.
Optimize Data Feeds and Backtesting
Efficient use of data is at the heart of effective analysis:
- Ensure that you are connected to the most reliable data feeds.
- Regularly backtest your strategies using historical data, tweaking parameters based on performance.
- Utilize the software’s integrated analytical tools to measure strategy robustness and adjust as needed.
By setting realistic performance benchmarks through thorough backtesting, you can iteratively refine your trading strategies for better results.

Tips for Troubleshooting and Customization
Even the most robust software can present occasional challenges. Below are troubleshooting tips and advice on further customizing your experience with optuma charting software.
Common Issues and Their Solutions
Software Lag:
- Ensure that your system meets the required specifications.
- Close unnecessary background applications.
- Update your system drivers and software patches.
Data Feed Discrepancies:
- Verify your internet connection and data feed subscriptions.
- Check the data feed settings in the software to ensure they are configured correctly.
- Contact technical support if data continues to appear delayed or inaccurate.
Custom Script Errors:
- Review the script for syntax errors or typos.
- Test scripts in segments to isolate problems.
- Consult the developer forum for support and shared code examples.
Customization Beyond the Basics
For advanced users, customization can go well beyond the interface:
- Modify the default configurations to suit your unique trading style.
- Create conditional formatting rules to highlight important chart patterns automatically.
- Combine multiple data sources and external applications using the API integrations provided by the platform.
Customization here isn’t just about aesthetics; it directly impacts the speed, accuracy, and efficiency of your trading processes. Investing time into tailoring the software to your specific needs can yield significant dividends over time.
Staying Informed with Continuous Learning
The financial markets are in constant flux, and staying up-to-date is critical.
- Regularly read industry publications and subscribe to market news feeds integrated within the software.
- Enroll in advanced courses or workshops that focus on advanced technical analysis using optuma charting software.
- Experiment with new features during demo sessions or in a sandbox environment before applying them in live trading.
This ongoing learning process ensures that you are always on the cutting edge of market analysis, adapting quickly as new techniques and tools become available.
Future Trends and the Evolution of Charting Tools
As technology continues to advance, so too do charting tools like optuma charting software. Emerging trends include the integration of artificial intelligence, machine learning for predictive analytics, and even more robust automation features. These innovations not only promise to enhance the functionality of charting tools but will revolutionize the way traders analyze and respond to market data.
AI and Machine Learning Integration
The future of charting software lies in automation and predictive intelligence:
- AI-driven indicators may soon forecast market trends with unprecedented accuracy.
- Machine learning algorithms are already being developed to identify subtle patterns in vast datasets, providing traders with early warnings of significant market moves.
- Integration of AI capabilities could lead to more automated and highly personalized trading systems that adjust strategies in real time.
These advancements aim to reduce the burden of manual analysis and help traders focus more on strategy and less on data gathering.
Enhanced User Interfaces
User experience is evolving, and the next generation of charting tools is becoming even more intuitive:
- Expect more responsive interfaces with touch and gesture controls.
- Advanced visualization techniques will allow 3D charting and more immersive data exploration.
- User feedback is driving constant improvements, ensuring that future iterations of optuma charting software are even more user-friendly without sacrificing functionality.
Integration with Global Markets
As financial markets become increasingly interconnected, charting software will need to handle multi-market analysis seamlessly:
- Future updates may include enhanced capabilities for tracking global indices, currencies, and commodities simultaneously.
- Integrated translation and localization features might support multilingual teams operating in different time zones.
- The evolving landscape of trading platforms will likely see tighter integration with social media analytics and global economic indicators, further enriching the analytical toolkit.
Investors and traders who adapt to these future trends will undoubtedly find themselves at a significant advantage. Being prepared and informed about the evolution of optuma charting software will ensure you remain competitive as new features roll out.
Conclusion
Optuma Charting Software is a versatile and powerful tool designed for a broad range of users—from novice traders to experienced market professionals. This comprehensive guide has covered everything from initial setup and basic functionalities to advanced script customization and real-world case studies. By understanding and leveraging the various features of optuma charting software, you can elevate your market analysis and trading strategies to new heights.
Remember, the key to success in trading is continuous learning and adaptation. Customize your workspace, experiment with different analytical methods, and stay current with software updates to extract the maximum value from your investment. With the right approach, optuma charting software can serve as a reliable ally in navigating the complexities of financial markets.
Whether you are looking to refine a detailed intraday strategy or analyze long-term market trends, the insights gained from this guide will equip you with the necessary tools to succeed. Embrace the advanced features, learn from real-world examples, and continuously refine your techniques. The dynamic world of financial markets rewards those who are diligent, informed, and technologically adept.
As you move forward, remember that every trader’s journey is unique. What works for one may not work for another, so it’s crucial to adapt the strategies outlined here to suit your individual needs and market conditions. With optuma charting software at your disposal, the power to decode market trends and make informed decisions is literally at your fingertips.
Happy charting and may your analysis lead to profitable trading opportunities!
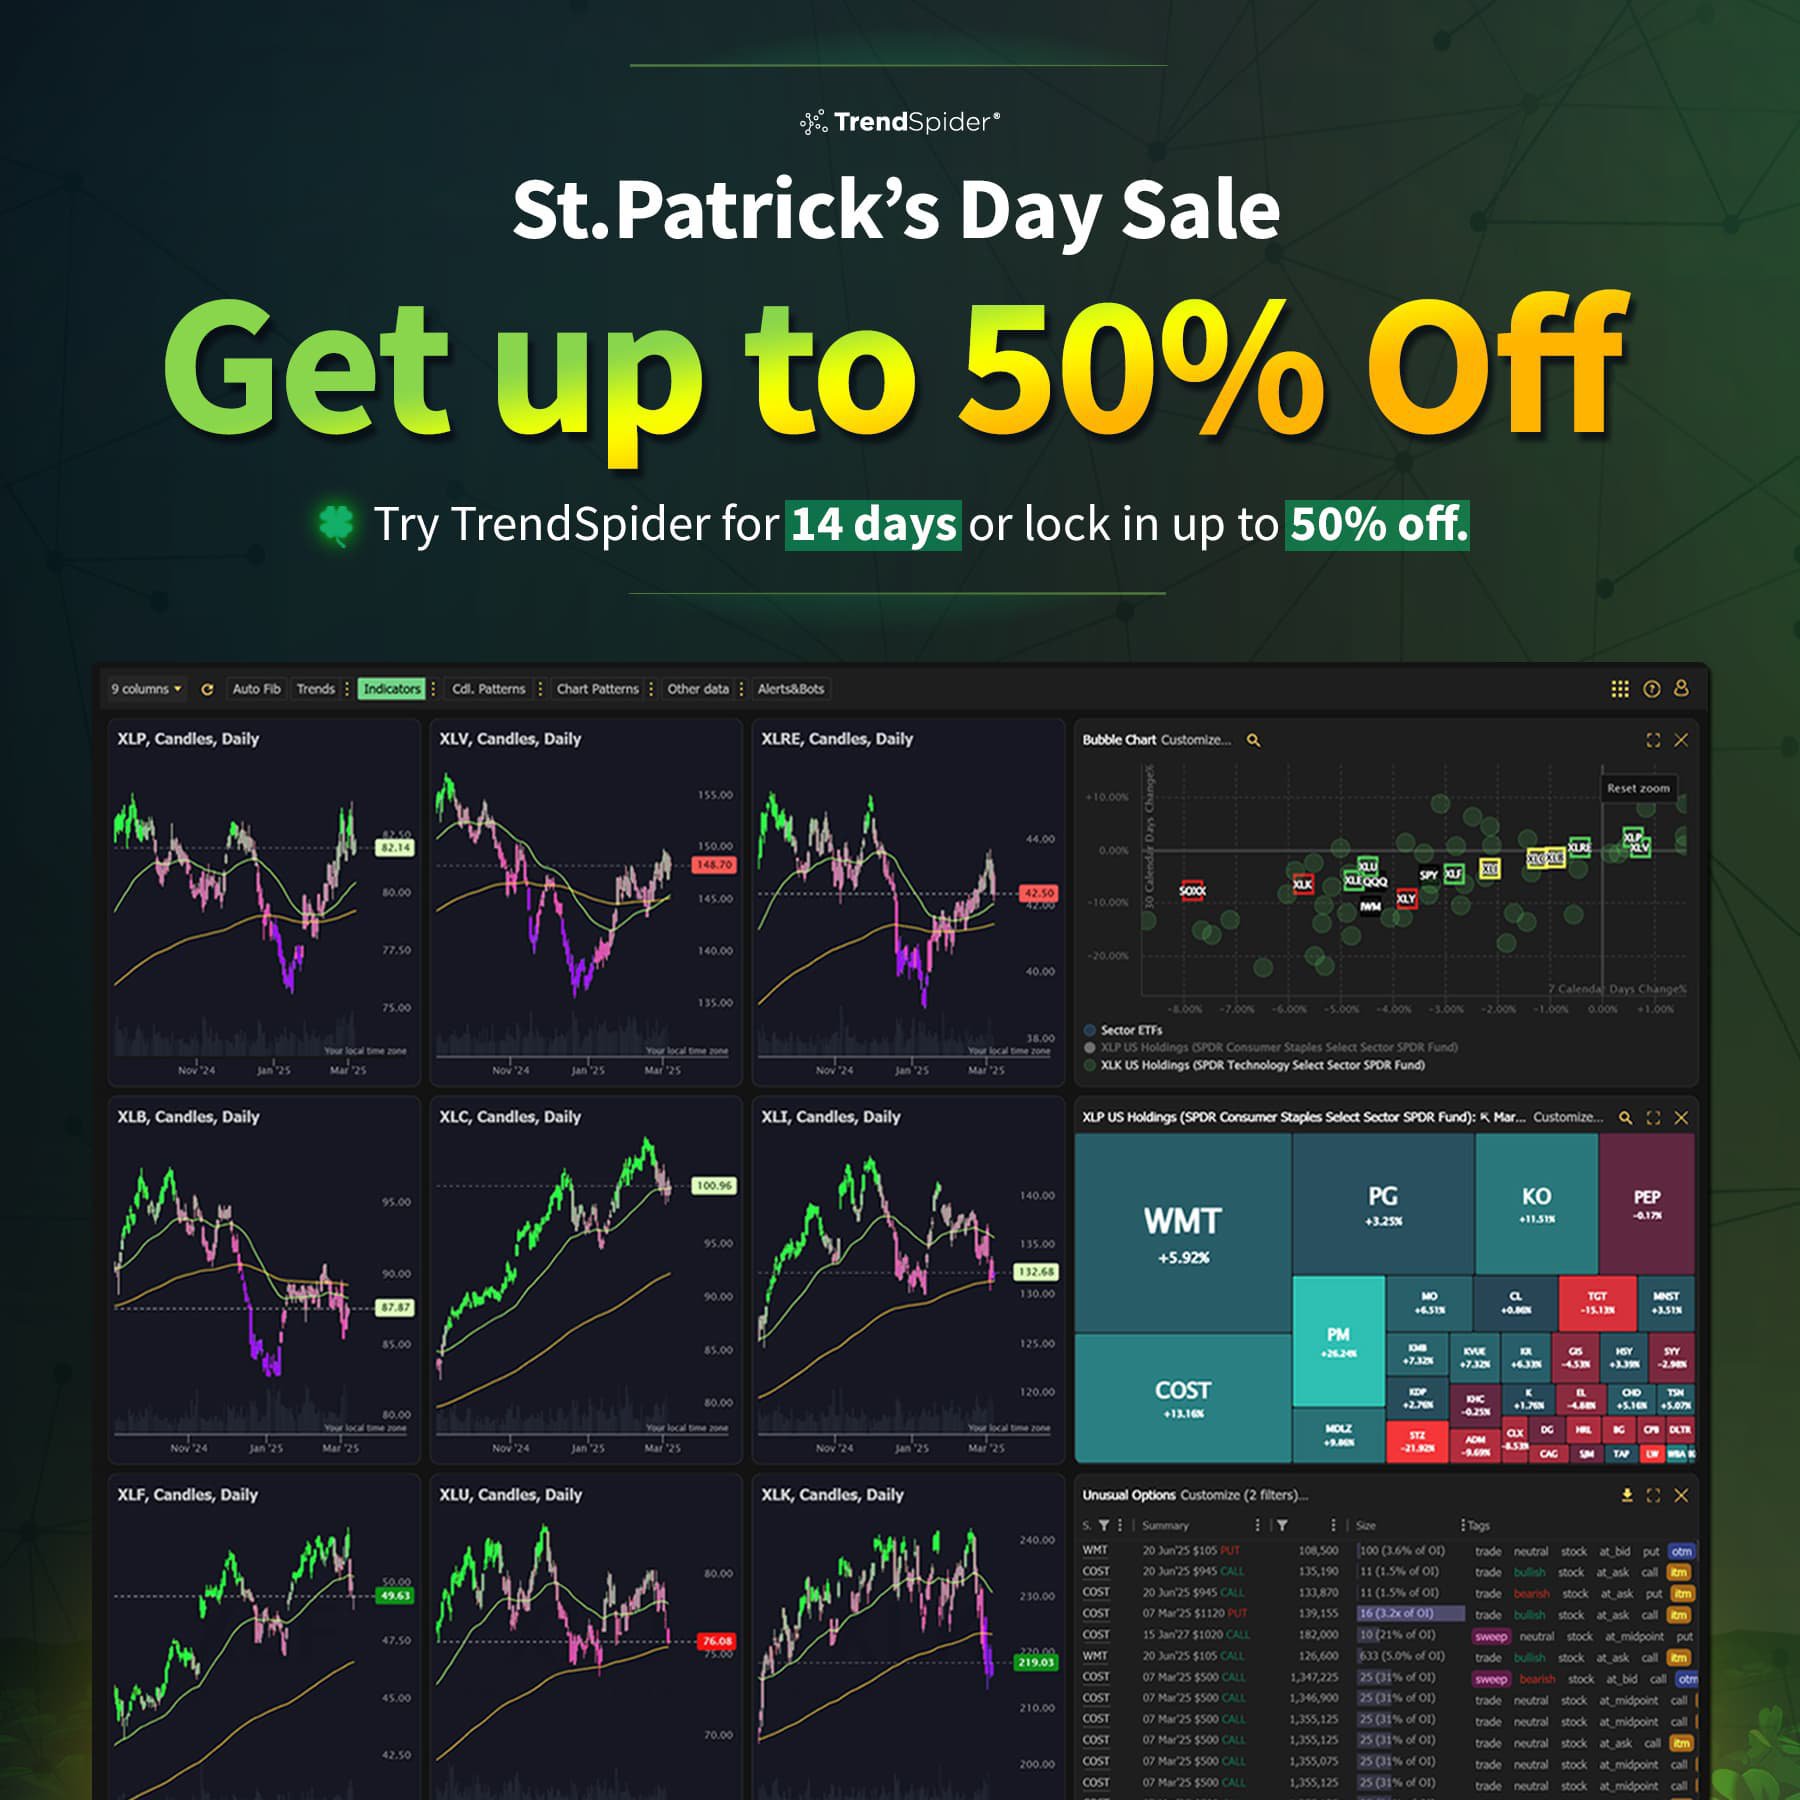
Unlock Trading Potential with Automated Analysis
Tired of missing opportunities and making suboptimal trading decisions? TrendSpider's cutting-edge platform automates complex technical analysis, saving you time and reducing human error.
With multi-timeframe analysis, dynamic alerts, backtesting, and customizable charting, you'll gain a competitive edge in identifying trends and making informed trades across global markets.

Unleash the Power of Automated Trading Analysis
Are you struggling to keep up with the fast-paced trading world? TrendSpider empowers you with cutting-edge tools for optimal strategy execution.
Our automated technical analysis suite eliminates guesswork, backtests strategies, and delivers real-time alerts, saving you valuable time and effort.


Quentin Merriweather
52 posts written