


Trade Vocab
What Does 'Tanked' Mean in Trading Terminology?
Discover what 'tanked' means in trading—how it describes sharp asset declines, causes behind these d...

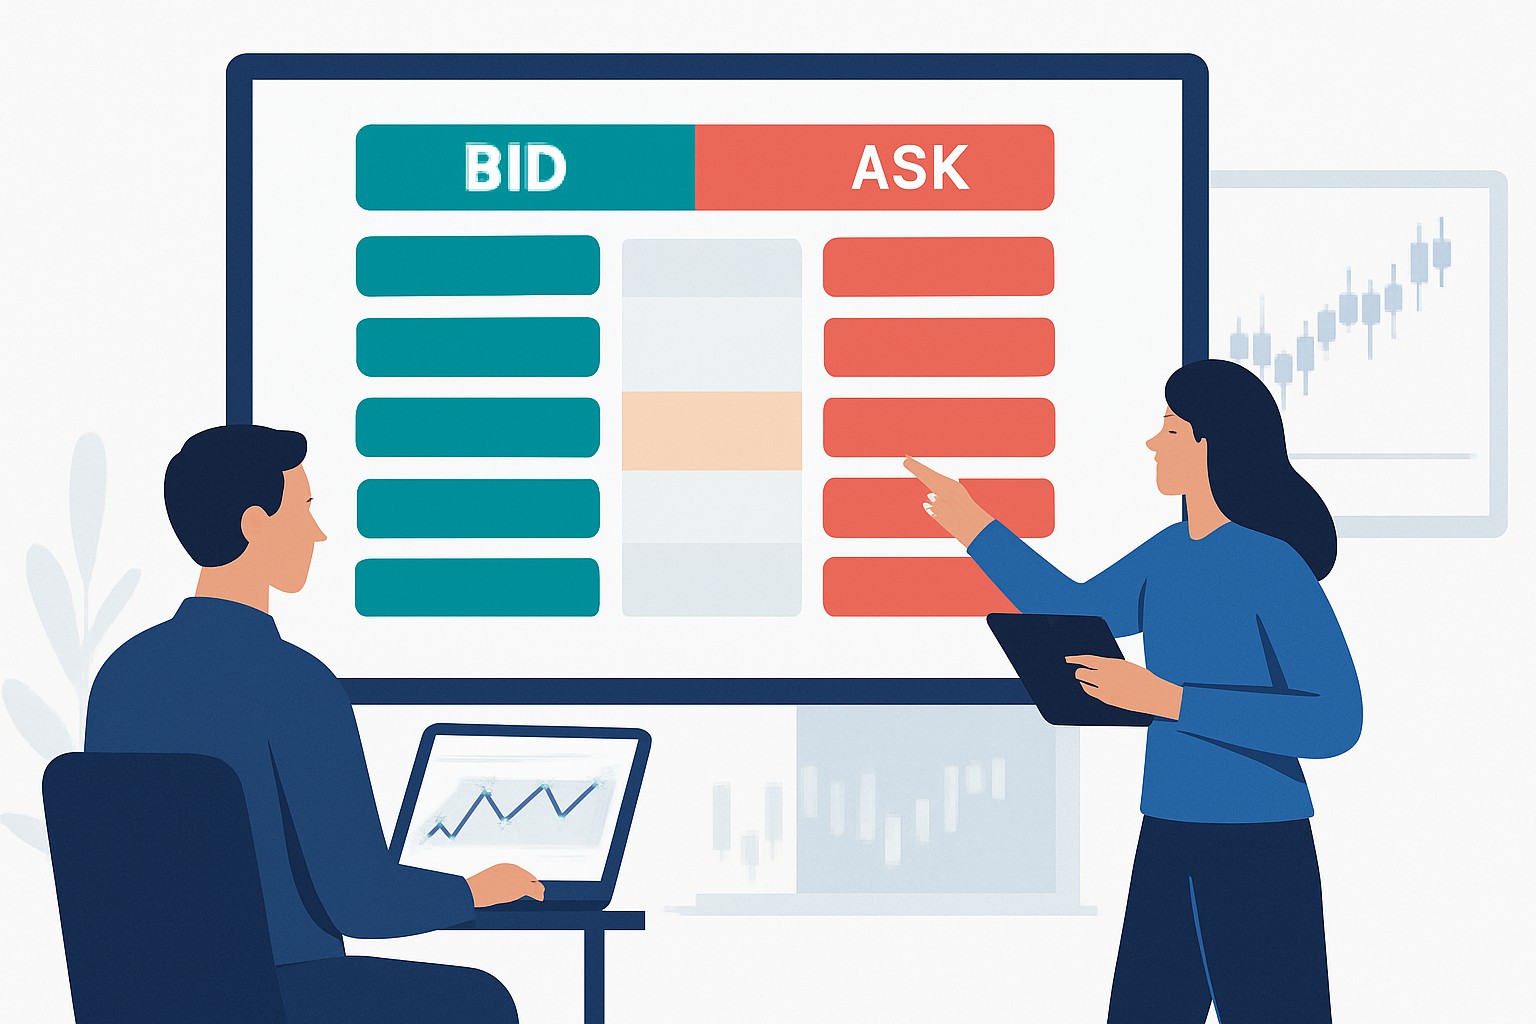
The bid-ask spread is one of those fundamental trading concepts that can trip up both fresh-faced newbies and seasoned pros alike. Simply put, it’s the gap between the highest price a buyer is willing to shell out (the bid) and the lowest price a seller is willing to settle for (the ask). Wrangling this spread and understanding what moves it is absolutely key for making smarter trades and keeping costs in check.
At any moment in the market, the bid price reflects the highest amount buyers are willing to pay for an asset. The ask price reveals the lowest figure sellers will accept.
The bid-ask spread is the numerical difference between the bid price and the ask price. It highlights the gap between what buyers are willing to pay and what sellers hope to get. This spread exists largely because liquidity providers shoulder the risk of making trades happen and aim to pocket a profit from that difference. Transaction costs, market volatility and the usual tug-of-war between supply and demand tend to push the spread wider or narrower.
| Security Type | Typical Bid Price | Typical Ask Price | Typical Spread | Description |
|---|---|---|---|---|
| Large-Cap Stock | $100.00 | $100.02 | $0.02 | Stocks that are super liquid, boasting tight spreads that keep traders happy |
| Forex Pair (EUR/USD) | 1.1010 | 1.1012 | 0.0002 (2 pips) | Major currency pairs known for their lively and bustling markets |
| Cryptocurrency (BTC/USD) | $40,000 | $40,050 | $50 | Crypto markets tend to show wider spreads, making them a bit of a wild ride |
| Small-Cap Stock | $5.00 | $5.10 | $0.10 | Stocks with lower liquidity, which often means wider spreads and a bit more wiggle room |
| Exotic Forex Pair | 1.7500 | 1.7550 | 0.0050 (50 pips) | Less commonly traded currency pairs that usually come with noticeably higher spreads, so tread carefully |
It is key to steer clear of the all-too-common mix-up between the bid-ask spread and the actual price movement of an asset. Think of the spread as a snapshot of the market’s mood at that very moment—it’s constantly on the move.
Understanding the bid-ask spread is pretty vital since it directly impacts the cost of opening and closing trades. For short-term traders and individuals using high-frequency strategies, even tiny spreads can sneak up and nibble away at profits faster than you would like. The gap between buying at the ask price and selling at the bid price means traders start off with a built-in cost—often called "slippage"—which usually balloons when spreads widen during those rollercoaster market moments.
A few key factors tend to steer how wide or narrow the bid-ask spread ends up being. Liquidity usually takes center stage here since markets bustling with buyers and sellers tend to have tighter spreads. Then there are other pieces of the puzzle—the frequency of asset trading, the overall market mood, the time of day or trading session, and the type of security with its specific rules.
Liquidity levels basically tell you how easily assets can be snapped up or sold off without shaking prices too much. When liquidity is running high, you will often notice spreads getting nice and tight.
Market volatility tends to crank up the pressure on liquidity providers, which usually results in wider spreads whenever prices start racing around quickly.
The time of day matters too, since trading volumes typically spike around market opens and closes—this hustle and bustle usually pulls spreads in tighter.
Competition among market makers is a bit like a friendly tug-of-war, pushing spreads closer together as firms hustle to reel in more order flow.
Lastly, the kind of asset and the rules governing it play their part in spread size. For example, stocks listed on major exchanges tend to have smaller spreads compared to more niche stuff like exotic currency pairs or cryptocurrencies.
Spreads tend to widen quite a bit during off-hours or when some unexpected news shakes the markets, mainly because liquidity dries up and uncertainty creeps in.
Traders often find they get better results by keeping a sharp eye on spreads. Taking a moment to check spreads before jumping into trades can really help pinpoint the best timing and steer you toward assets with lower trading costs. Using limit orders instead of market orders gives you a bit more control over the execution price.
Traders often get a leg up by comparing bid and ask spreads across different brokers or exchanges. Cryptocurrency traders on platforms like Binance usually enjoy tighter spreads thanks to the exchange's solid liquidity and deep order books.
The bid-ask spread plays a vital role but is often misunderstood more than it deserves. Lots of traders tend to think that just the bid or ask price on its own reveals the current market price, which can be a bit misleading. Some even confuse the spread with actual trading fees or assume it stays the same all the time.
The bid-ask spread is a bit like a negotiation dance floor where buyers are trying to pay as little as possible while sellers are holding out for a bit more, and the market finds its rhythm somewhere in between as conditions shift.
Picture this: a trader looking to snag 100 shares of a stock where the bid price is $50.00 and the ask price is $50.05. If they buy at the ask, they pay $50.05 per share. That is 5 cents more than the bid price. Later, when they sell, the best offer is the $50.00 bid. They face a 5-cent loss per share because of the spread, before factoring in any price swings or fees.
| Step | Bid Price | Ask Price | Spread Amount | Execution Price | Notes |
|---|---|---|---|---|---|
| Initial Quote | $50.00 | $50.05 | $0.05 | - | That small gap between bid and ask prices you see |
| Buy Order Executed | N/A | $50.05 | $0.05 | $50.05 | Snagged the shares right at the ask price |
| Sell Order Executed | $50.00 | N/A | $0.05 | $50.00 | Sold the shares at the bid price, just like that |
| Net Result | - | - | - | -$0.05 per share | That pesky spread adds up to a $5 loss on 100 shares |
This simple example really shines a light on how bid-ask spreads play out in the real world of trading. A trader has to first cover that pesky spread cost before seeing any profit roll in.
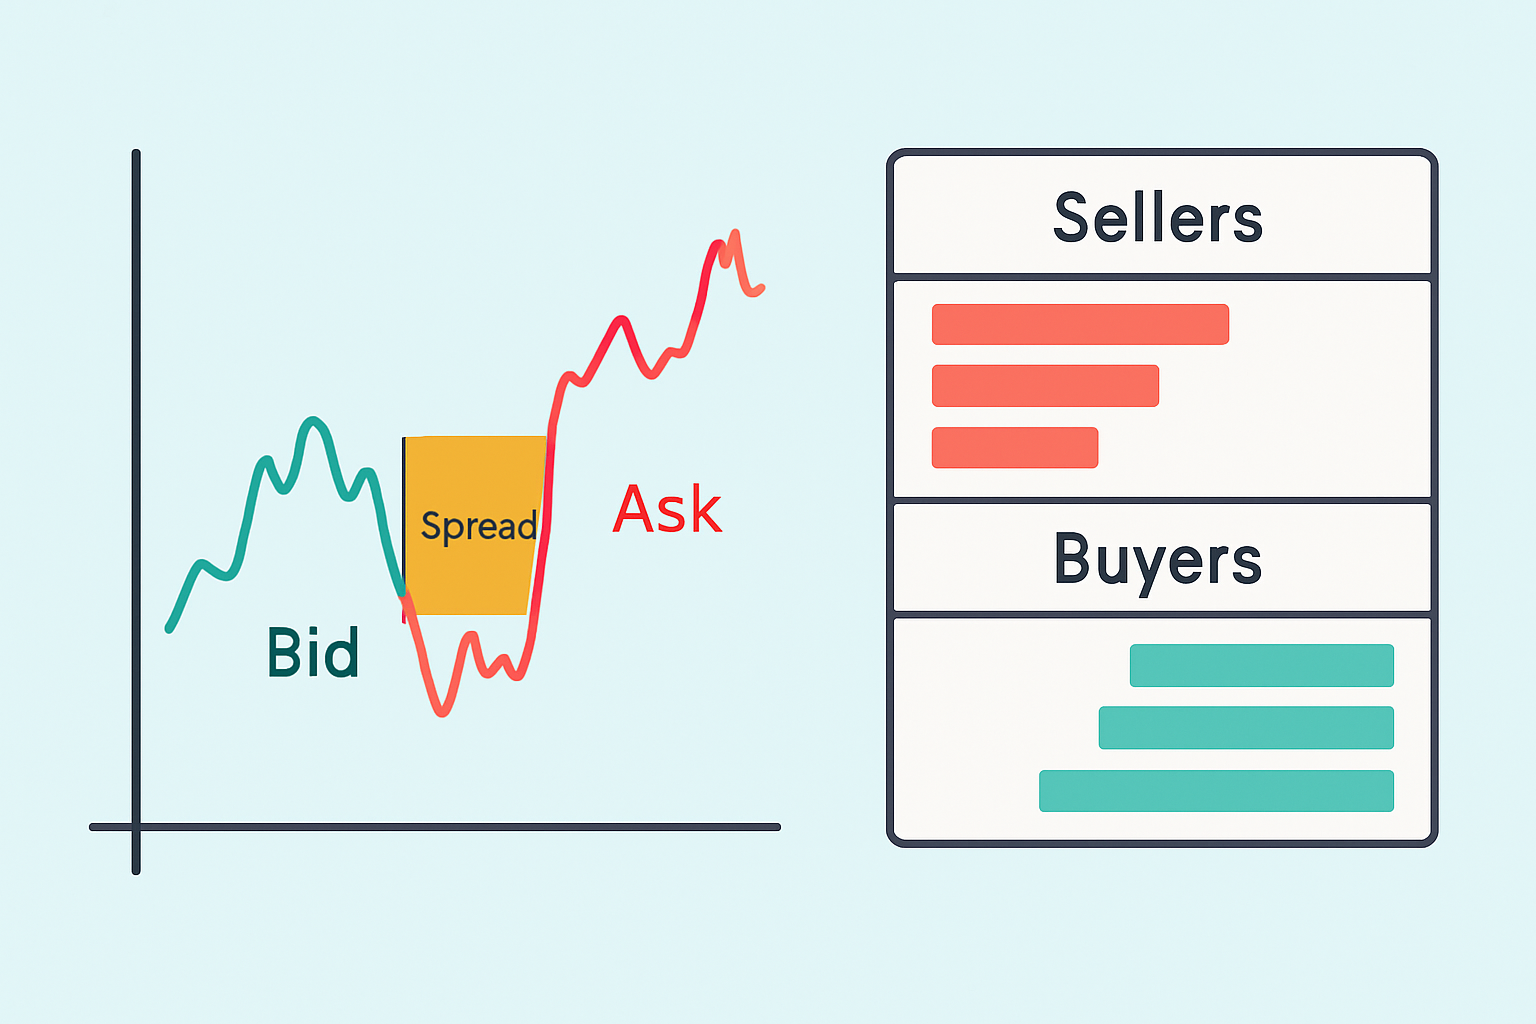
Visual diagram illustrating the bid price, ask price, and the spread gap on a price chart or order book snapshot for clarity.
The bid and ask prices give us fundamental signals from buyers and sellers while the bid-ask spread highlights liquidity, risk and transaction costs. Understanding what drives this spread and how it can affect your trading expenses and potential profits helps traders make smarter calls.
Are you looking to navigate the dynamic world of cryptocurrency trading with confidence? Coinbase is the platform you need. As a leading exchange, it offers a user-friendly interface, robust security, and a wide range of digital currencies. Unlock the potential of the crypto market with Coinbase.

23 posts written
Discover what 'tanked' means in trading—how it describes sharp asset declines, causes behind these d...
Understanding 'ATH' or All-Time High is essential in crypto trading. Learn what it means, why it mat...
Explore the dovish meaning in trading—understand its origins, market implications, and why recognizi...
Discover what ZIRP means, why central banks set interest rates to zero, and how this policy shapes m...