

Isla Wyndham
23 posts written
Day Trading vs Options - Key Differences
Explore the detailed contrasts between day trading and options trading, highlighting how each strategy caters to different trader profiles and market approaches.

Building algorithmic options trading systems
Discover how to build algorithmic options trading systems from foundational concepts to advanced execution, enabling consistent, data-driven trading strategies.
How trading options on futures works?
Explore how trading options on futures can diversify your portfolio and manage risk with leverage. This guide covers basics, strategies, risks, and tools to start confidently.
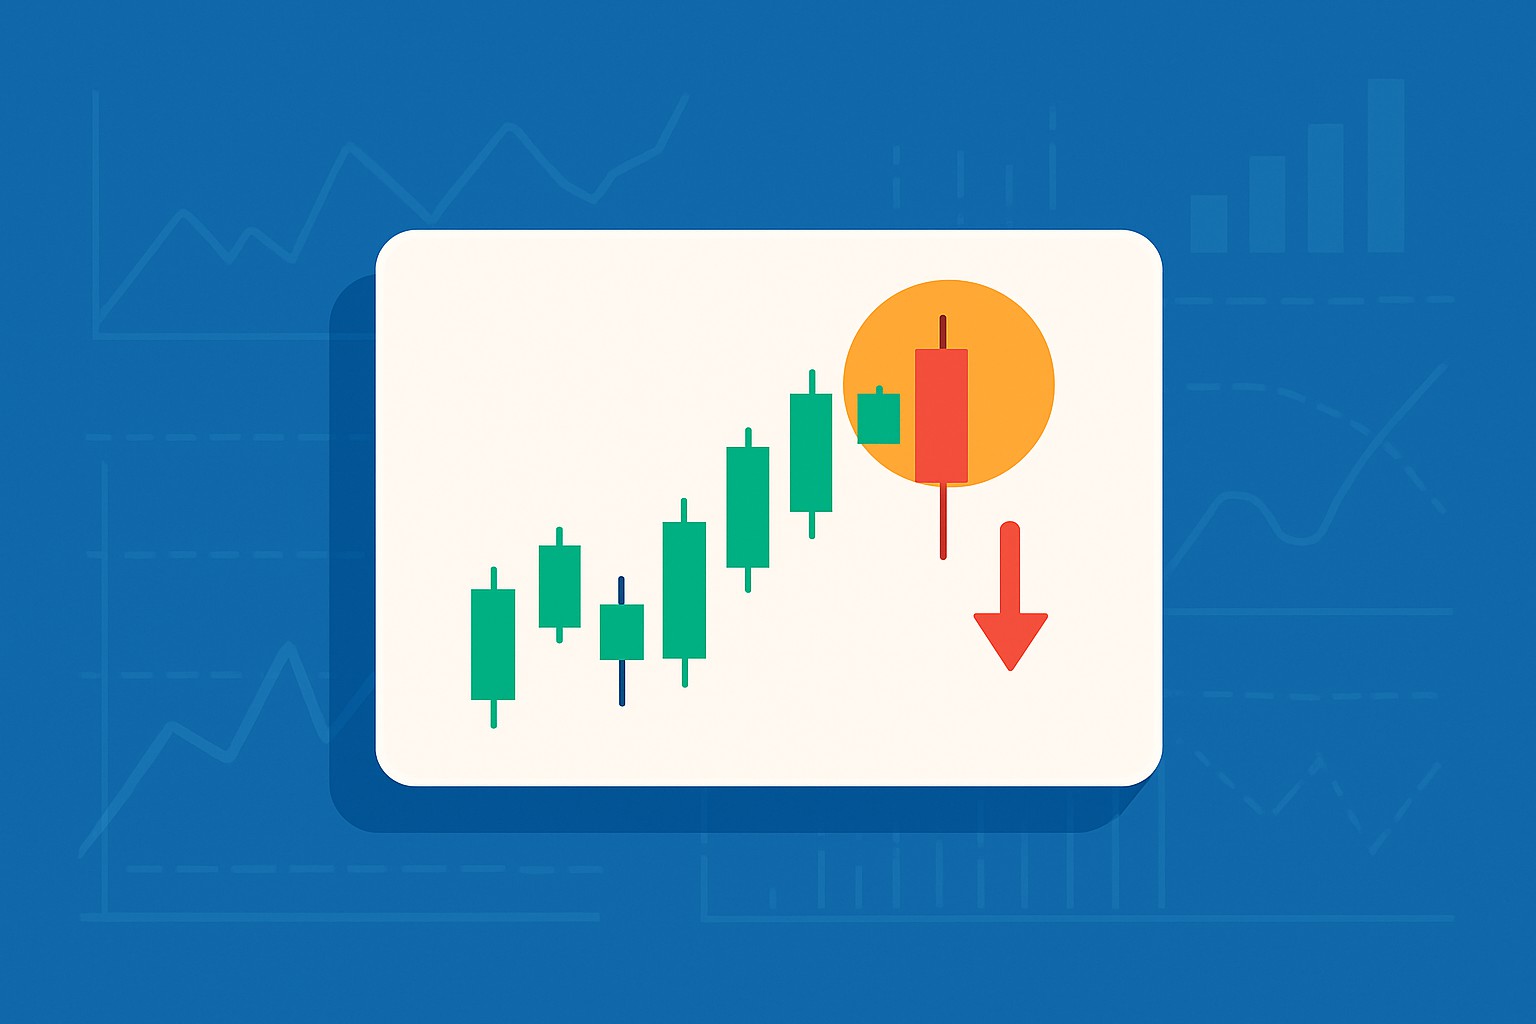
Spotting Hanging Man Formations on Stock Charts
Master the hanging man formation to spot potential bearish reversals confidently. This guide breaks down its identification, psychology, and practical trading tips for all skill levels.
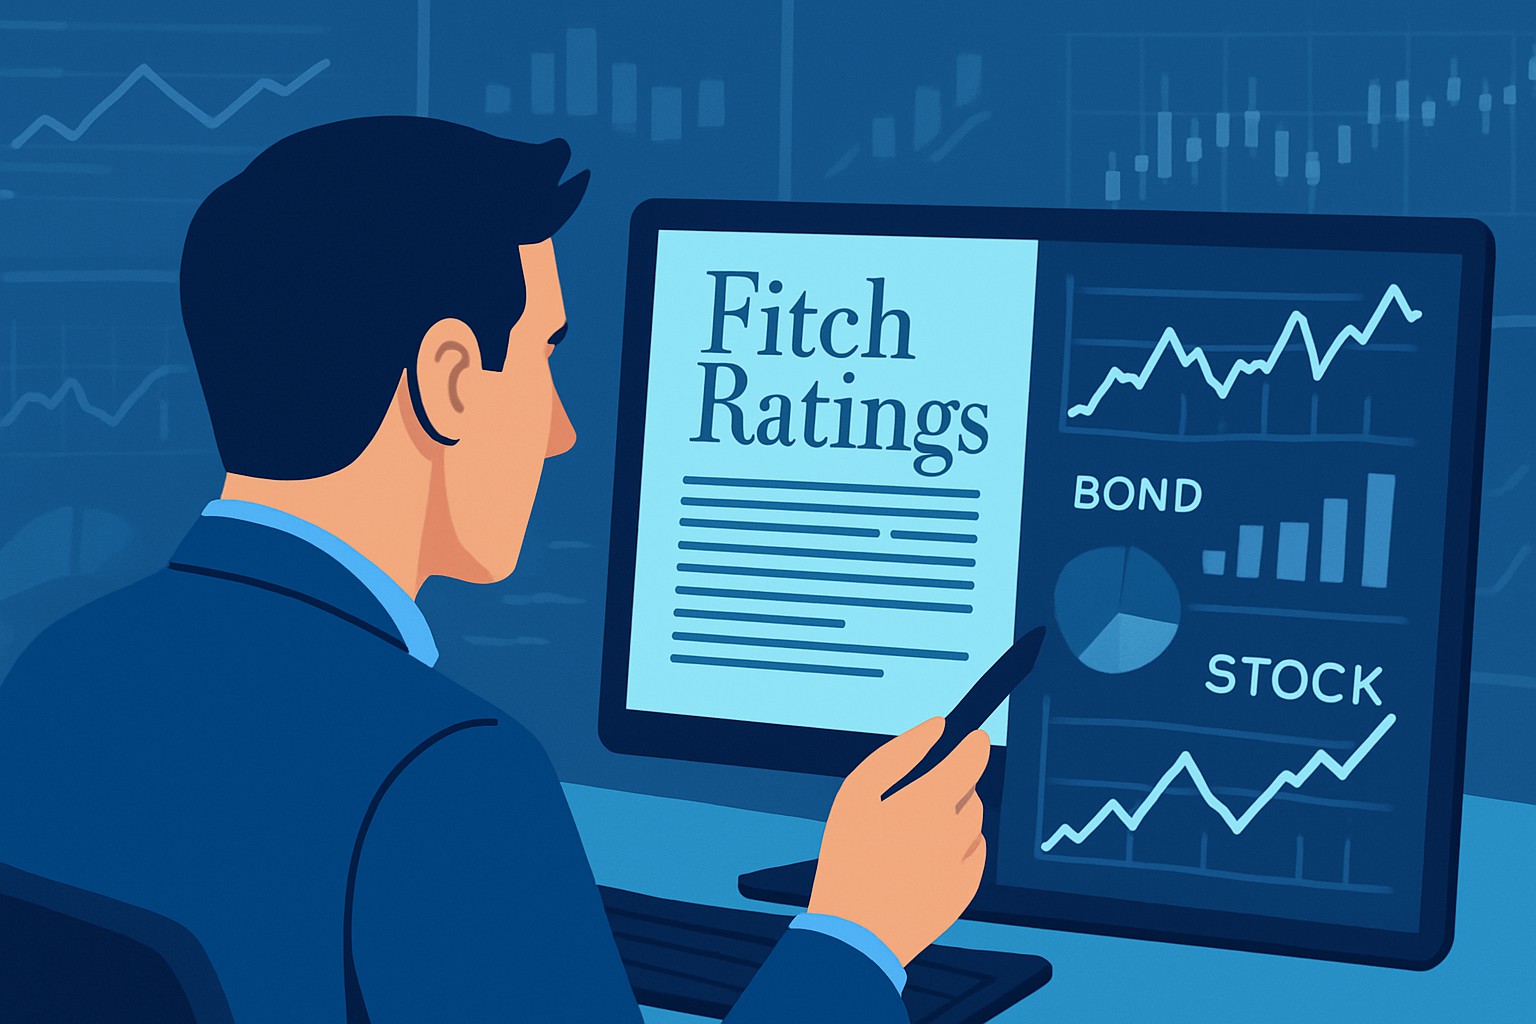
Fitch Ratings Explained for Stock and Bond Traders
Discover how Fitch Ratings assess credit risk and influence trading decisions in stocks and bonds. Learn to interpret their rating scale and improve your investment strategy.
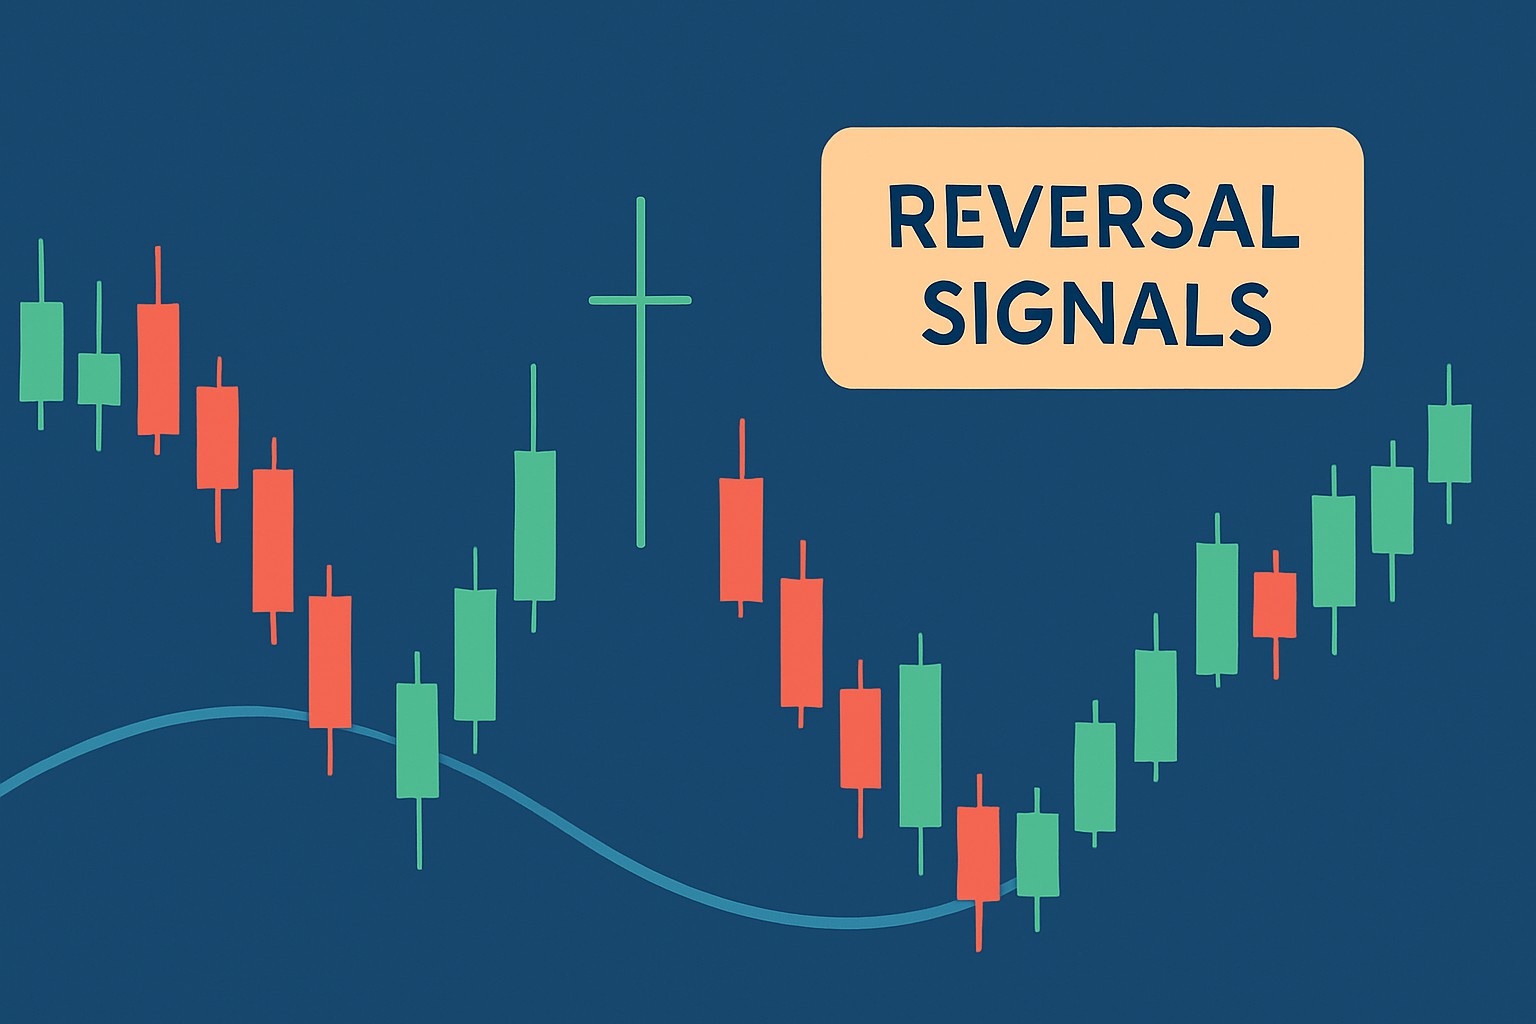
How to Spot and Trade the Dragonfly Doji Reversal Signal
Discover the dragonfly doji candlestick pattern, a key reversal signal in trading, and learn practical strategies to spot and trade it effectively.
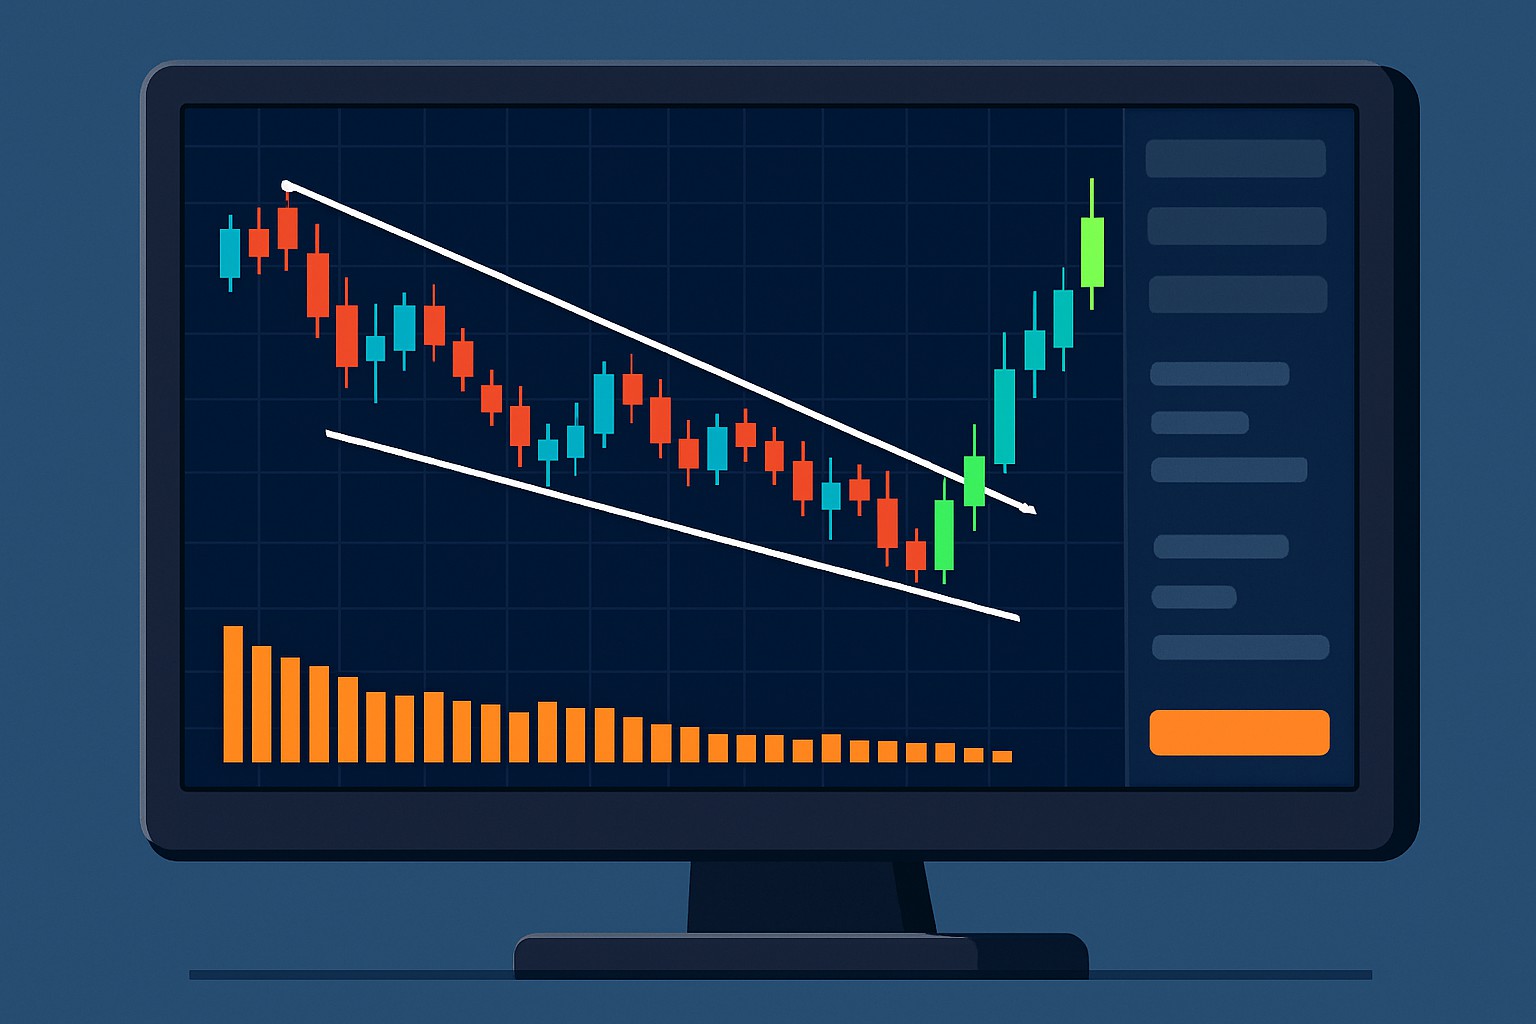
Descending Wedge Explained for Spotting Bullish Reversals
Discover the descending wedge pattern—a key technical tool that helps traders spot bullish reversals early. This guide simplifies the concept, breaking down how to identify and trade this powerful chart pattern confidently.
The Meaning Of Whipsaw In Trading Terms Explained
Discover what whipsaw means in trading, why it occurs, and how to recognize and manage sharp price reversals to protect your trades.
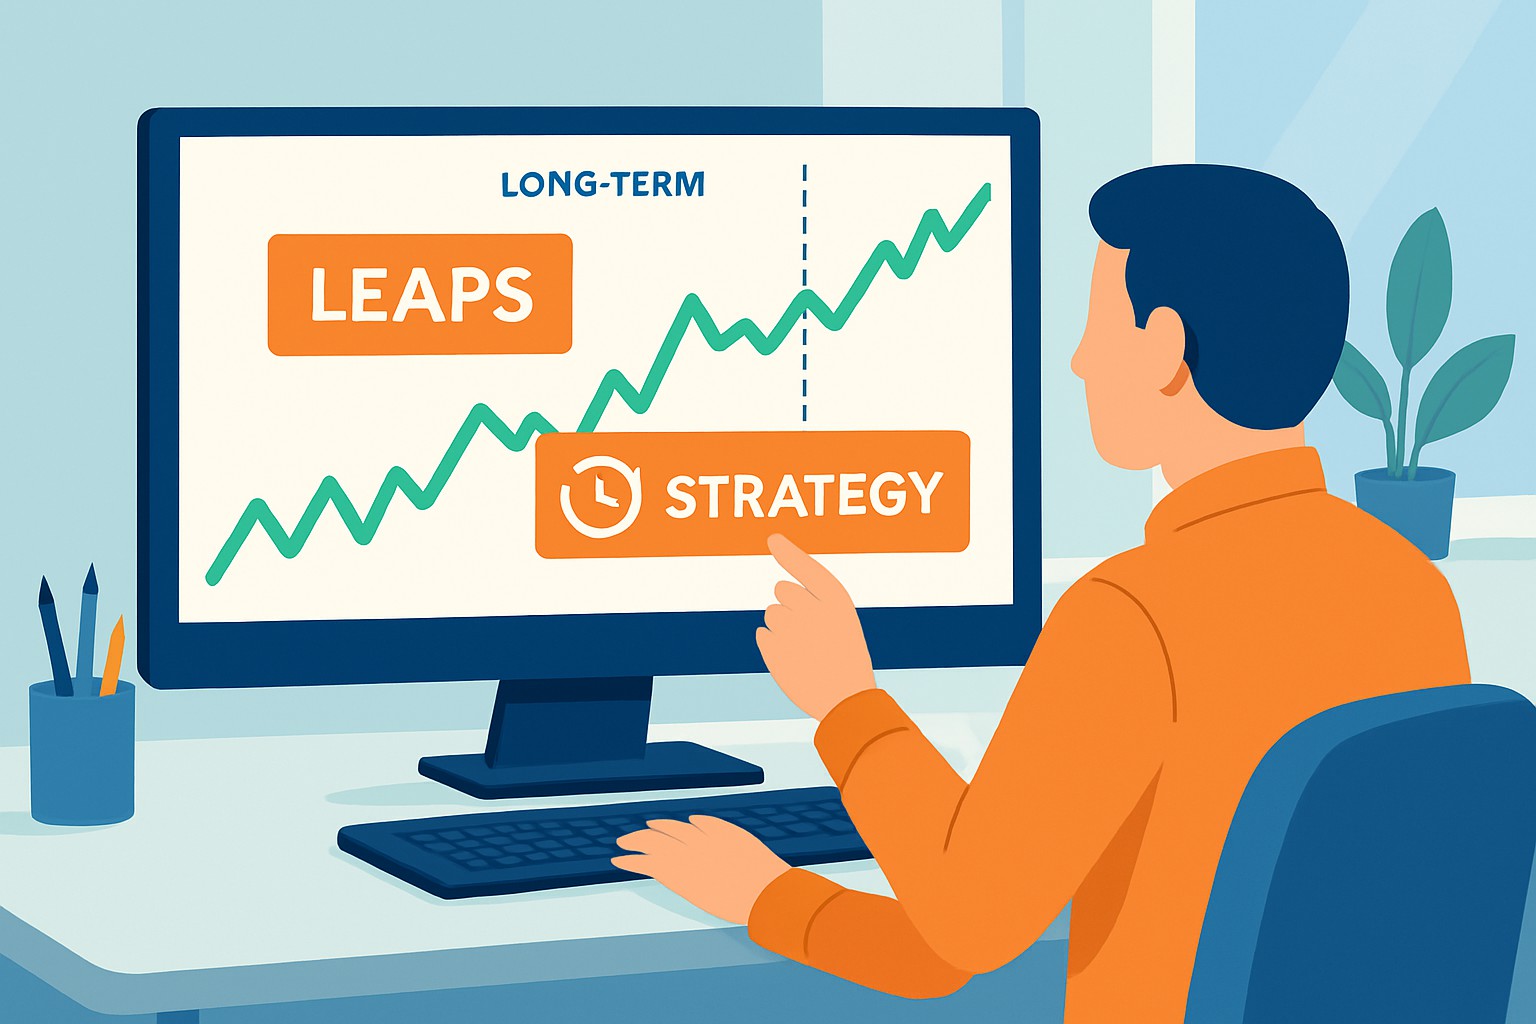
How Leaps Options Trading Differs from Regular Options Trading
LEAPS options provide a longer-term, less stressful way to trade options compared to regular short-term contracts. Learn the basics, key differences, and beginner strategies here.
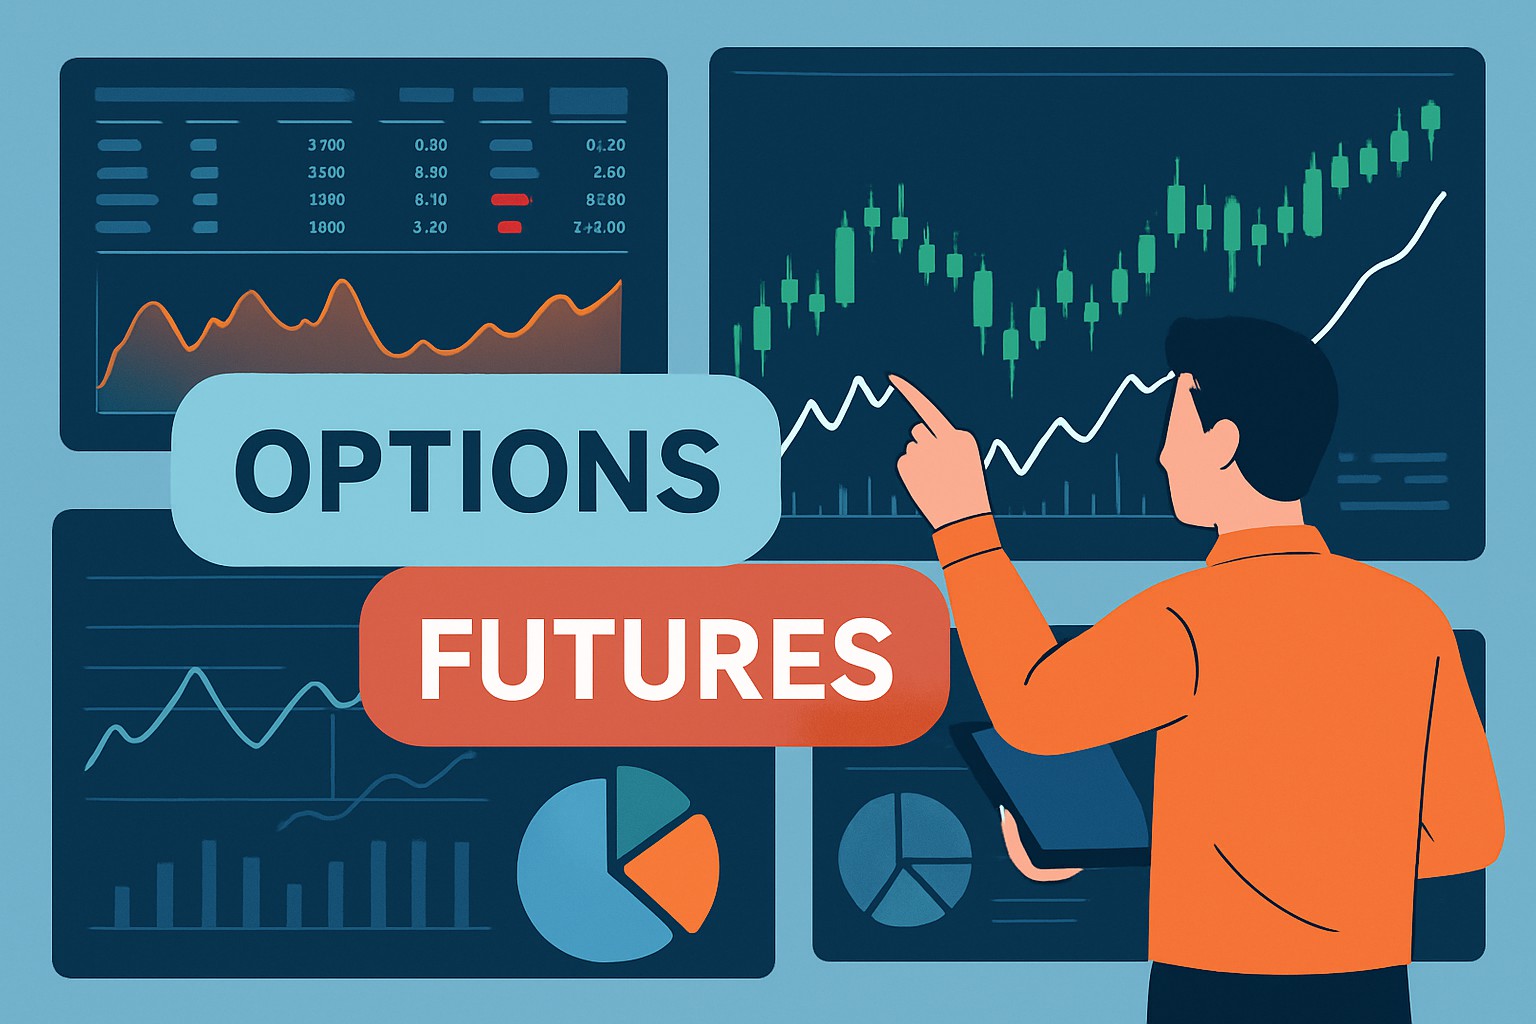
Key Differences between Options vs Futures Trading
Options and futures represent key derivatives in markets. Understand their differences in obligations, risk, strategies, and costs to choose the right trading approach.
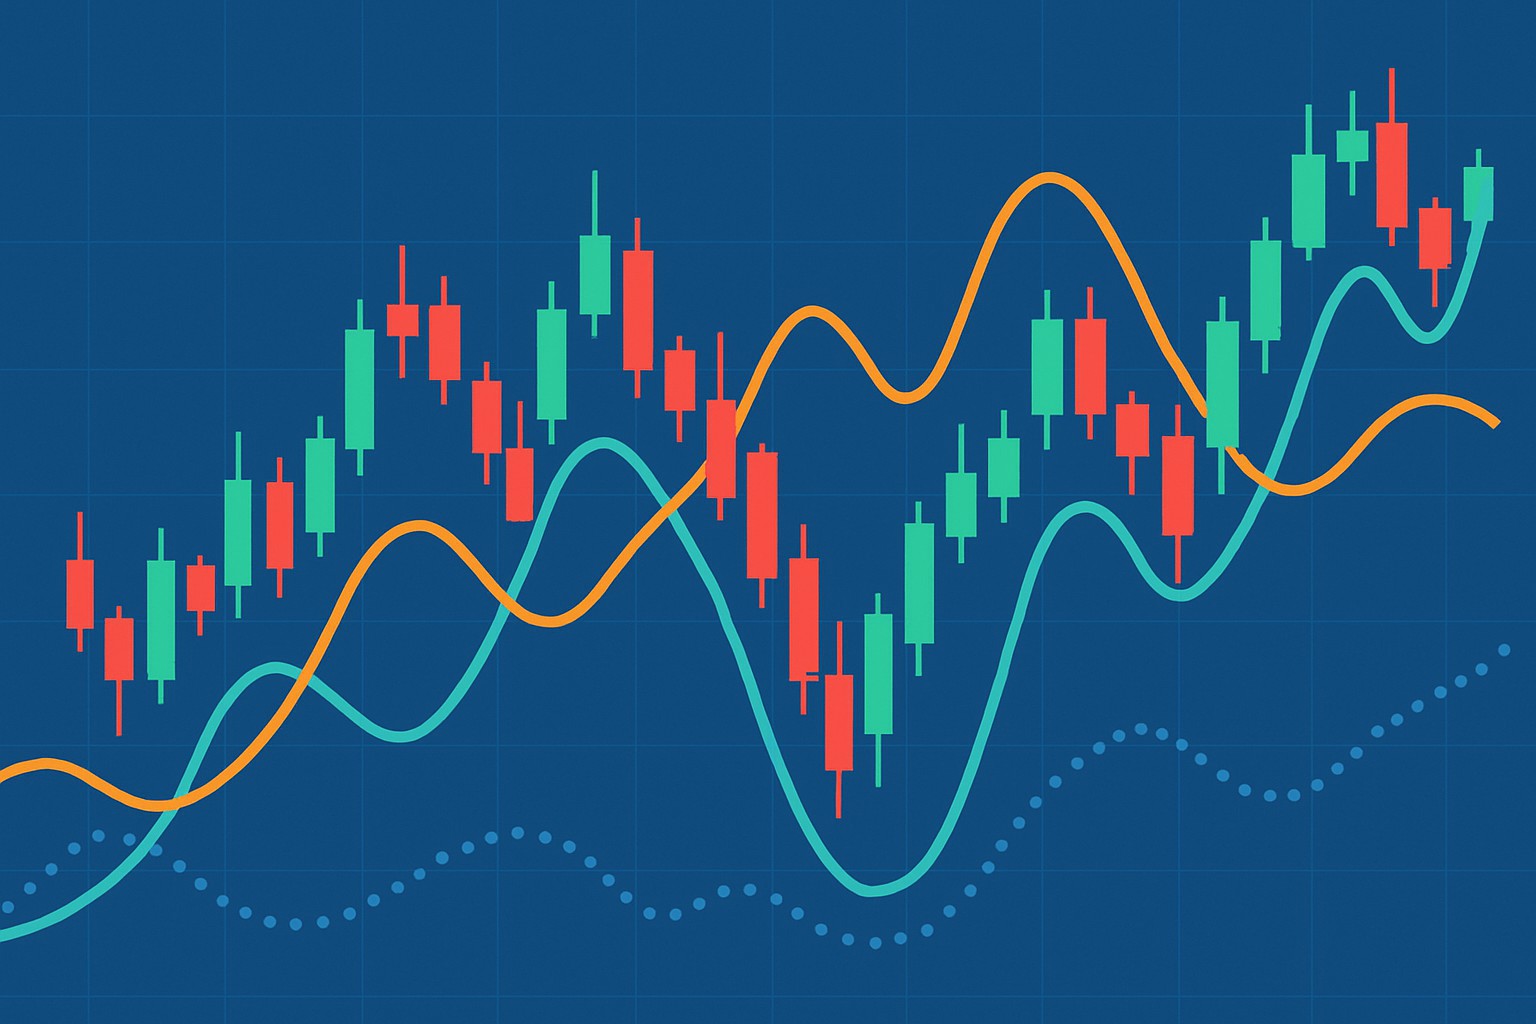
EMA Meaning and Why It Helps Spot Trend Direction
Understanding the EMA meaning empowers traders to identify market trends faster and with greater confidence. This article breaks down the Exponential Moving Average, explaining its calculation, usage, and common strategies.
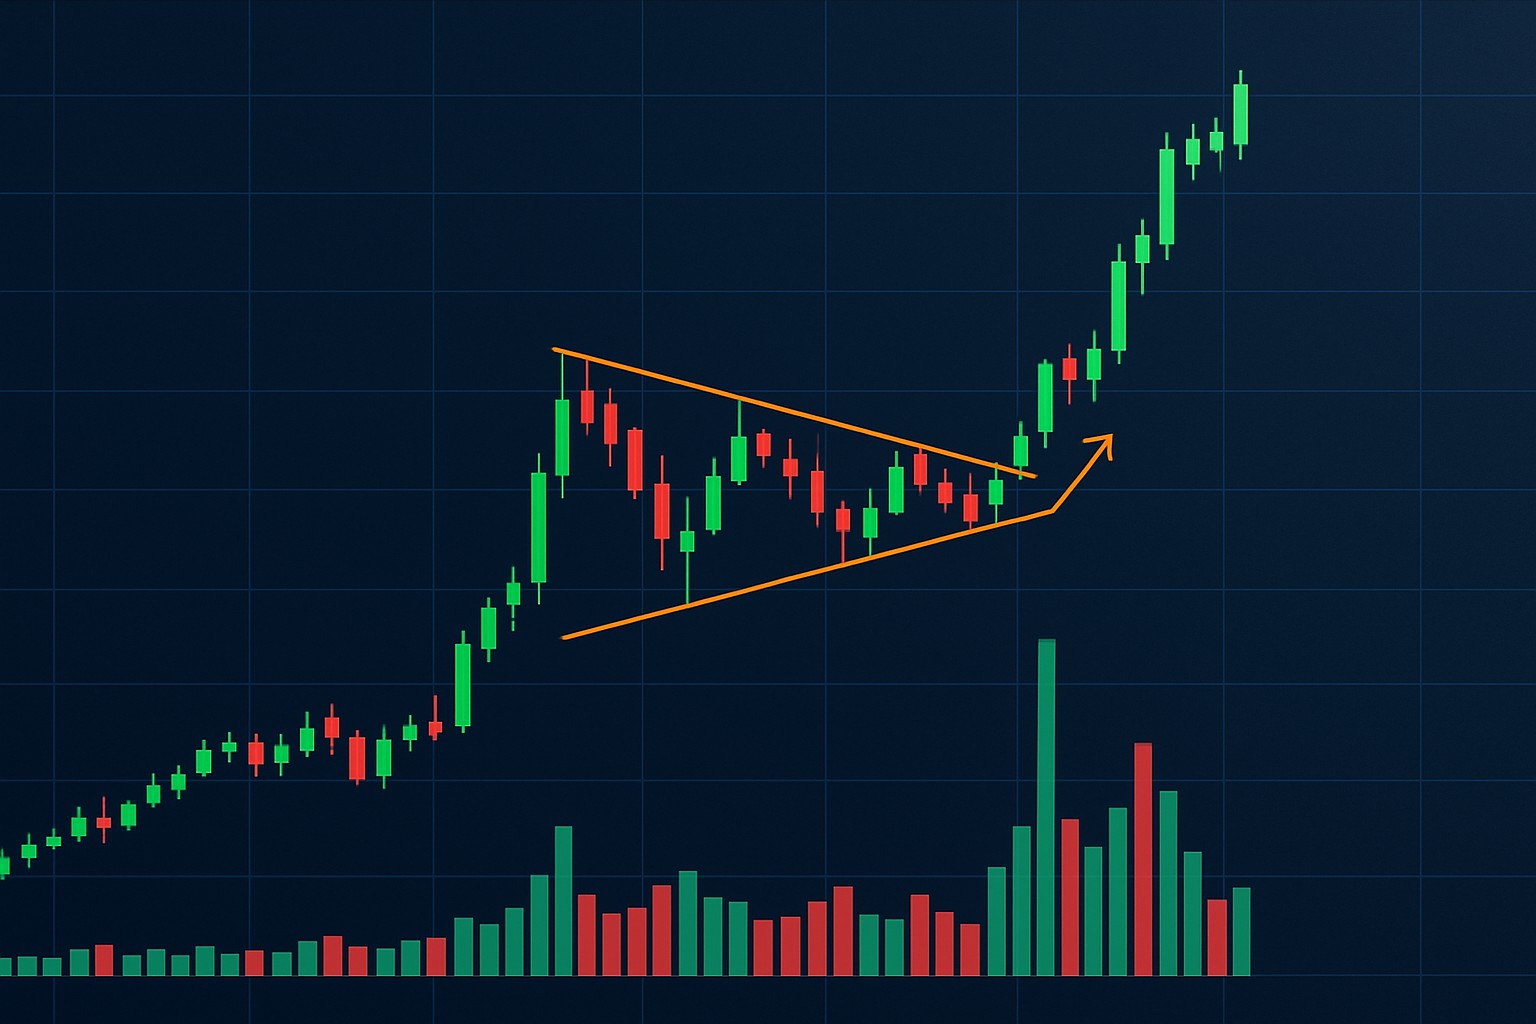
How to Spot a Bullish Pennant Formation on Charts
Discover how to spot bullish pennant formations on price charts, understand their significance, and use them to harness potential uptrends confidently—even if you're new to trading.

