Mastering Advanced Charting with Edgewonk's Tools

In today's fast-paced trading environment, mastering advanced charting with edgewonk is not just a competitive advantage—it fundamentally transforms the way traders analyze their performance, develop strategies, and make informed decisions. As traders increasingly rely on data-driven insights, Edgewonk's innovative suite of charting tools is setting new standards in precision and clarity. This article explores the evolution of technical analysis, delves into the advanced charting techniques provided by Edgewonk, and offers actionable insights to elevate your trading game. Whether you’re an experienced professional or a budding trader, understanding the nuances of these dynamic tools can redefine your approach to trading performance, risk management, and long-term success.
The Evolution of Charting in Trading
Charting has long been a cornerstone of technical analysis, providing a visual representation of market trends, price action, and trading volumes. In the early days of trading, charts were rudimentary, relying on style and manual entries that required a deep understanding of market psychology in addition to technical analysis. As technology advanced, so too did the sophistication of charting software. Today, platforms like Edgewonk merge cutting-edge statistical tools with real-time data, empowering traders to identify minute details and subtle shifts in market sentiment that would have gone unnoticed using traditional methods.
Traders have historically relied on basic technical indicators like moving averages, Bollinger Bands, and candlestick patterns. However, the modern trading landscape demands more refined analytical tools that can interpret a multitude of data points instantly. Advanced charting with edgewonk provides users with the capability to analyze the granular details of market behavior. With its customizable dashboards, interactive charts, and a host of in-depth statistical analysis features, it bridges the gap between raw data and actionable trading insights.
The transformation in charting methods extends beyond the use of conventional indicators. Today’s strategies incorporate algorithmic trading patterns, machine learning insights, and a vast array of performance metrics that are integral for managing risk. Practical charting is now about synthesizing multiple layers of information—from macroeconomic signals to micro-level market noise—into a coherent strategy that can adapt in real-time.
Edgewonk stands out because of its unique approach that puts the trader at the center of the analysis. It doesn’t merely display charts; it interprets them. For example, a trader can use the advanced features to overlay psychological insights, such as tracking behavioral biases that emerge in trading patterns. This includes tracking entries and exits, risk-reward ratios, and even the emotional states associated with market highs and lows. The ability to correlate these variables and see the 'story' behind market movements is what distinguishes Edgewonk's advanced charting from the traditional methods.
Another significant element of advanced charting is the integration of historical data with modern analytics. Edgewonk leverages historical datasets to provide context for current performance, allowing traders to back-test various scenarios and forecast potential outcomes. By comparing past trends with present conditions, it's possible to identify recurring patterns or outliers that signal market transitions. For instance, the ability to detect when a particular pattern deviates from the norm can be crucial in preventing losses during sudden market downturns.
Furthermore, the importance of real-time updates cannot be overstated. In fast-moving markets, outdated information is not only unhelpful; it can be downright dangerous. Edgewonk’s tools are designed to assimilate real-time data streams, ensuring that the charts reflect the latest market conditions. This capacity for immediate responsiveness gives traders the edge needed to act decisively.
Edgewonk bridges the gap between manual chart analysis and the need for automation. By integrating algorithmic benchmarks, traders can set up automated alerts based on specific chart patterns or price levels. This feature ensures that even when a trader is not actively monitoring the market, they can still receive critical updates, making timely decisions even when away from their screens. Coupled with customizable reporting tools, these automated systems empower traders to refine their strategies steadily and continuously.

Deep Dive into Edgewonk's Toolset
Edgewonk's toolset is meticulously designed to cater to both novice and professional traders. The robust features are intuitive enough for beginners, yet sophisticated enough to satisfy the needs of high-frequency day traders and institutional investors alike. At its core, Edgewonk offers a visually rich dashboard that provides an at-a-glance view of your trades, performance metrics, and evolving market dynamics.
Key Features and Functionalities
Customizable Dashboard:
- Traders can build their own dashboards, selecting which metrics and charts are most relevant to their trading style. This flexibility means the system works for everyone—from trend followers to contrarian strategists.
- Widgets can be added or removed, allowing users to maintain focus on what's critical, avoiding unnecessary noise or clutter in their analytical view.
Detailed Performance Analytics:
- Performance metrics include win/loss ratios, risk-reward distributions, and a full breakdown of each trade's contribution to the overall portfolio.
- The toolset provides deep insights into trading habits, such as average hold time, peak drawdowns, and recovery rates. This data is presented visually through interactive charts to highlight strengths and areas needing improvement.
Behavioral Analysis:
- One standout feature is the incorporation of behavioral analytics. Edgewonk not only tracks the hard numbers but also provides insights into the psychological decisions behind each trade.
- This functionality helps audit your trading behavior over time, pinpointing issues like overtrading, revenge trading, or impulsive decision-making. Over time, this insight paves the way for improvement in discipline and strategic planning.
Risk Management Tools:
- Effective risk management is vital for any trader. Edgewonk allows you to set risk parameters for each trade, alert you when positions exceed predetermined risk levels, and guide you on optimal position sizing.
- The integration of these risk management tools directly into the charting interface ensures that risk assessment is a continuous part of your trading routine rather than an afterthought.
Backtesting Capabilities:
- Utilizing historical data, Edgewonk’s backtesting feature offers a simulation environment where strategies can be tested before being executed in live markets.
- This functionality is invaluable for tweaking trading strategies, ensuring that any approach is subjected to rigorous historical performance analysis.
Together, these features create an environment where charting becomes both an art and a science. With its combination of detailed performance metrics and behavioral analysis, Edgewonk’s advanced charting tools provide a holistic view of trading performance that is unmatched by conventional platforms.
Understanding the Interface
The Edgewonk interface is both functional and aesthetically pleasing. After logging in, users are greeted with a well-organized dashboard that displays trade summaries, performance graphs, and alert messages. The interface is designed with usability in mind, allowing users to easily toggle between different sections such as trade logs, performance graphs, and risk analytics.
The design emphasizes clarity, with color-coded charts and intuitive icons that help identify critical statistics. For instance, profitable trades might be highlighted in green while losses are marked in red, providing at-a-glance insights into overall performance. Each chart and graph comes with interactive elements such as tooltips and zoom functions, making deep dives into data both effortless and engaging.
A particularly powerful element of the interface is its capacity for personalization. Users can adjust the layout, choose which metrics are front and center, and even change the color palette to suit their preference. This level of customization ensures that each trader can create a workspace that maximizes their analytical efficiency and aligns with their personal workflow.
The Integration of Automated Insights
One of the remarkable aspects of Edgewonk’s toolset is its automated insights. The platform employs algorithms to analyze trading patterns continually and then provide recommendations based on observed trends. For example, if a trader consistently underperforms during certain market conditions, the system might highlight these periods with suggestions for alternative strategies or triggering stop-losses at more optimal moments.
Automation in charting is a double-edged sword that, when used responsibly, enhances the analytical process without replacing human judgment. The goal of automated insights isn't to rely entirely on the system but to use it as a complement to a trader’s skill set. In the fast-paced world of charting, these suggestions can serve as early warnings, ensuring that traders remain cognizant of risks they might otherwise overlook.
In summary, Edgewonk’s toolset represents a significant leap forward in the landscape of trading analytics. By seamlessly combining robust performance metrics, behavioral insights, and risk management strategies, the platform provides a comprehensive environment where advanced charting with edgewonk becomes the norm. This integration of technology and analytics not only improves operational efficiency but also ensures that every decision is backed by thorough data analysis and historical context.
Advanced Charting Techniques with Edgewonk
Advanced charting with edgewonk is not merely about creating visually appealing graphs; it is about extracting actionable insights from complex data sets to empower traders. This section details various advanced charting techniques that can help transform raw trading data into a powerful strategy tool.
Time Frame Analysis and Multi-Dimensional Charts
Trading across different time frames necessitates a flexible charting system. Edgewonk excels in this area by providing multi-dimensional charts that allow traders to compare short-term and long-term trends side by side. By adjusting time frames dynamically, users can discern patterns that are not evident when viewing one scale alone. For example, a trader might notice a short-term dip within a longer-term uptrend, signaling an opportune moment for a tactical entry.
This multi-dimensional approach is beneficial because market behavior varies significantly over different time frames. Daily fluctuations may indicate noise, while weekly charts reveal broader trends. By using Edgewonk’s advanced features, traders can overlay these time frames to identify correlations and divergences. One common tactic involves using candlestick patterns on shorter time scales to signal potential reversals suggested by macro trends from longer-term charts.
Integrating Technical Indicators
Beyond simple price charts, Edgewonk enables the integration of various technical indicators that provide deeper insights. Technical indicators such as Relative Strength Index (RSI), Moving Average Convergence Divergence (MACD), and Fibonacci retracements help quantify market momentum and potential reversal points. By overlaying these indicators on custom charts, traders can visualize where to potentially take profits or cut losses.
A critical factor when using multiple indicators is avoiding information overload. Edgewonk addresses this issue with a user-friendly interface that allows selective layering of indicators. Traders can choose to display only the indicators that are most relevant to their strategy at any given moment. The flexibility in managing these overlays ensures that the charts remain clear while still providing the depth of analysis needed to extract actionable signals.
Custom Chart Annotations and Comparative Analysis
A unique feature of Edgewonk's advanced charting is the ability to annotate charts with custom notes and analytic layers. This function is particularly useful during live trading or after-action reviews, where understanding the rationale behind each trade can lead to deeper performance insights. By marking key events—such as entry/exit points, significant news events, or market anomalies—traders can compile a comprehensive log that easily correlates chart movements with trading decisions.
Comparative analysis is another aspect where Edgewonk shines. The platform allows traders to compare performance across different strategies or market conditions. For example, you might overlay charts for multiple assets to see if certain sectors react similarly in volatile markets. This cross-referencing enables not only identification of trends but also the derivation of adaptive strategies that mitigate risk across a diversified portfolio.
Actionable Signal Generation
At the heart of advanced charting is the process of signal generation. Edgewonk leverages both historical analyses and real-time data to generate actionable signals that can be directly integrated into a trading plan. These signals are not mere alerts; they come with a detailed breakdown explaining the conditions that triggered them, ranging from specific technical thresholds to complex market sentiment shifts.
Using these signals tactically requires a disciplined approach. Experts recommend that traders treat each signal as a data point to be evaluated within the broader context of their trading plan. Combining these alerts with manual chart analysis can significantly enhance decision-making processes, ensuring each trade is supported by both automated and human insights.
Automated signal generation also ties closely with risk management. For instance, if a signal suggests a market downturn, the platform may advise a reduction in position sizes or prompt the activation of stop-loss orders. This confluence of advanced charting with actionable signals ensures that traders are not left guessing but are instead equipped with precise recommendations for real-time market movements.

Integration with Trading Systems and Real-Time Data
One of the key advantages of using advanced charting with edgewonk is its seamless integration with various trading systems and platforms. Connected trading ecosystems increase efficiency by syncing data across different analytical tools and trading accounts. The result is a unified interface that consolidates performance metrics and real-time market data, reducing the cognitive load on the trader.
Cross-Platform Data Synchronization
Edgewonk supports a wide variety of trading platforms, ensuring that data flows smoothly from your broker to the charting interface. This synchronization guarantees that every trade executed is automatically logged, analyzed, and available for review within the system. The seamless data integration eliminates manual data entry, reducing the risk of errors while also saving valuable time. Traders can thus focus more on strategy execution rather than administrative tasks.
Real-time data feeds are particularly crucial during volatile market conditions. Edgewonk’s integration capabilities ensure that market updates, price movements, and external news are immediately reflected in the charts. This immediacy enables prompt reaction to market shifts, ensuring that the trader remains one step ahead in decision-making. Cloud-based data management further enhances this potency by offering accessibility from any device, whether you are at your desktop or on the move.
Automated Trade Execution and Alerts
The integration of automated trade execution with advanced charting is another game-changer. Many trading systems offer API connectivity that allows tools like Edgewonk to execute trades based on predefined conditions. For example, if your charts signal that a trend is reversing, this integrated system can automatically trigger an exit order or adjust your stop-loss levels. This automation enhances risk management significantly while also enabling systematic trading strategies that capitalize on real-time market movements.
Additionally, custom alerts built into the platform notify traders of significant shifts in trends or when specific technical thresholds are met. Such alerts serve as an early warning system, providing a buffer that enables quick assessment and action before potential market reversals or volatile spikes occur.
Enhancing Decision-Making with Combined Data Streams
The power of advanced charting lies in its ability to consolidate multiple data streams into a comprehensive analytical view. Data streams from pricing, execution times, volume, and external news are harmonized to present a complete picture of market dynamics. This holistic overview is particularly beneficial during major market events when multiple variables converge to influence trading outcomes.
Central to this integration is the concept of adaptive learning. As more trades are logged and analyzed, Edgewonk's system refines its predictive algorithms, constantly evolving its signal generation capabilities. This adaptive feature enhances the reliability of the alerts and signals over time. The convergence of historical performance data and real-time updates ultimately creates a feedback loop, promoting continuous learning and progressive improvement.
Investing in seamless integration is not only about technical prowess—it is about ensuring that every detail of your trading process is interconnected. This interconnectedness paves the way for a more resilient trading strategy, where data-driven decisions minimize emotional biases and errors. The combined ecosystem of data, analytics, and automated trade execution sets a new standard in risk management and strategic planning.

Real-World Examples and Case Studies
Examining real-world applications of Edgewonk’s advanced charting tools offers practical insights into how traders can leverage these features to boost performance. Several case studies demonstrate the tangible advantages of utilizing these tools in everyday trading scenarios.
Case Study: Adapting Strategy Amid Volatile Markets
Consider the case of a mid-level trader who recently transitioned to using advanced charting with edgewonk. Prior to using the toolset, the trader experienced sporadic successes marred by significant drawdowns during volatile periods. The trader recognized that the lack of a disciplined, data-driven approach had led to emotional decision-making—especially during unexpected market swings.
Upon integrating Edgewonk into the trading routine, the trader customized the dashboard to highlight real-time risk alerts, backtested various strategies using historical market data, and implemented automated signals that aligned with the overall trading plan. Over a period of six months, the systematic approach allowed the trader to adjust position sizes during periods of high volatility, reducing losses substantially and realizing consistent gains. The detailed performance metrics provided clarity on which strategies were working, transforming subjective decision-making into objective, data-backed insights.
Example: Optimizing Entry and Exit Points
Another example involves a trader specializing in algorithmic trading, where precision in entry and exit points is paramount. By leveraging Edgewonk’s chart annotation tools and technical overlays, the trader was able to identify previously overlooked micro-patterns in the price action. These insights enabled the trader to fine-tune algorithms that execute trades within fractions of a second. The result was a noticeable improvement in execution speed and a significant increase in profitability.
Trade reviews using the platform’s behavioral analytics also revealed consistent patterns where delays in trade execution were linked to manual hesitations. With these insights, the trader adjusted the automated signals, which led to a reduction in missed opportunities and enhanced overall return on investment.
Lessons from the Field
These case studies underscore several key lessons:
- Consistent application of advanced charting leads to improved risk management.
- Integration of behavioral analytics helps reveal hidden inefficiencies.
- Automated signals, when combined with manual oversight, enhance decision-making.
- Customization and personalization of charting tools are critical for aligning the system with individual trading styles.
Real-world examples like these provide compelling evidence that adopting advanced charting with edgewonk can transform trading performance by instilling discipline, reducing errors, and promoting a systematic approach. The case studies emphasize the importance of combining historical data with real-time analytics to adapt strategies in a fluid market environment.
Strategies for Sustained Improvement and Future Trends
To truly master advanced charting with edgewonk, traders must view the platform as a continuous journey rather than a one-time adoption of technology. Ongoing strategy refinement, performance tracking, and adaptation to emerging market trends are all part of the process of maintaining a competitive edge.
Continuous Learning and Systematic Reviews
One of the best practices for sustaining improvement is to commit to regular reviews of your charting setups. This involves evaluating both the technical performance and the behavioral aspects of your trading. Advanced charting with edgewonk offers a plethora of performance metrics that can be used to measure your daily, weekly, and monthly performance. Setting aside time for these reviews ensures that your trading strategy remains aligned with market conditions.
Implementing a continuous improvement cycle can be broken down into several actionable steps:
Schedule regular performance review sessions, transitioning from reactive trading to proactive strategy adjustments.
Compare historical performance data with current charts to identify evolving patterns.
Use built-in analytics to monitor changes in your risk profile and adjust trading parameters accordingly.
Maintain detailed trade journals that integrate seamlessly with chart annotations for subsequent analysis.
Leverage community insights and expert advice to innovate new charting strategies.
Regular reviews not only help in fine-tuning technical setups but also in recognizing behavioral trends that might require adjustment. For instance, overcoming emotional biases such as overconfidence or a tendency to chase losses is made more manageable when you have concrete performance data to back your assessments.
Embracing Technological Innovations
Charting technology continues to evolve rapidly. Machine learning (ML) and artificial intelligence (AI) are beginning to play an essential role in trading analytics. Future integrations of these technologies with platforms like Edgewonk could further enhance predictive capabilities, automate complex pattern recognition, and reduce the human error element in market analysis.
Emerging trends that traders should keep an eye on include:
- Enhanced predictive analytics through deep learning algorithms.
- More robust sentiment analysis integrated with social media and news feeds.
- Greater customization in automated trade adjustments during high-frequency trading periods.
- Integration with external data sources such as geopolitical events and macroeconomic indicators.
Edgewonk is continuously innovating to incorporate these trends, ensuring that it remains at the forefront of charting technology. As these advancements become mainstream, traders who adapt early will benefit from early insights and customized strategies that cater to rapidly changing market scenarios.
Expert Tips for Maximizing the Platform
To help you maximize the benefits of this advanced charting tool, consider these expert recommendations:
- Regularly backtest your new strategies before applying them to live trades.
- Use the customization options to create a clutter-free workspace that suits your analytical style.
- Integrate the platform's risk management tools into your standard trading routine, using automated alerts to refine your entry and exit placements.
- Engage with the Edgewonk community through forums and webinars to learn from peers and industry experts.
- Remain flexible in your approach. The most successful traders continuously adapt, testing new features and incorporating feedback from performance reviews.
These strategies not only improve your use of the tool but also cultivate a disciplined trading mindset. By embracing both technological enhancements and ongoing education, traders can maintain an edge over market volatility and rapidly evolving global trends.

Conclusion
Mastering advanced charting with edgewonk is an evolving journey that combines advanced technological tools with the discipline and insight of seasoned trading expertise. Through sophisticated charting features, customizable dashboards, behavioral analytics, and automated insights, Edgewonk offers an integrated platform that transforms raw trade data into actionable intelligence.
The journey not only involves understanding and utilizing these tools but also committing to continuous improvement and adaptation. By consistently reviewing performance, embracing technological innovations, and aligning trading strategies with market realities, traders can foster a resilient and dynamic approach to trading that optimizes returns and minimizes risks.
Ultimately, the sophistication of Edgewonk’s advanced charting tools mirrors the complexity of the trading environment today. With clear advantages in risk management, signal generation, and real-time integration, the platform empowers traders to not only survive but thrive in competitive markets. Adopting these advanced charting techniques is instrumental for those who aspire to transform their trading approach from reactive to strategic, ensuring sustainable success in an ever-changing market landscape.
By following the detailed insights provided in this article, traders can transform their technical analysis and decision-making processes. Embrace the full potential of Edgewonk’s tools to refine your strategies, manage risks more effectively, and ultimately achieve a higher level of trading performance in today's dynamic environment.
Unleash the Power of Automated Trading Analysis
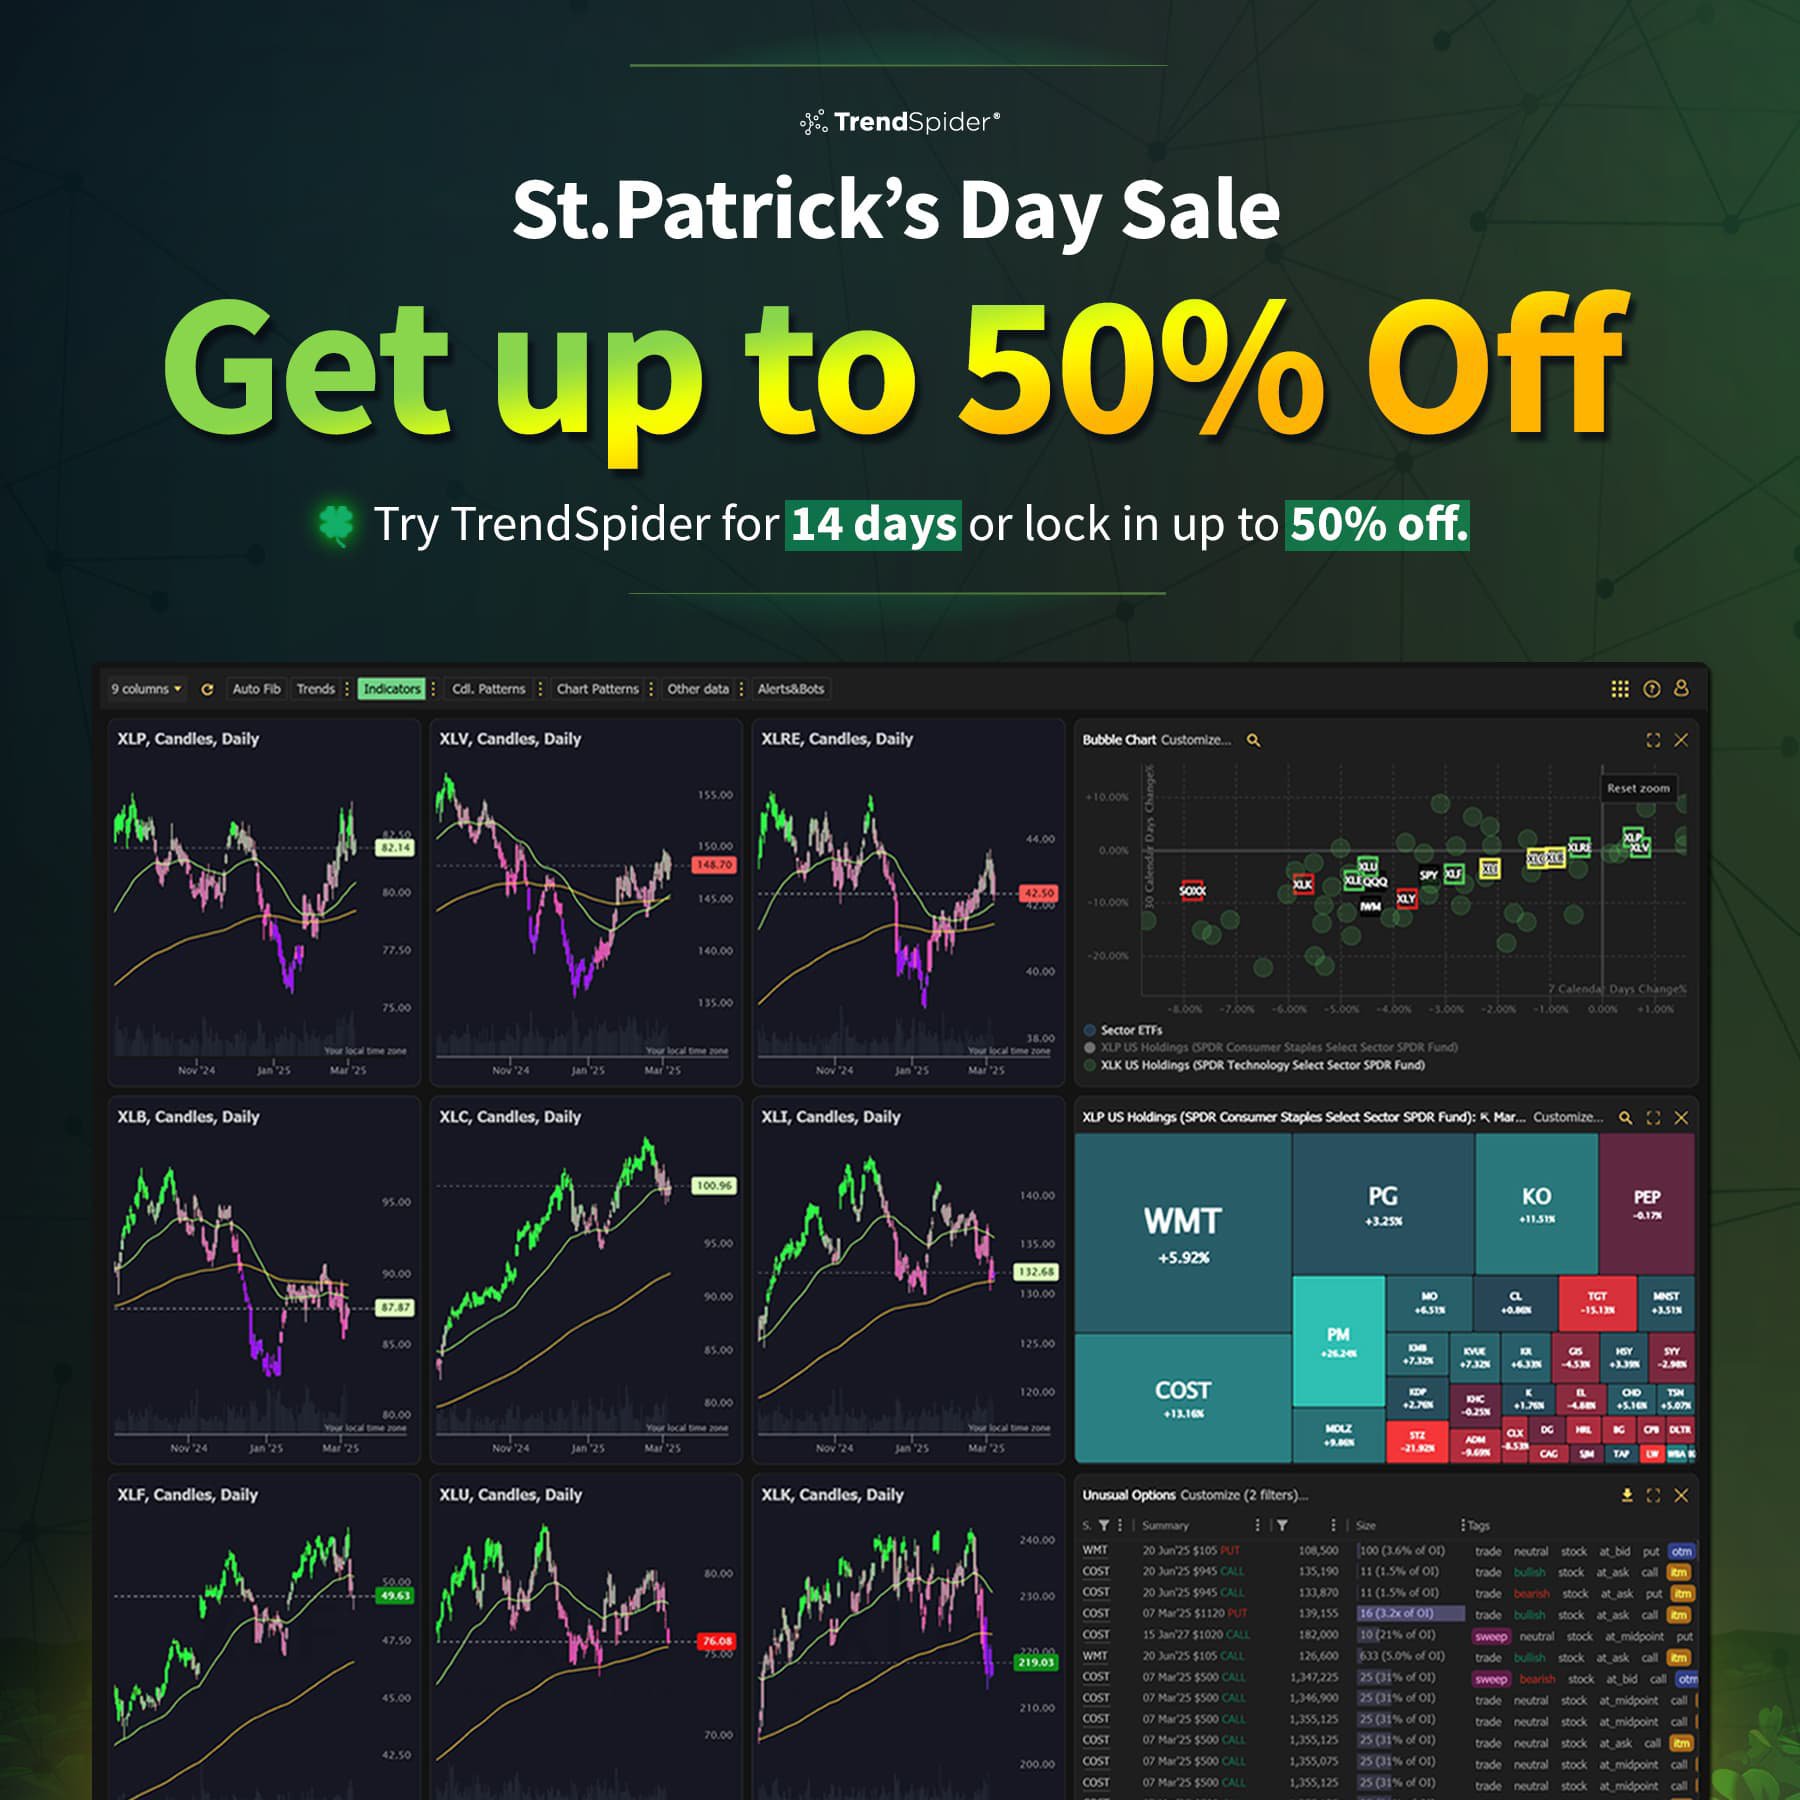
Are you struggling to keep up with the fast-paced trading world? TrendSpider empowers you with cutting-edge tools for optimal strategy execution.
Our automated technical analysis suite eliminates guesswork, backtests strategies, and delivers real-time alerts, saving you valuable time and effort.
Quentin Merriweather
52 posts written


