

Trade Vocab
Dovish Meaning in Trading
Explore the dovish meaning in trading—understand its origins, market implications, and why recognizi...

Trading can sometimes feel like trying to catch lightning in a bottle thanks to its unique jargon and fast markets. One term that tends to throw traders for a loop is the 'whipsaw meaning' - referring to sharp price reversals that can lead to costly blunders. Understanding what whipsaw means is vital since these sudden shifts can catch traders off guard. In this article we’ll break down the concept, explore what triggers it and show you how to spot it on charts.
A whipsaw happens when the price swings sharply one way and then suddenly reverses course. This kind of back-and-forth dance can really catch traders off guard, often prompting them to jump into or out of positions a bit too hastily sometimes leading to losses or missed opportunities.
The term "whipsaw" actually comes from the lumber industry where two people wield a saw that moves back and forth in a rapid dance to slice through wood.
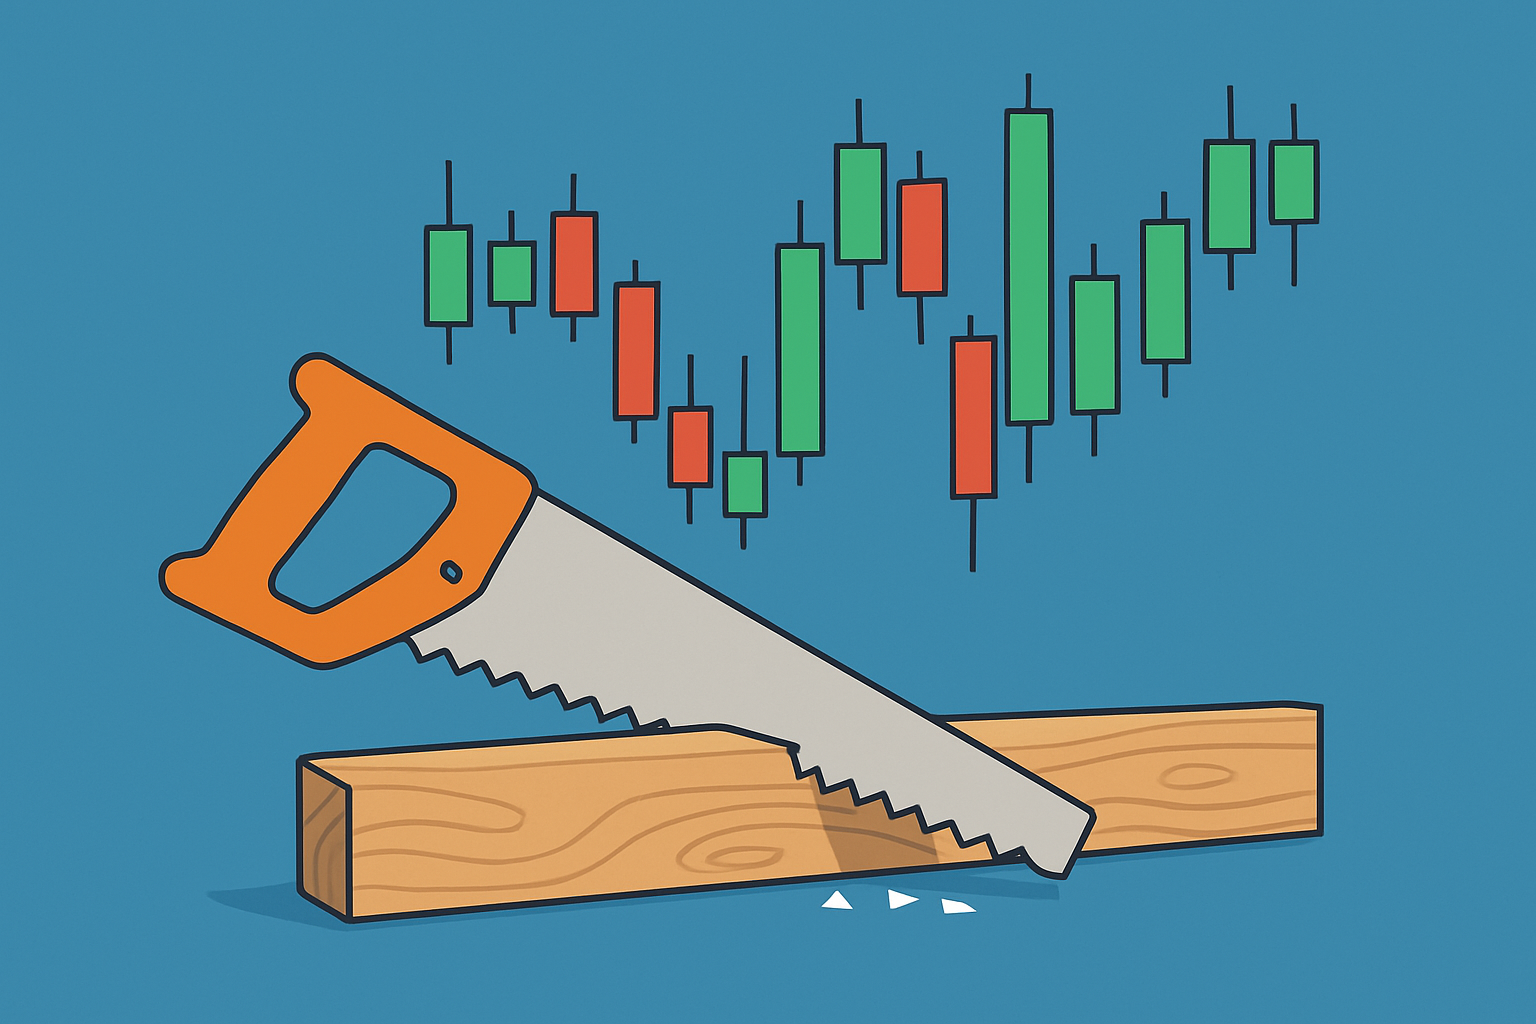
Visual metaphor linking the whipsaw saw motion with volatile market price action displaying sharp reversals.
Whipsaw effects tend to pop up when a few market factors team up the wrong way. Sudden spikes in volatility or unexpected news from left field usually send prices swinging fast enough to fool even seasoned traders into believing a breakout or trend reversal is real—when in fact it’s just smoke and mirrors.
These factors often team up, pushing the market to swing rapidly one way then the other.
Watching out for whipsaw patterns on price charts is absolutely vital if you want to dodge those pesky costly mistakes. Traders often spot those sudden spikes that seem to shoot up only to fall back just as fast, along with the all-too-familiar mixed signals from common technical indicators. Picking up on these little hints can really save you from jumping into or out of trades at the worst possible moments.
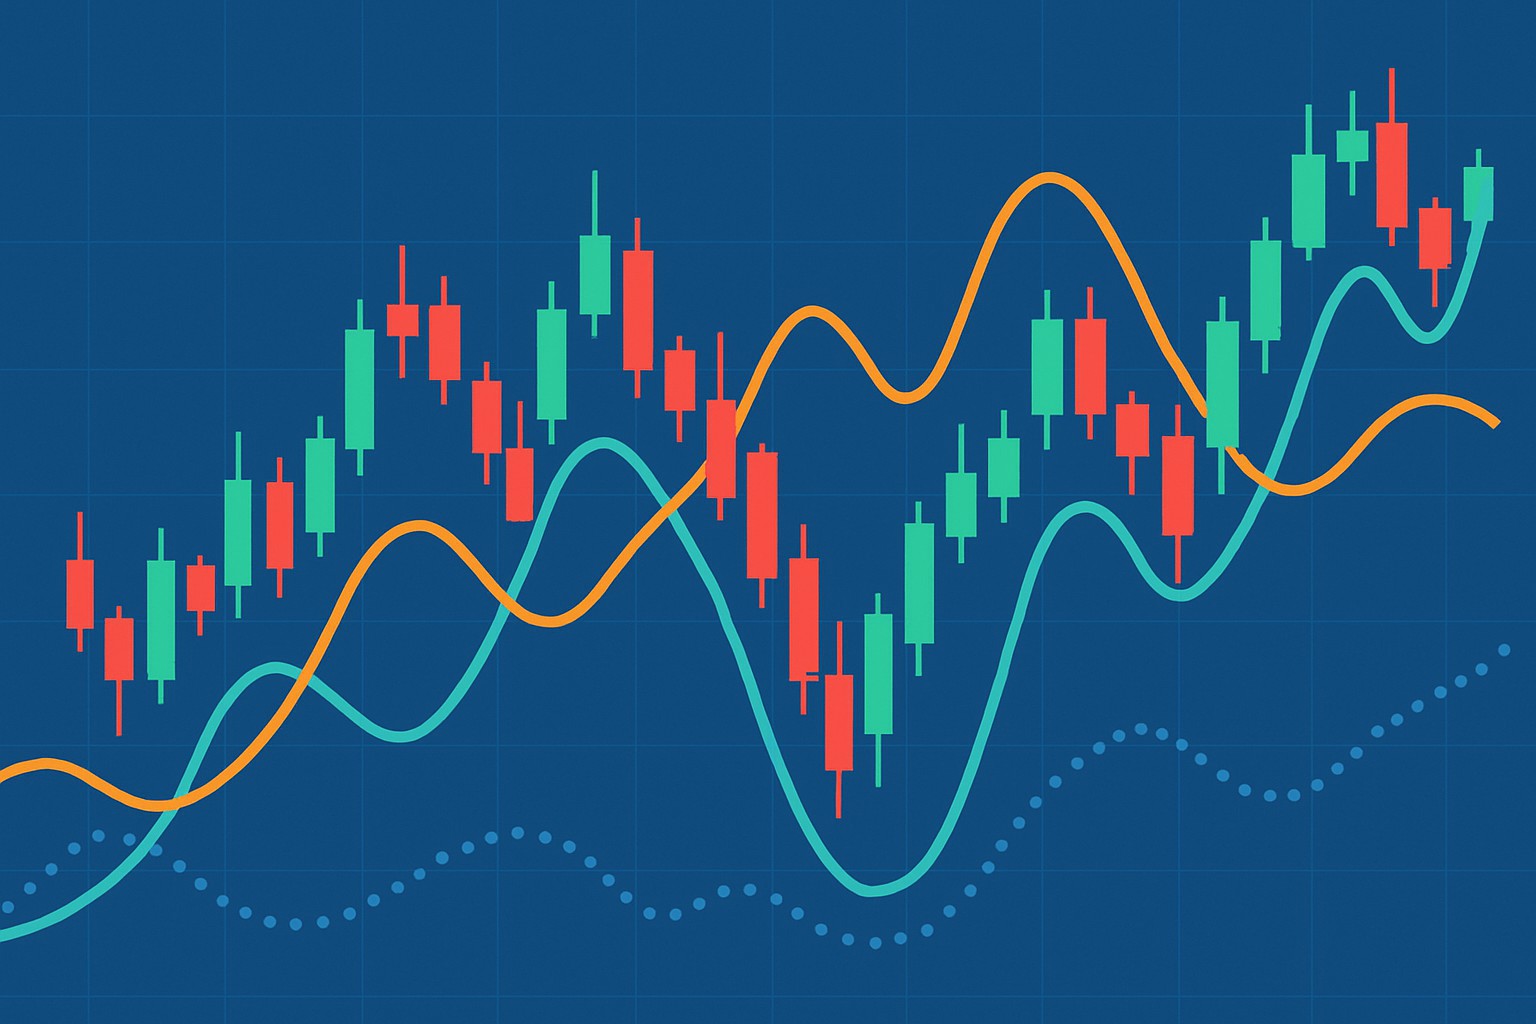
During whipsaw episodes, common indicators like the Relative Strength Index (RSI) or the Moving Average Convergence Divergence (MACD) often throw curveballs that lead traders astray. Take the RSI for example. It can bounce quickly between overbought and oversold zones and tempt people into jumping the gun on buy or sell moves. As for the MACD, its crossovers might pop up without any clear trend taking shape and add fuel to the whipsaw fire.
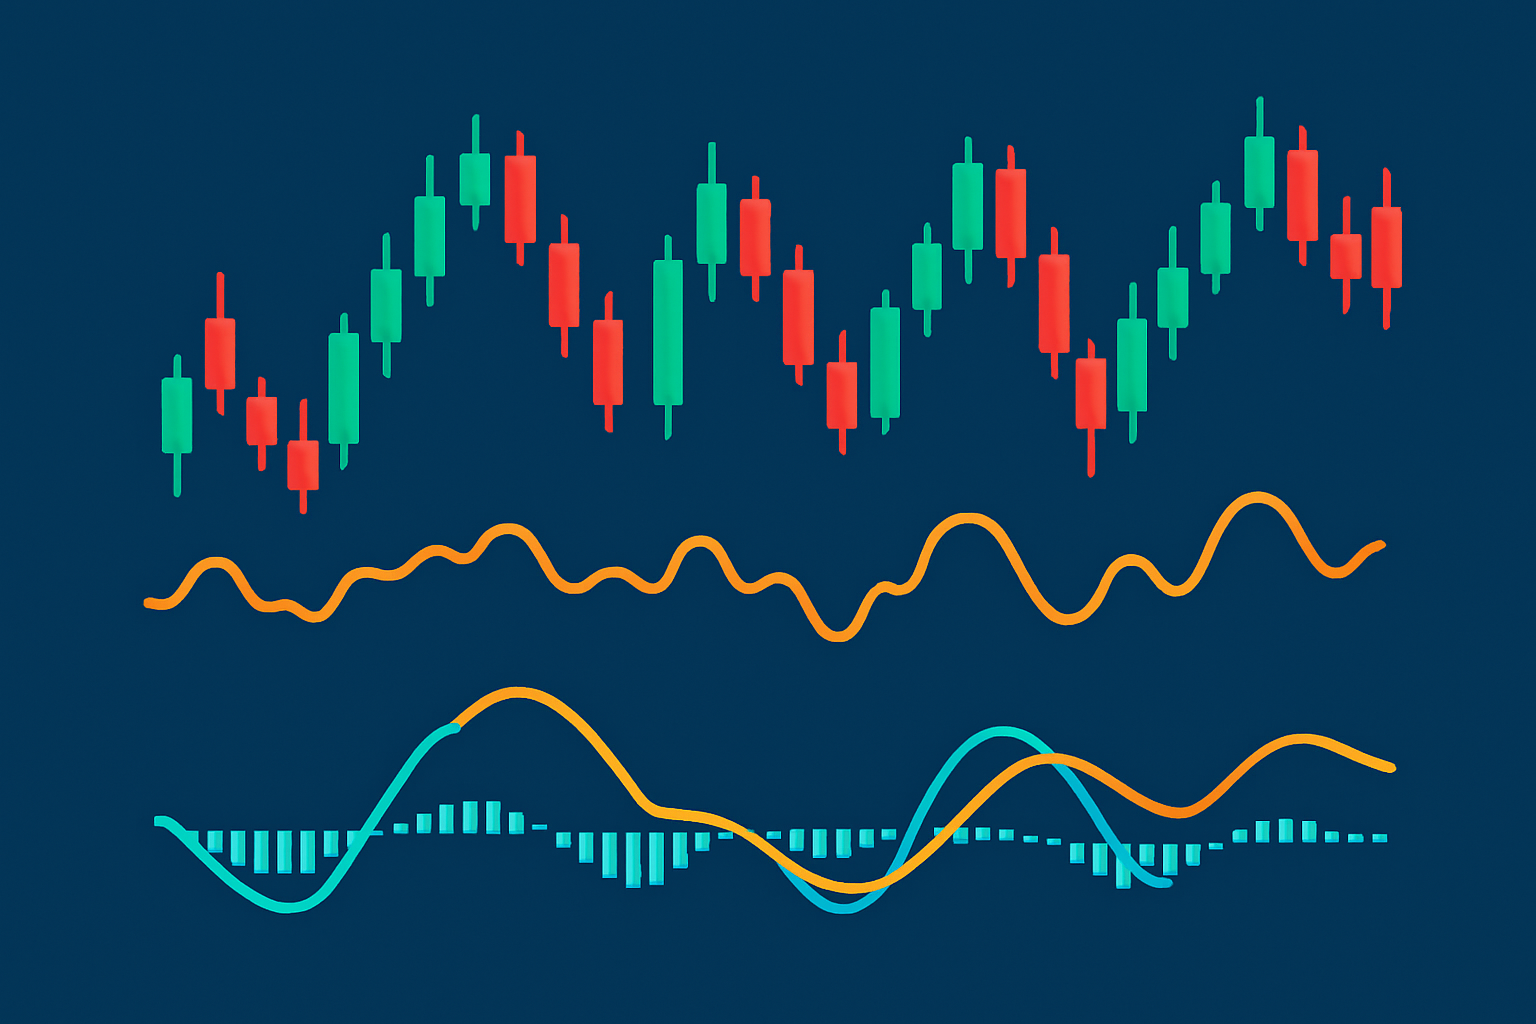
Example chart visualizing whipsaw price action with erratic RSI and MACD indicator signals.
Trading in whipsaw conditions often means dancing on a razor's edge with the risk of getting stopped out too early or suffering bigger losses from quick reversals. It also means weathering the emotional rollercoaster of sudden market swings.
"> Patience and discipline often turn out to be your best friends when navigating the rollercoaster that is volatile markets. From what I’ve seen, it’s usually wiser to sit tight and wait for those clear, confirmed signals rather than chasing every quick move—after all, chasing can leave you tangled in costly whipsaw traps before you know it." – Anonymous Trading Expert
Whipsaw events can be notoriously tricky to anticipate, but traders have a few tricks up their sleeves to soften the blow.
Waiting patiently for clearer signals before diving into trades often helps traders dodge those pesky, costly whipsaws.
[interactive/utility-block attributes={"description":"A simple downloadable checklist or flowchart to help traders decide when to avoid trading conditions likely to produce whipsaws"} end]
Whipsaw events pop up all over the place—stocks, forex and even those notoriously jumpy cryptocurrencies. When you dive into real-world examples you start to see that whipsaws don’t all look alike. They change shape depending on the market’s structure and liquidity.
| Market Type | Date/Event | Whipsaw Description | Outcome | Lessons Learned |
|---|---|---|---|---|
| Stock Market | Flash Crash (May 2010) | An abrupt, gut-wrenching drop followed by a lightning-fast recovery across a bunch of stocks within minutes | Extreme volatility and heavy losses | A real eye-opener on why risk management and circuit breakers are absolute lifesavers |
| Forex Market | Brexit Vote (June 2016) | The British pound made a dramatic leap then did a quick about-face just minutes after the announcement | Left many traders scratching their heads and caught off guard | Clear warning of just how wild political event volatility can be |
| Cryptocurrency | Bitcoin 2017 Rally | Bitcoin’s price shot up and then tumbled multiple times over just a few days | Intense swings leading to rollercoaster gains and losses | If you’ve watched crypto, you know whipsaws here are often driven by sheer speculation |
| Stock Market | Tesla Earnings (Oct 2020) | The stock leapt on earnings news but pulled back and forth several times throughout the day | Traders frequently found themselves stuck in false breakouts | Reinforces the importance of confirming trend strength before jumping into trades |
| Forex Market | USD/JPY liquidity lows (various) | The price swings blew up during the sleepy Asian session when liquidity was wafer-thin | A prime example of increased whipsaw risk overnight | My advice? Steer clear of trading during those low liquidity windows |
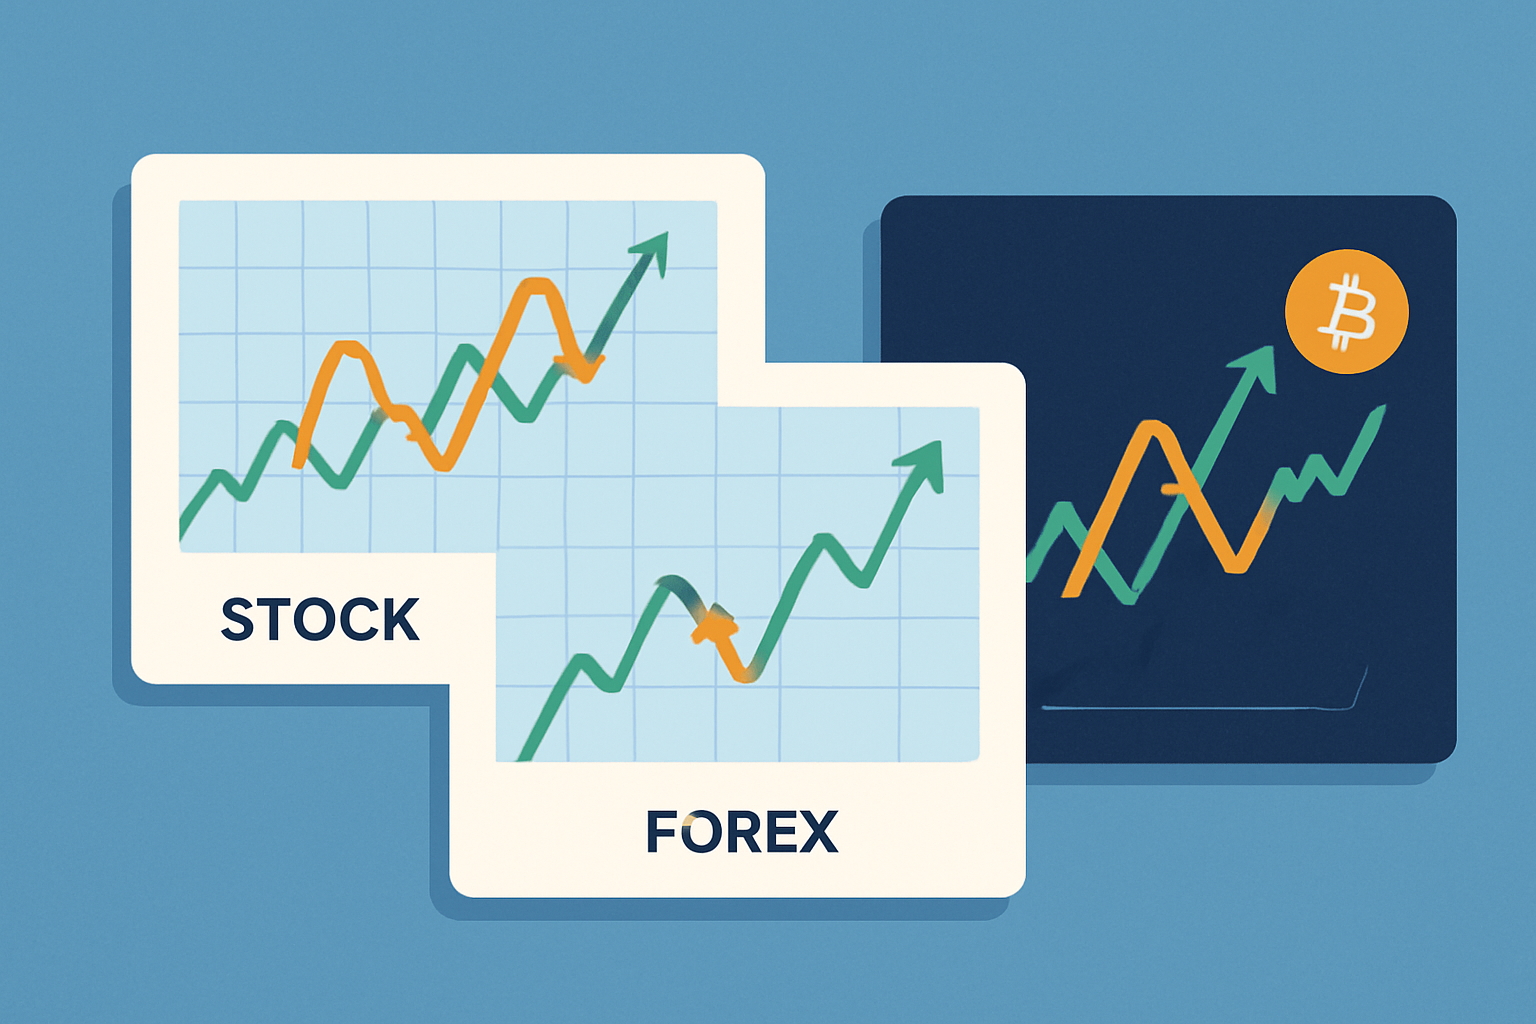
Representative price charts from stocks, forex, and crypto markets displaying typical whipsaw patterns.
These examples remind us that the whipsaw meaning becomes clear when we see how they pop up in just about every market, triggered by things like sudden news flashes or stretches of low liquidity. They can also occur when speculation runs wild.
Are you looking to navigate the dynamic world of cryptocurrency trading with confidence? Coinbase is the platform you need. As a leading exchange, it offers a user-friendly interface, robust security, and a wide range of digital currencies. Unlock the potential of the crypto market with Coinbase.

23 posts written
Explore the dovish meaning in trading—understand its origins, market implications, and why recognizi...
Discover how Fitch Ratings assess credit risk and influence trading decisions in stocks and bonds. L...
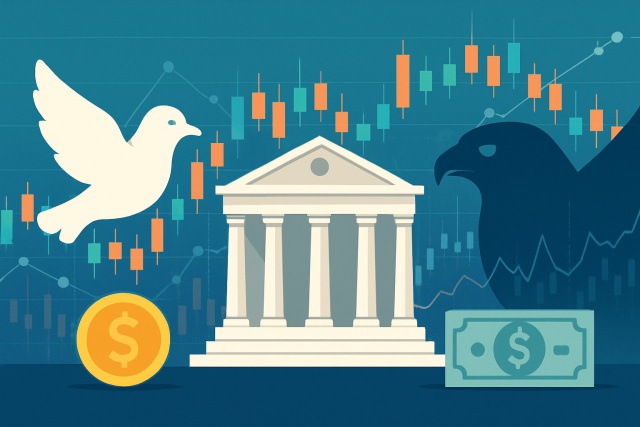
Discover how central banks' hawkish and dovish stances shape financial markets and affect your inves...
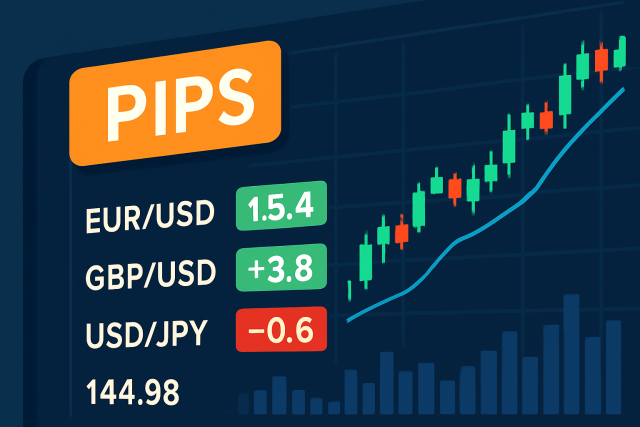
Ever wondered what a pip means in trading? This article explains pips clearly, showing how they meas...