


Technical Analysis
Understanding the Bullish Harami Candlestick Pattern
Discover the bullish harami candlestick pattern—a key technical signal that can hint at trend revers...

Understanding different candlestick types provides a straightforward and visually intuitive way to track price movements, making them a staple in the world of technical analysis. For anyone just dipping their toes into trading, getting a handle on the various types of candlesticks can be a real game-changer—it often helps you catch trends and reversals faster.
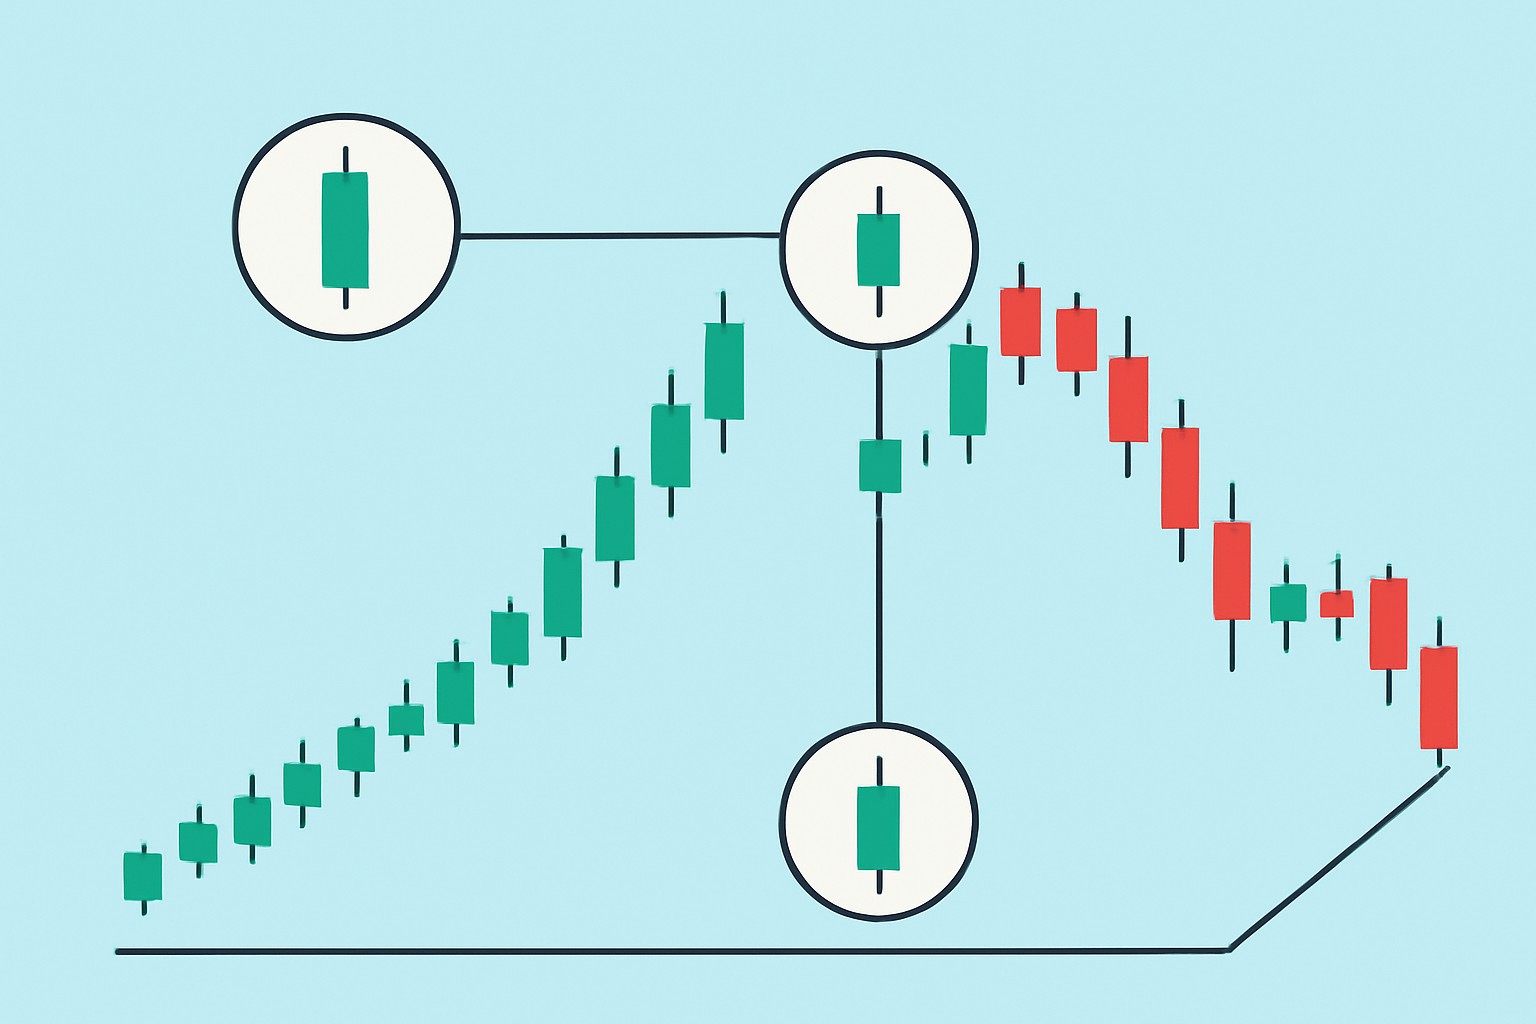
Candlestick charts show price movements over a fixed period and highlight the open, close, high and low prices in one package.
Each candlestick has a body and wicks that paint a picture of the price range over a given timeframe. Bullish candles usually have a white or green body signaling rising prices like a little green flag for buyers. On the flip side, bearish candles show falling prices and often appear in red or black. They give a subtle nudge that sellers might be calling the shots.
Certain candlestick types have earned quite the reputation for signaling the strength and persistence of a trend. Getting to know these patterns can really help beginners not only anticipate market moves more accurately but also feel a bit more at ease holding their positions as the trend plays out.
| Candlestick Type | Visual Characteristics | What It Indicates | Example Scenario |
|---|---|---|---|
| Marubozu | Large body with no wicks | Signifies strong buying (white) or selling (black) pressure, no mixed signals here | A Bullish Marubozu popping up during an uptrend really confirms that the bulls are in charge |
| Continuous White/Black | Multiple candles in a row with minimal wicks | Suggests the current trend is on cruise control and likely to keep going | A string of white candles lining up tells you the uptrend is not ready to quit yet |
| Three White Soldiers | Three long bullish candles in a row | Indicates a solid bullish reversal or a continuation that’s hard to ignore | Often spotted after a downtrend, this pattern waves a flag saying the bulls are back in town |
| Three Black Crows | Three long bearish candles in a row | Warns of a strong bearish reversal or continuation, the bears have something to say | Pops up after an uptrend, hinting at a possible change in tide |
| Rising/Falling Three Methods | One long candle, followed by a few smaller opposite candles, then another long candle that keeps the trend rolling | Shows a brief breather before the trend picks up steam again | Rising Three Methods during an uptrend signal a short pause before the next leg up |
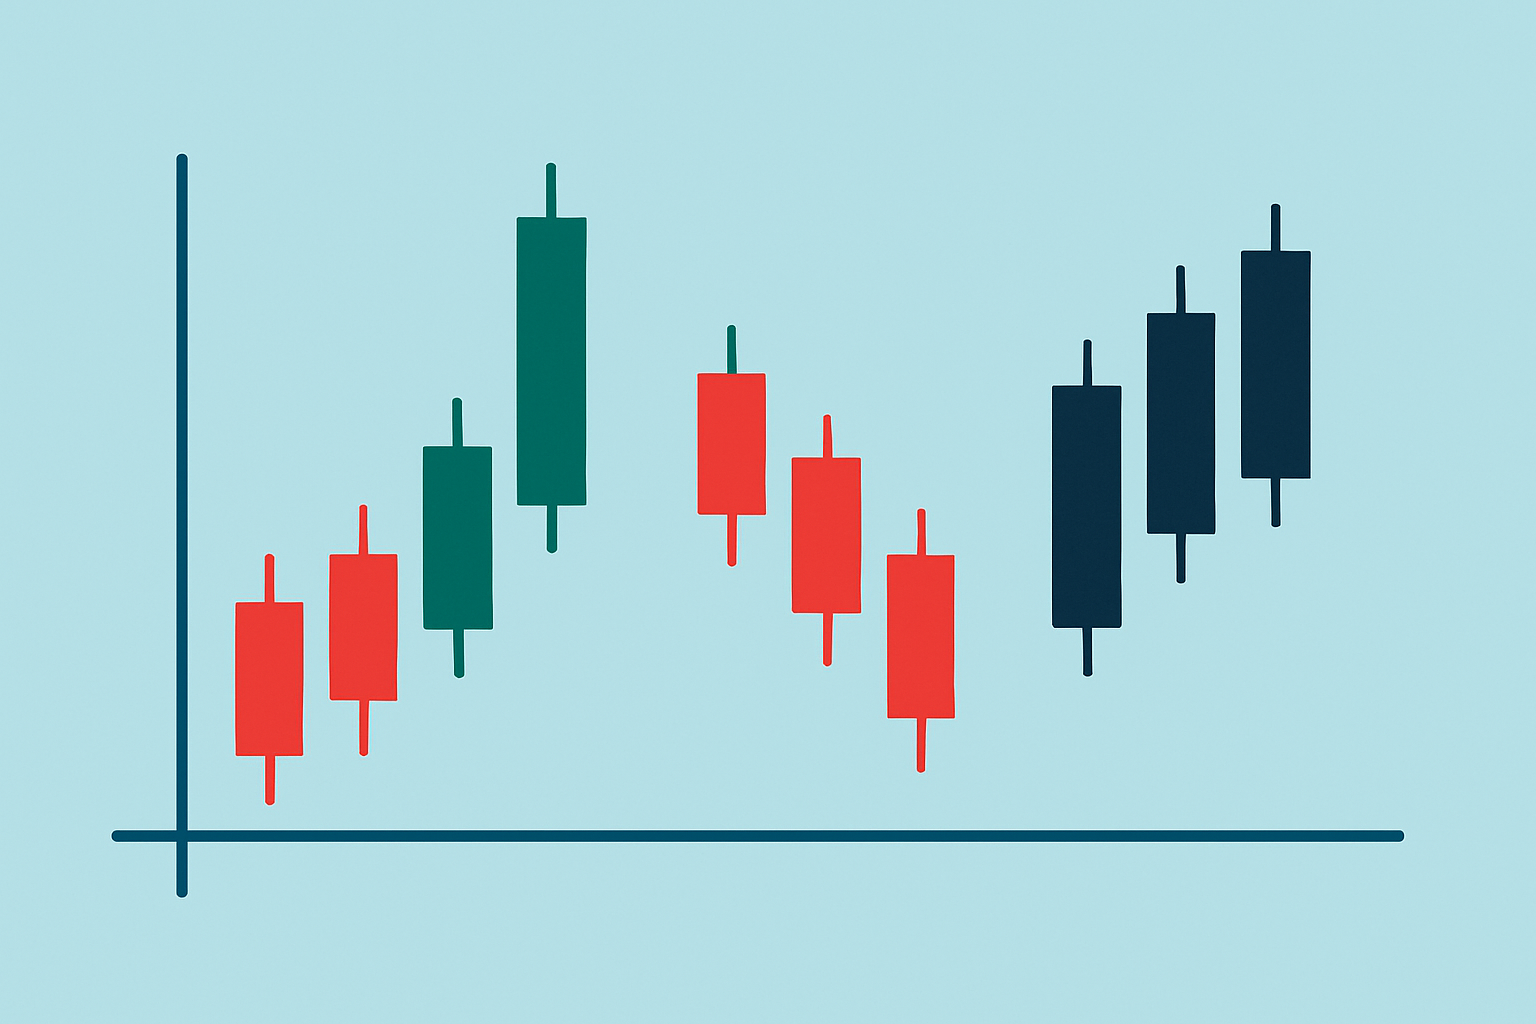
Visual examples of common trend-identifying candlestick types including Marubozu, Three White Soldiers, and Three Black Crows.
Reversal patterns are often the market’s subtle way of waving a red flag about a change in direction. Beginners who get the hang of spotting these candlestick shapes early on usually end up timing their entries and exits more like seasoned pros.
| Pattern Name | Description | What It Signals | Tips on Confirmation |
|---|---|---|---|
| Hammer | Small real body with a long lower shadow after a downtrend | Often hints at a bullish reversal | It’s wise to wait for the next bullish candle, ideally backed by a surge in volume, before getting too excited |
| Shooting Star | Small real body with a long upper shadow after an uptrend | Could be waving a red flag for a bearish reversal | Usually, a following bearish candle paired with increased volume does the trick for confirmation |
| Doji | Opening and closing prices nearly the same | Flags market indecision and the possibility of a reversal | Needs a bit more proof—later candles and other indicators typically seal the deal |
| Bullish Engulfing | A small bearish candle followed by a larger bullish candle that fully covers it | Signals a bullish reversal | A jump in volume gives it extra oomph; also, scope out the overall trend to get the full picture |
| Bearish Engulfing | Small bullish candle followed by a larger bearish candle that fully covers it | Points toward a bearish reversal | Look for weakening price momentum alongside higher volume to confidently call it |
| Morning Star | Three candles: large bearish, small-bodied, then large bullish | Suggests a strong bullish reversal | Best when the price breaks above the high of that third candle—then you know it’s for real |
| Evening Star | Three candles: large bullish, small-bodied, then large bearish | Indicates a robust bearish reversal | Keep an eye out for higher volume on the third candle and a slip below key support levels to confirm the signal |
Volume often plays a pretty important role in backing up those reversal signals. When you see a candlestick pattern showing up alongside trading volume that is higher than usual, it tends to carry a bit more weight—kind of like having a friend vouch for you.
Spot the main market trend using longer timeframe charts like daily or weekly to get a clear sense of where things are heading overall.
Look out for trend continuation candlestick patterns such as Marubozu or Three White Soldiers. These patterns can help confirm the current trend’s strength and hint that it might stick around longer.
Keep an eye peeled for reversal candlestick signals like Hammers or Engulfing patterns, especially near key support or resistance levels. They often suggest the tide might be turning.
Double-check your findings by glancing at volume and other technical indicators like MACD or RSI to boost your signal's reliability.
Bring these clues together and decide on your entry or exit points. Manage risk carefully and wait for solid confirmation before making your move. Patience can really pay off here.
Using these steps on popular trading platforms like TradingView or TrendSpider usually feels pretty straightforward. Both platforms give you a decent playground with a variety of chart types and technical indicators plus some automated pattern recognition that can be a real lifesaver for beginners. TradingView offers a rich set of charting tools that make it a breeze to zoom through different timeframes and highlight key patterns without breaking a sweat. TrendSpider cranks things up a notch with its AI-powered pattern detection that helps you catch potential trend and reversal candlestick patterns on the fly.
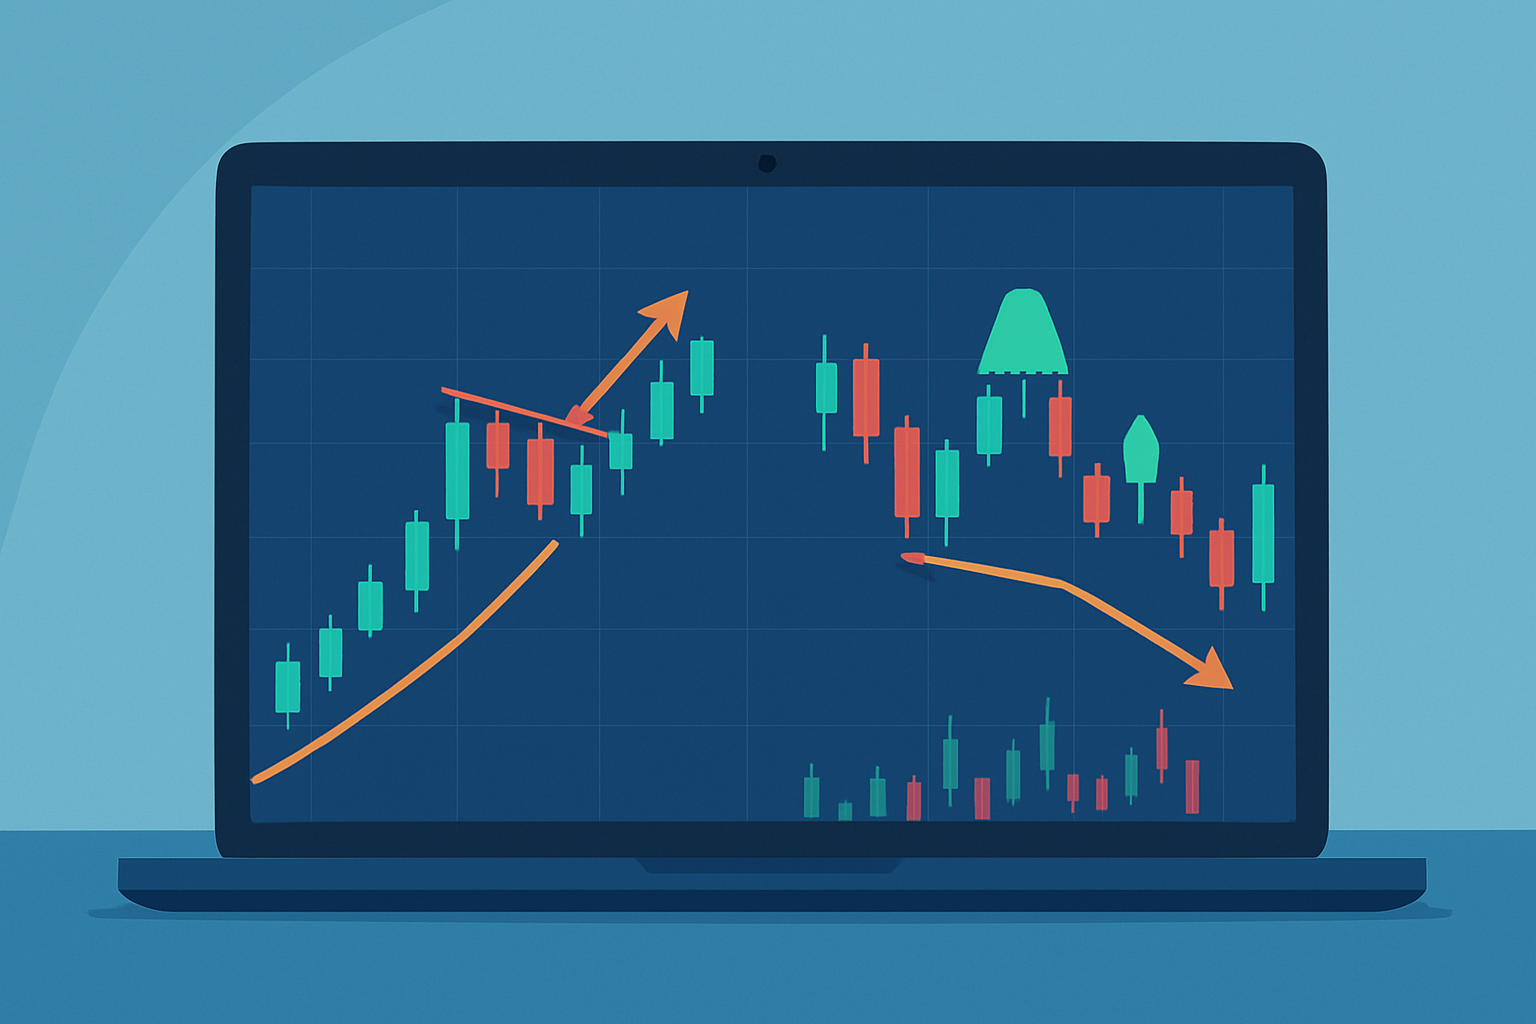
Example of a trading platform chart showing candlestick trend and reversal patterns with annotations for easy identification.
Many beginners often trip up on candlestick analysis by missing the forest for the trees—they focus too much on a single candlestick signal without considering the broader trend or forget to factor in volume data altogether. These slip-ups tend to lead to false entries or premature exits.
Patience and steady practice truly are the secret sauce to sidestepping these common pitfalls. Getting the hang of reading candlestick charts doesn’t happen overnight but taking it one step at a time—bit by bit and trade by trade—can really boost your confidence without dumping a mountain of stress on you.
Really get the hang of reading different candlestick types by trying your hand at paper trading—it's a great way to practice without putting any skin in the game. You might also stumble upon some handy candlestick pattern scanning tools on platforms like TradingView and TrendSpider, which can save you quite a bit of legwork.

Are you tired of juggling multiple tools for your trading needs? TradingView is the all-in-one platform that streamlines your analysis and decision-making.
With its powerful charting capabilities, real-time data, and vibrant community, TradingView empowers traders like you to stay ahead of the market. Join thousands who trust TradingView for their trading success.

23 posts written
Discover the bullish harami candlestick pattern—a key technical signal that can hint at trend revers...

Learn how the harami candlestick pattern signals potential market reversals. This guide breaks down...

Unlock the power of the bear flag pattern with our practical, step-by-step guide. Understand market...

Unlock the power of the head and shoulders pattern with this complete guide. Learn to spot, trade, a...