


Technical Analysis
Understanding the Bullish Harami Candlestick Pattern
Discover the bullish harami candlestick pattern—a key technical signal that can hint at trend revers...

Bullish candlestick patterns are those trusty visual cues in technical analysis that often hint at possible upward price moves across various financial markets. These patterns capture market sentiment through price action over a set timeframe, making it easier for traders to spot potential trend reversals or smooth continuations.
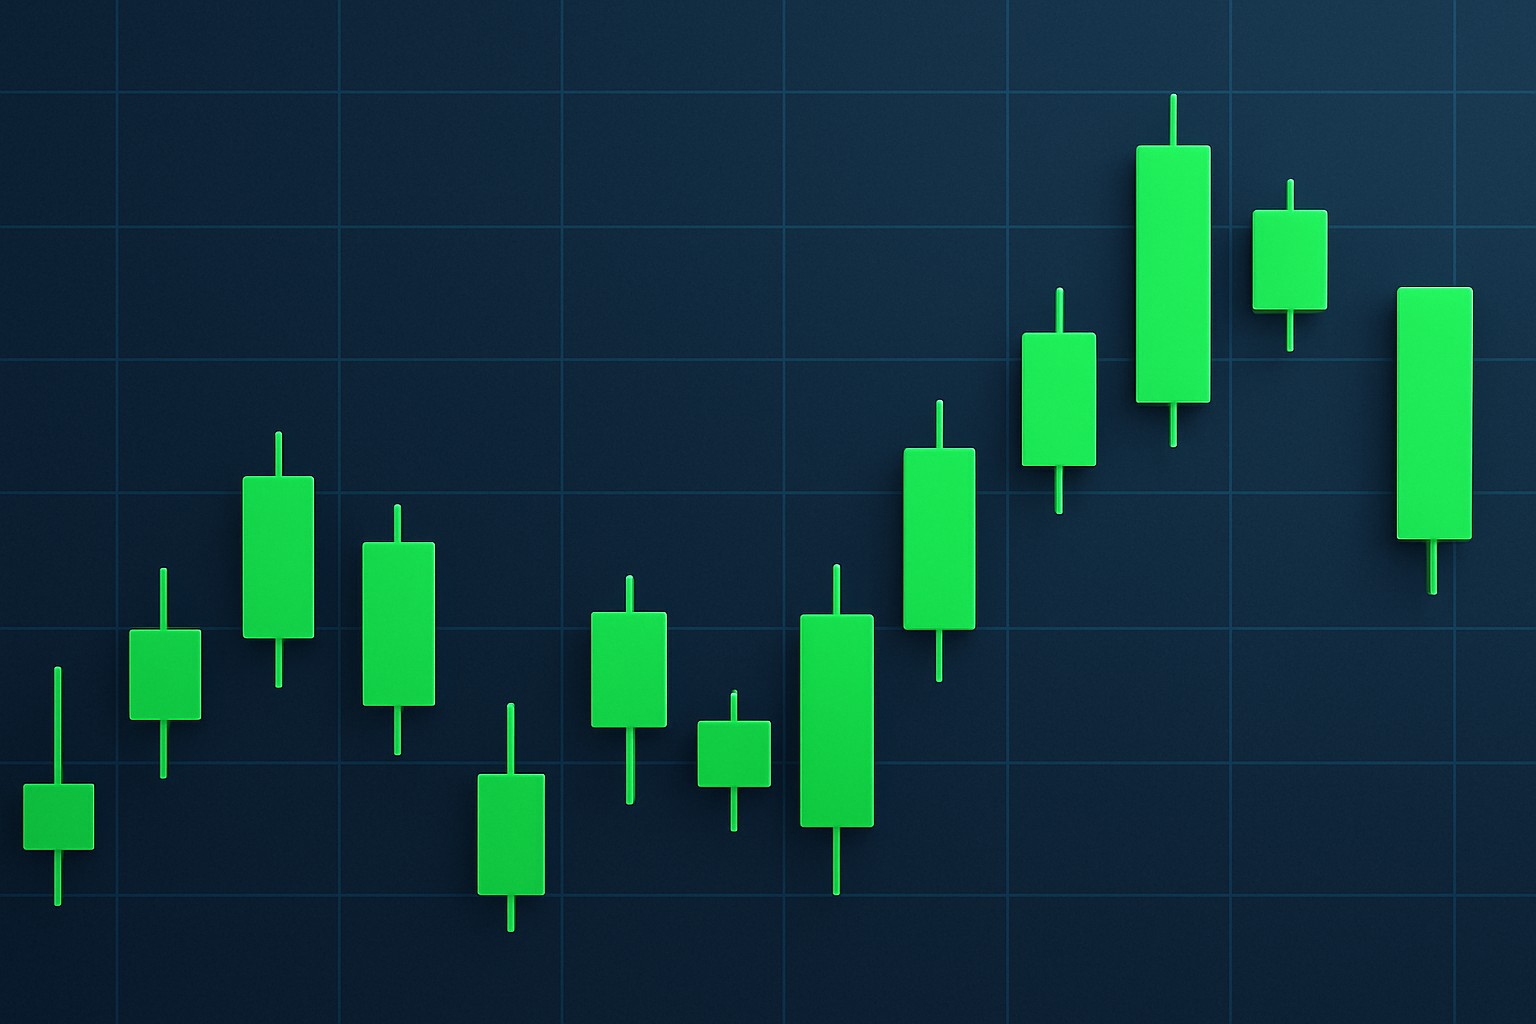
A candlestick chart is made up of individual candles that capture price movement over a set period. Each candle shows the opening, closing, high and low prices like little snapshots of the market’s mood. When the closing price is higher than the opening, you’ll usually spot a bullish candle often dressed in a lighter or green hue to signal buying pressure. Conversely, bearish candles close lower than they opened and typically show up in red.
Keep an eye on the candle's color and size—those long green (bullish) candles often hint at strong buying interest and feel like a crowd suddenly rallying behind a hot trend.
Think about where the candle sits within the bigger market trend because this can clue you in on whether it’s gearing up for a reversal or just continuing the current vibe.
Peek at volume and momentum indicators as they are the trusty sidekicks that back up whether that bullish move has real muscle behind it.
Pay attention to patterns formed over several candles since many bullish signals only really shine through when they come in certain sequences. It’s a bit like waiting for the full story to unfold before jumping to conclusions.
It’s always a smart move to double-check bullish signals by keeping an eye on volume and a few other technical indicators, just to dodge those pesky false alarms. When you see bullish candles flashing on higher volume, it usually beefs up the pattern’s credibility and tips the scales toward a more lasting price bump.
Each bullish pattern has its own distinct vibe and story to tell. Take the Hammer for example. It usually signals that buyers are stepping in just after sellers have hammered prices down. Then there’s the Bullish Engulfing pattern—a clear sign that buyers have rolled up their sleeves and are taking the reins from the sellers.
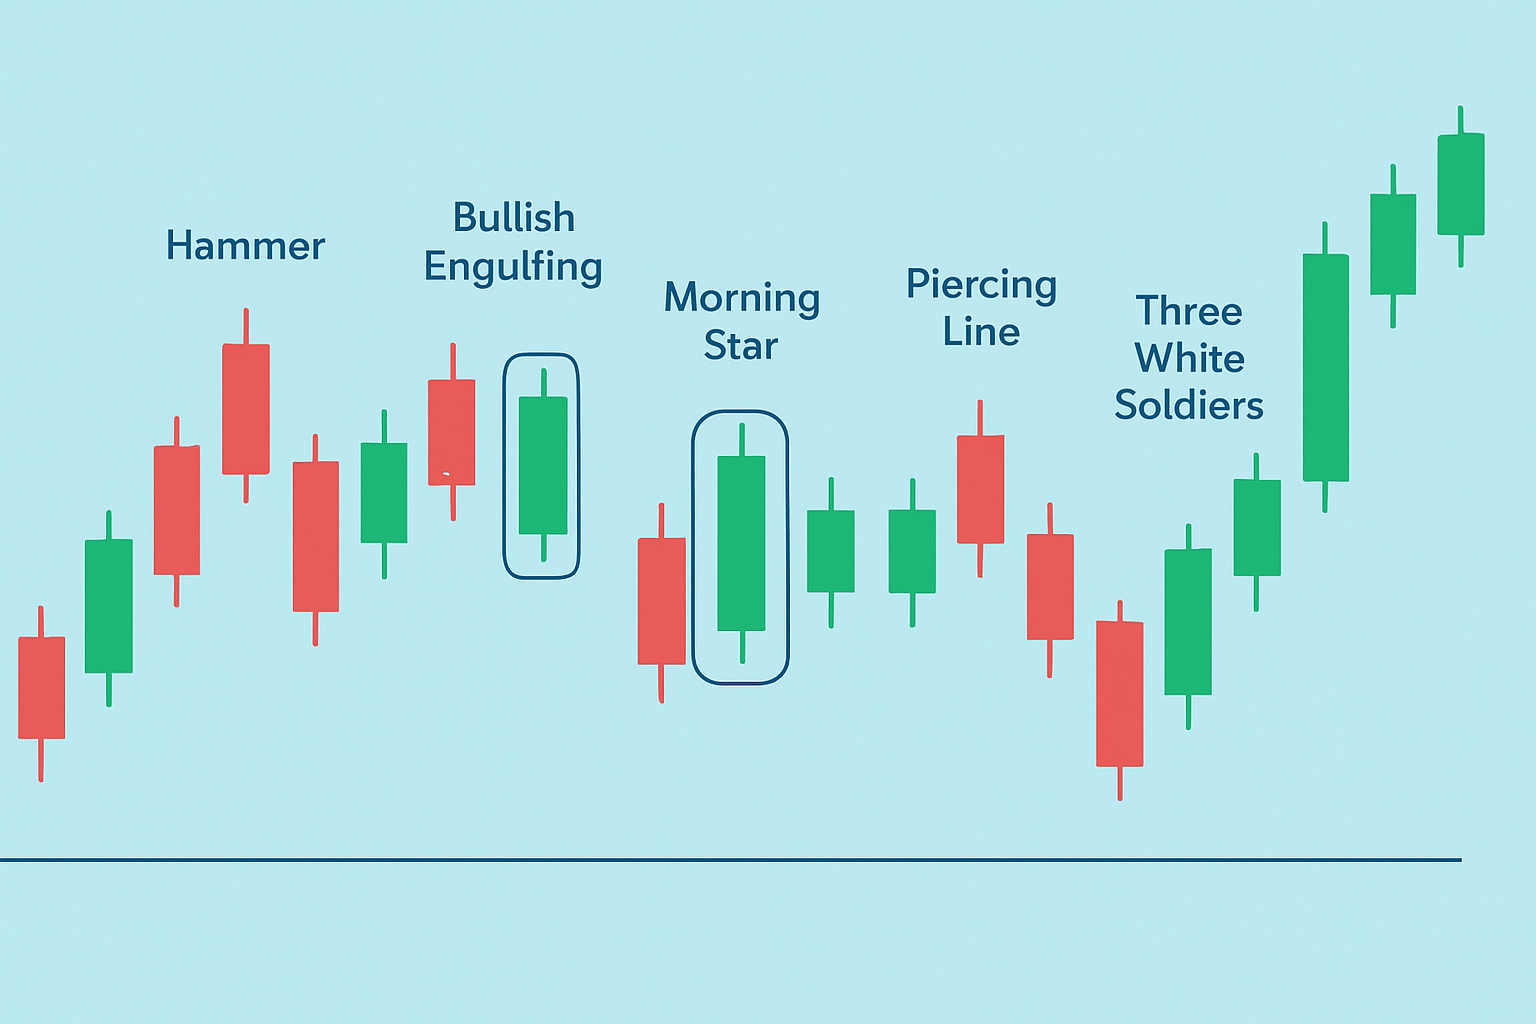
Visual examples of common bullish candlestick patterns on a candlestick chart
Spotting a Bullish Engulfing pattern usually starts by noticing a downtrend already in motion. Then, you catch a small bearish candle getting swiftly swallowed up by a much larger bullish candle. It’s like the buyers suddenly decide to crash the sellers’ party, showing a strong surge of buying momentum that often signals a potential shift toward an upward trend.
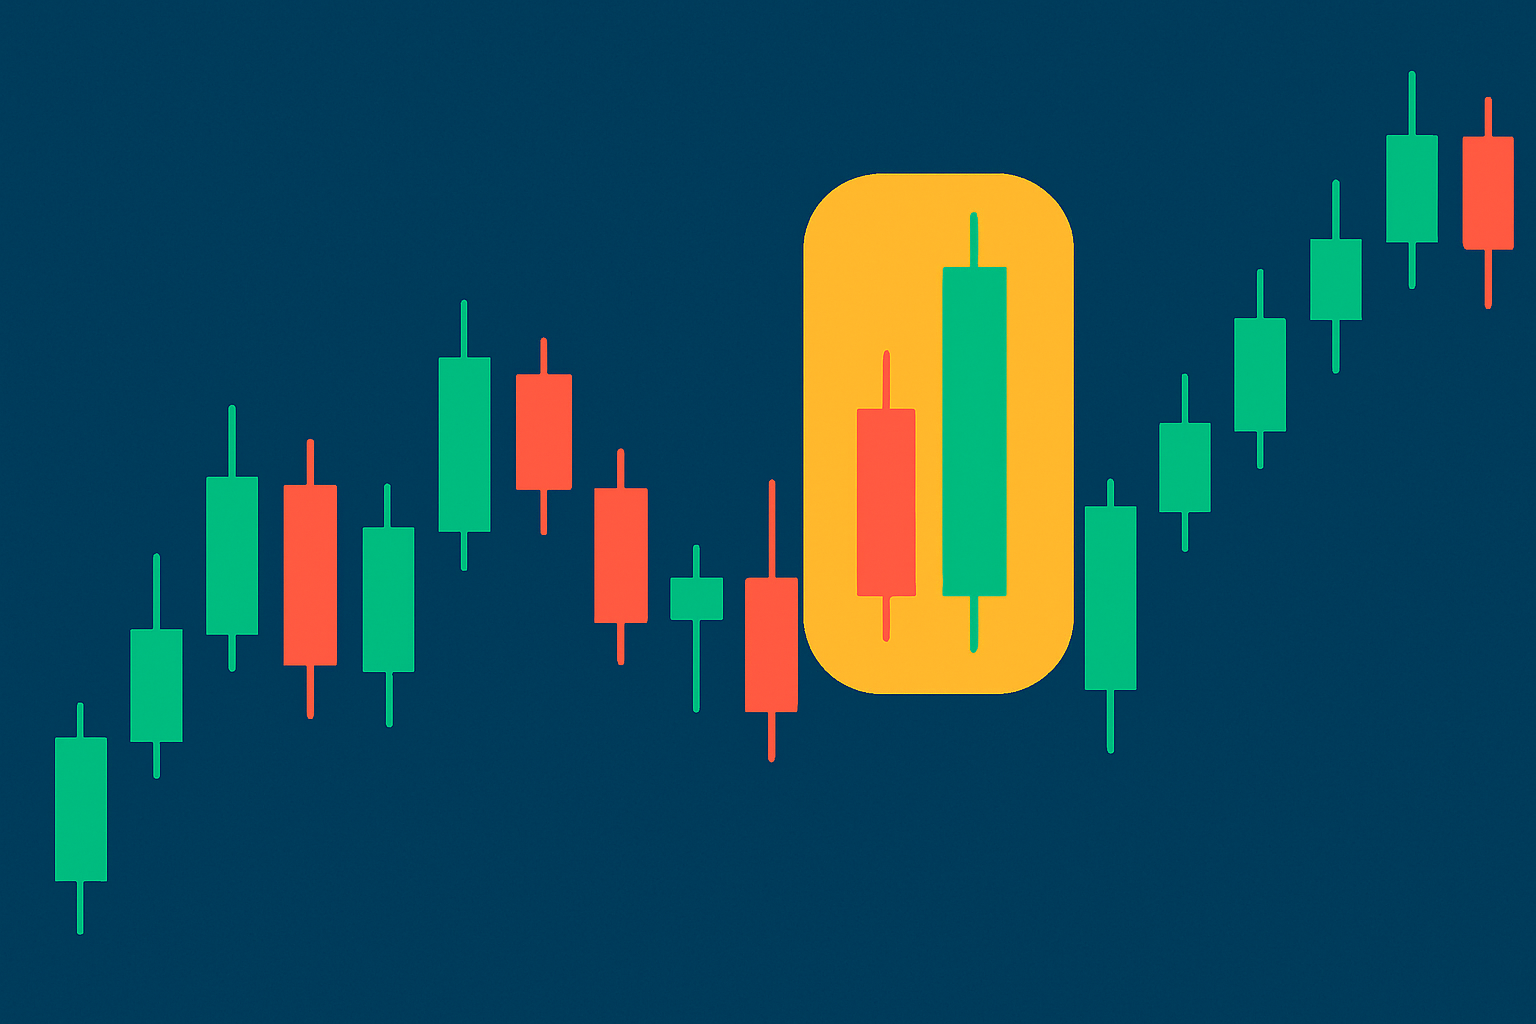
Close-up view illustrating the formation and identification of a bullish engulfing candlestick pattern
Bullish candlestick patterns tend to send similar buying signals across markets such as stocks, forex, cryptocurrencies and commodities. Each market has its own quirks: volatility, liquidity and volume affect how these patterns appear and behave. Traders often tweak their interpretation and timing to fit the unique rhythm of the market they are dealing with.
One common pitfall I’ve seen is jumping the gun and treating a single bullish candlestick pattern as a guaranteed sign of reversal without waiting for more confirmation. The market loves to throw curveballs, especially during choppy sideways phases or around big fundamental events that create misleading patterns. Check the volume strength and see if the move lines up with the bigger trend or nearby support levels. Tread carefully when volatility spikes due to breaking news.

Struggling to improve your trading performance? Edgewonk's advanced analytics tools are designed to give you the edge you need.
With detailed trade journaling, robust strategy analysis, and psychological insights, you'll gain a comprehensive understanding of your strengths and weaknesses. Don't miss out on this game-changing opportunity.

20 posts written
Discover the bullish harami candlestick pattern—a key technical signal that can hint at trend revers...

Discover the doji candlestick—a powerful price action signal revealing market indecision. This begin...

Discover what IOUs mean in finance, their role as informal debt acknowledgments, and how understandi...

Master the hammer candlestick pattern—a key indicator for market reversals. This beginner-friendly g...