


Technical Analysis
IOU Meaning in Finance
Discover what IOUs mean in finance, their role as informal debt acknowledgments, and how understandi...


Chart patterns are a cornerstone in technical analysis and help traders forecast market moves by studying past price behavior. Having a clear chart patterns cheat sheet at your fingertips can be a lifesaver when things move fast and you need to make snap decisions. This guide leads you through the key patterns, explains what they typically signal, and offers practical tips to boost your accuracy and confidence when trading.
Chart patterns are those familiar shapes that tend to pop up on price charts, often giving a nudge about where the market might be cruising next. They reveal the ongoing tug-of-war between supply and demand, plus a peek into what’s on traders’ minds.
Successful traders usually have a knack for spotting a handful of chart patterns that tend to pop up time and again across various markets and timeframes. Getting familiar with these key formations can really boost your ability to identify trade setups that stand a better shot at success and manage risk with a bit more confidence.
Reversal patterns often signal that the current trend is wrapping up and a fresh one could be just around the corner. These formations are like little warning signs for traders, helping them catch potential turning points.
| Pattern Name | Visual Characteristics | Typical Market Context | Trade Entry Signals | Stop-Loss Placement | Profit Targets |
|---|---|---|---|---|---|
| Head and Shoulders | Three peaks lined up: a left shoulder, a taller head in the middle, then a right shoulder | An uptrend that’s looking like it’s losing steam | A decisive break below the neckline right after that right shoulder forms | Just a tad above the right shoulder | A target roughly matching the height from the head down to the neckline |
| Double Top | Two distinct peaks sitting at pretty much the same high point | A bullish trend that’s beginning to wobble | A break below the valley that sits snugly between those two peaks | Just above the second peak, as a safety net | About the same height as those twin peaks |
| Double Bottom | Two comparable low spots creating a couple of valleys | A downtrend that seems to be easing off | A break above the peak that separates the bottoms | Just a shade below the second bottom | Generally close to the height measured between the bottoms |
| Inverse Head & Shoulders | Like the head and shoulders pattern, but flipped upside down | A downtrend that looks like it’s turning around | A break above the neckline is the go-ahead | Just below the right shoulder to keep risk tight | Distance roughly equal to the height from the head to the neckline, aiming for that sweet spot |
Continuation patterns hint that the current trend is likely to keep on trucking after a brief pause or a little breather in the market. Traders often lean on these patterns to gear up for the trend’s comeback, offering solid clues for managing risk and nailing down target points.
| Pattern Name | Visual Features | Market Trend Context | Entry Confirmation | Risk Management Tips | Target Projections |
|---|---|---|---|---|---|
| Ascending Triangle | Horizontal resistance paired with rising lows | Uptrend showing strong bullish momentum, making bulls feel pretty confident | Break above resistance supported by convincing volume, a nice green light to enter | Place stop just below the latest low to avoid getting shaken out by a small dip | Expect the price to push upwards roughly equal to the triangle’s width, a neat little rally |
| Descending Triangle | Horizontal support combined with descending highs | Downtrend marked by bearish pressure, like sellers slowly tightening their grip | Break below support level confirmed by solid volume, signaling the bears are serious | Place stop just above the recent high to dodge a false breakout | Anticipate price moving downwards about the triangle’s width, a drop worth watching closely |
| Symmetrical Triangle | Converging trendlines creating a tightening price range | Shows up in trending or sideways markets, where the market is basically holding its breath | Breakout can happen in either direction, so stay sharp and ready | Place stop snugly inside the triangle boundaries to keep risk in check | Expect a move roughly equal to the height of the triangle’s base starting at breakout, a classic move |
| Flag | Sharp price move followed by a brief rectangular consolidation | Usually signals continuation of a strong trend, like a quick pit stop before more action | Breakout in the direction of the previous trend, a signal that the momentum train keeps rolling | Place stop just outside the flag pattern for some breathing room | Target the move equal to the length of the preceding price jump—the old pole—simple and elegant |
| Pennant | Small symmetrical triangle forming after a sharp price move | Often pops up during strong trends, a mini pause before the next big push | Break above or below the pennant with volume confirmation, because volume never lies | Place stop safely inside the pennant pattern to limit losses | Target projection matching the length of the flagpole, a tidy little price goal |
| Wedges | Sloping price range narrowing either upwards or downwards | Could be hinting at a reversal or continuation, keep your eyes peeled | Breakout direction backed by volume, giving you that extra nod of confidence | Place stop securely inside the wedge to avoid getting caught off guard | Expect a move roughly equal to the wedge’s height, a classic and reliable target |
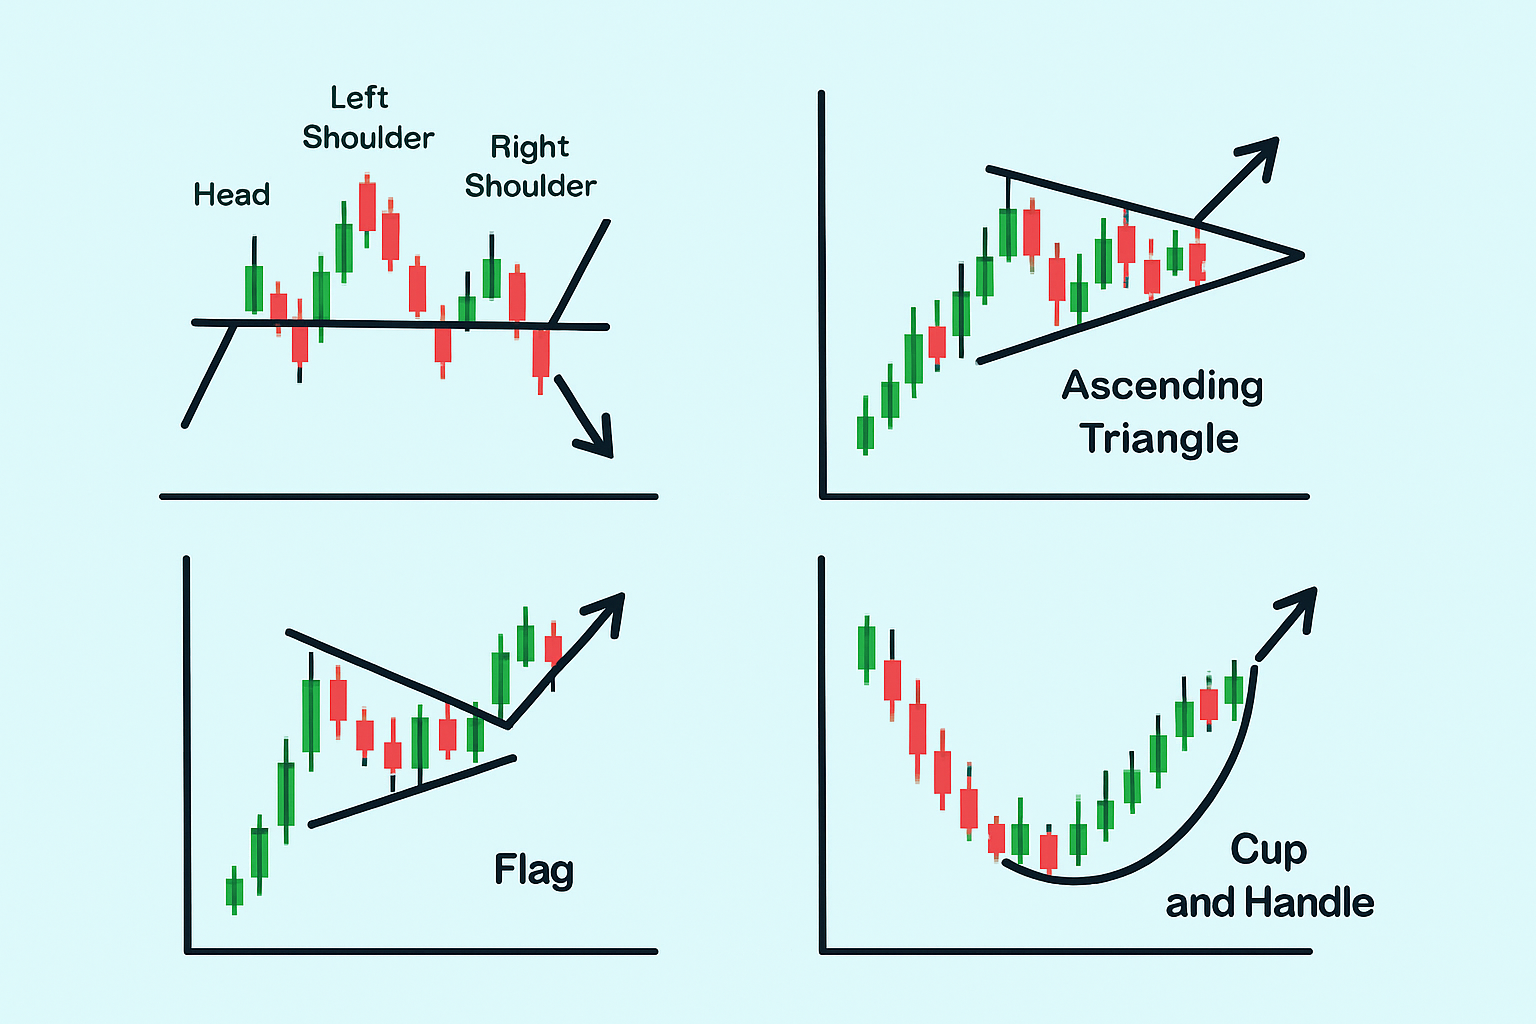
Visual examples of key chart patterns including Head and Shoulders, Triangles, Flags, and Cup and Handle.
A chart patterns cheat sheet can truly speed up the way a trader spots and jumps on patterns. Using it regularly not only sharpens market awareness but also helps confirm trade setups faster, making it easier to pull the trigger with greater confidence and precision.
Pinpoint the main market trend by looking across multiple timeframes to catch the full picture.
Make it a habit to regularly scan your charts for any pattern formations using your cheat sheet definitions to guide you.
Double-check that a pattern holds water by digging into volume patterns and related indicators. Confirmation is your best friend here.
Let the cheat sheet’s tips on signals, stops and targets help you craft your trade entries and exits like a pro.
Keep risk in check by setting stop-loss levels and managing your position sizes just as your guide suggests. No going off the rails.
Don’t forget to review your trade results often and tweak your cheat sheet insights as you learn from real-world action.
Traders often stumble in familiar ways—misreading patterns or missing important volume confirmation. They may also let emotions take the wheel instead of sticking to a solid set of rules. These slip-ups usually chip away at potential profits and increase risk more than anyone wants.
"Successful trading often boils down to hanging in there with patience and discipline, waiting for that clear pattern to give you the green light, all while keeping a firm grip on risk management." – Professional Technical Analyst
Traders aiming to snap up quick trades often find it’s smart to blend chart patterns with technical tools like volume and momentum indicators, multi-timeframe analysis or automated alerts.
Taking a close look at real trade examples really helps traders grasp how spotting patterns on the fly and jumping on them can actually pay off. These case studies show how the cheat sheet comes alive in real-world scenarios.
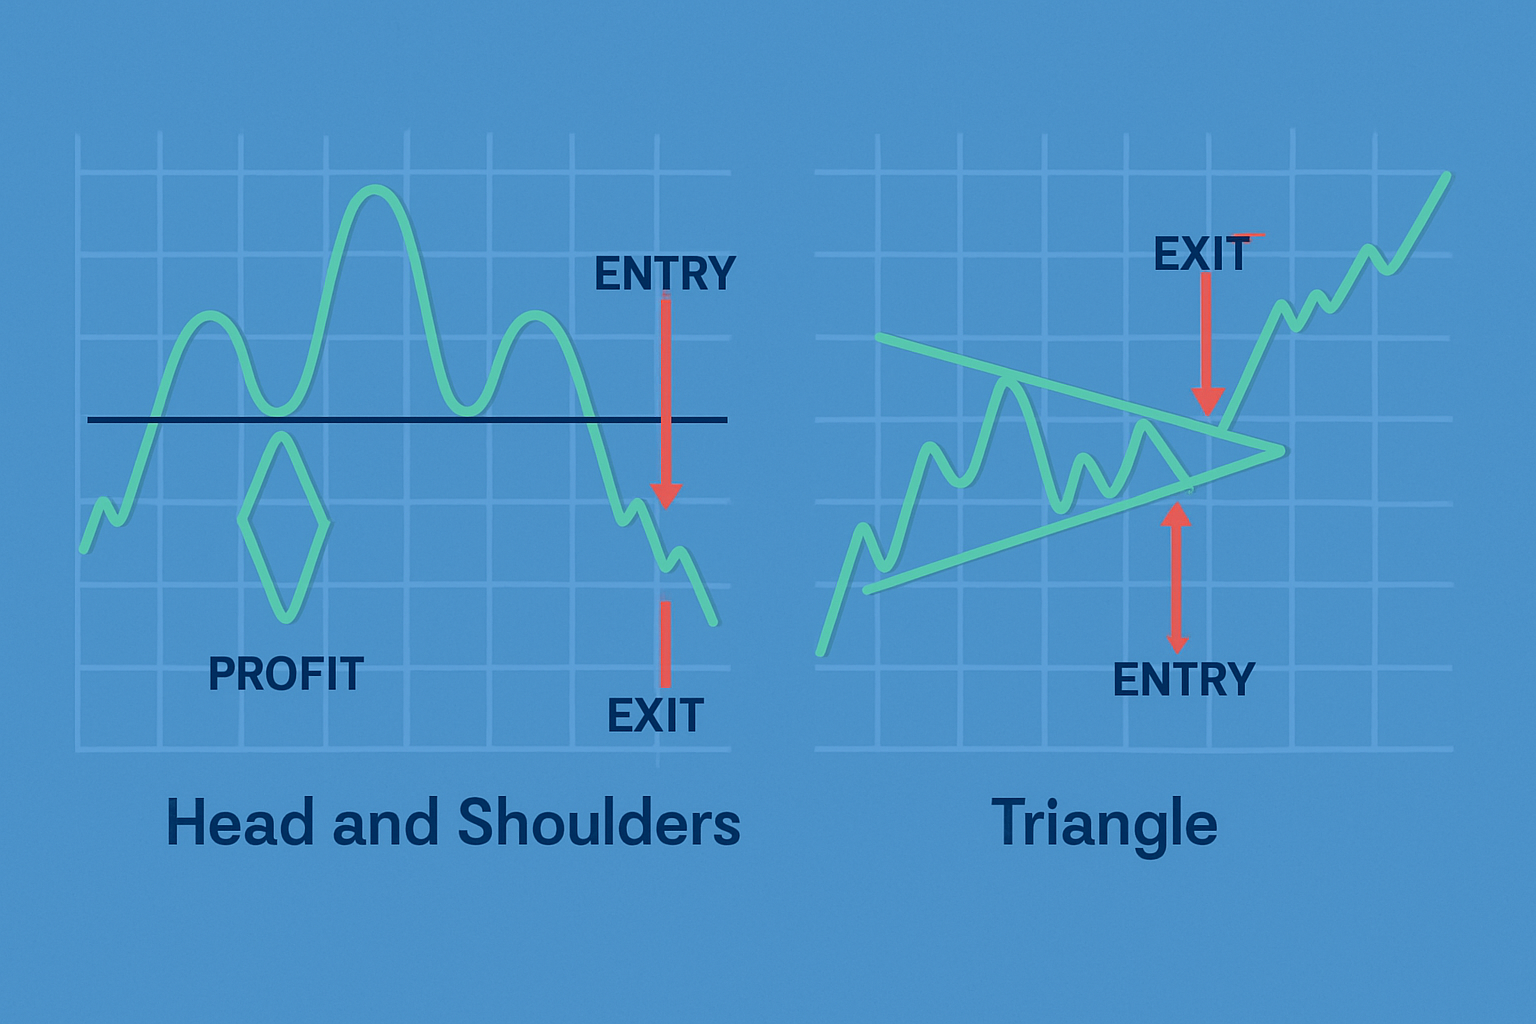
Annotated charts illustrating real trade setups and outcomes using chart patterns cheat sheet.
Setup Description Lays down the groundwork by giving a bit of the backstory—think market environment and the first glimpse of that trend taking shape.
Pattern Identification Calls out the chart pattern right as it’s cooking and shines a light on the confirmation signals you don’t want to miss.
Entry Decision Breaks down those key moments to jump in, backed up by reasoning straight from the trusty cheat sheet.
Risk Management Maps out exactly where to tuck in your stop-loss and take-profit orders, sticking closely to what the pattern suggests.
Outcome and Lessons Learned Wraps things up by summarizing how the trade played out and dishes out some valuable takeaways to sharpen your game moving forward.
Crafting a personalized chart patterns cheat sheet that fits your trading style, chosen instruments and go-to timeframes can sharpen your clarity and boost your speed when you're in the thick of trading.

Tired of missing opportunities and making suboptimal trading decisions? TrendSpider's cutting-edge platform automates complex technical analysis, saving you time and reducing human error.
With multi-timeframe analysis, dynamic alerts, backtesting, and customizable charting, you'll gain a competitive edge in identifying trends and making informed trades across global markets.

20 posts written
Discover what IOUs mean in finance, their role as informal debt acknowledgments, and how understandi...

Discover the bullish harami candlestick pattern—a key technical signal that can hint at trend revers...

Unlock the power of candle patterns to decode market psychology and improve your trading precision....

Discover the doji candlestick—a powerful price action signal revealing market indecision. This begin...