


Technical Analysis
IOU Meaning in Finance
Discover what IOUs mean in finance, their role as informal debt acknowledgments, and how understandi...

The simple moving average (SMA) might seem like a straightforward tool but it’s truly a cornerstone in technical analysis for spotting market trends. Essentially, it takes the price of an asset over a chosen time frame and averages it out to smooth the bumps of wild short-term price swings so you can get a clearer picture of where things are headed.
This article will help you truly get what a simple moving average is all about, how to crunch the numbers and sketch out SMA lines either by hand or with some trusty charting software—and then how to actually make sense of the signals those lines throw your way. Along the journey, we will explore some down-to-earth tricks for spotting trends with SMA lines and highlight a few common pitfalls that tend to trip people up.
A simple moving average (SMA) gives you the average price of an asset over a set number of periods.
The simple moving average (SMA) treats all data points equally unlike the exponential moving average (EMA) which leans more heavily on recent prices.
The SMA smooths out those pesky short-term price jitters by averaging prices over time.
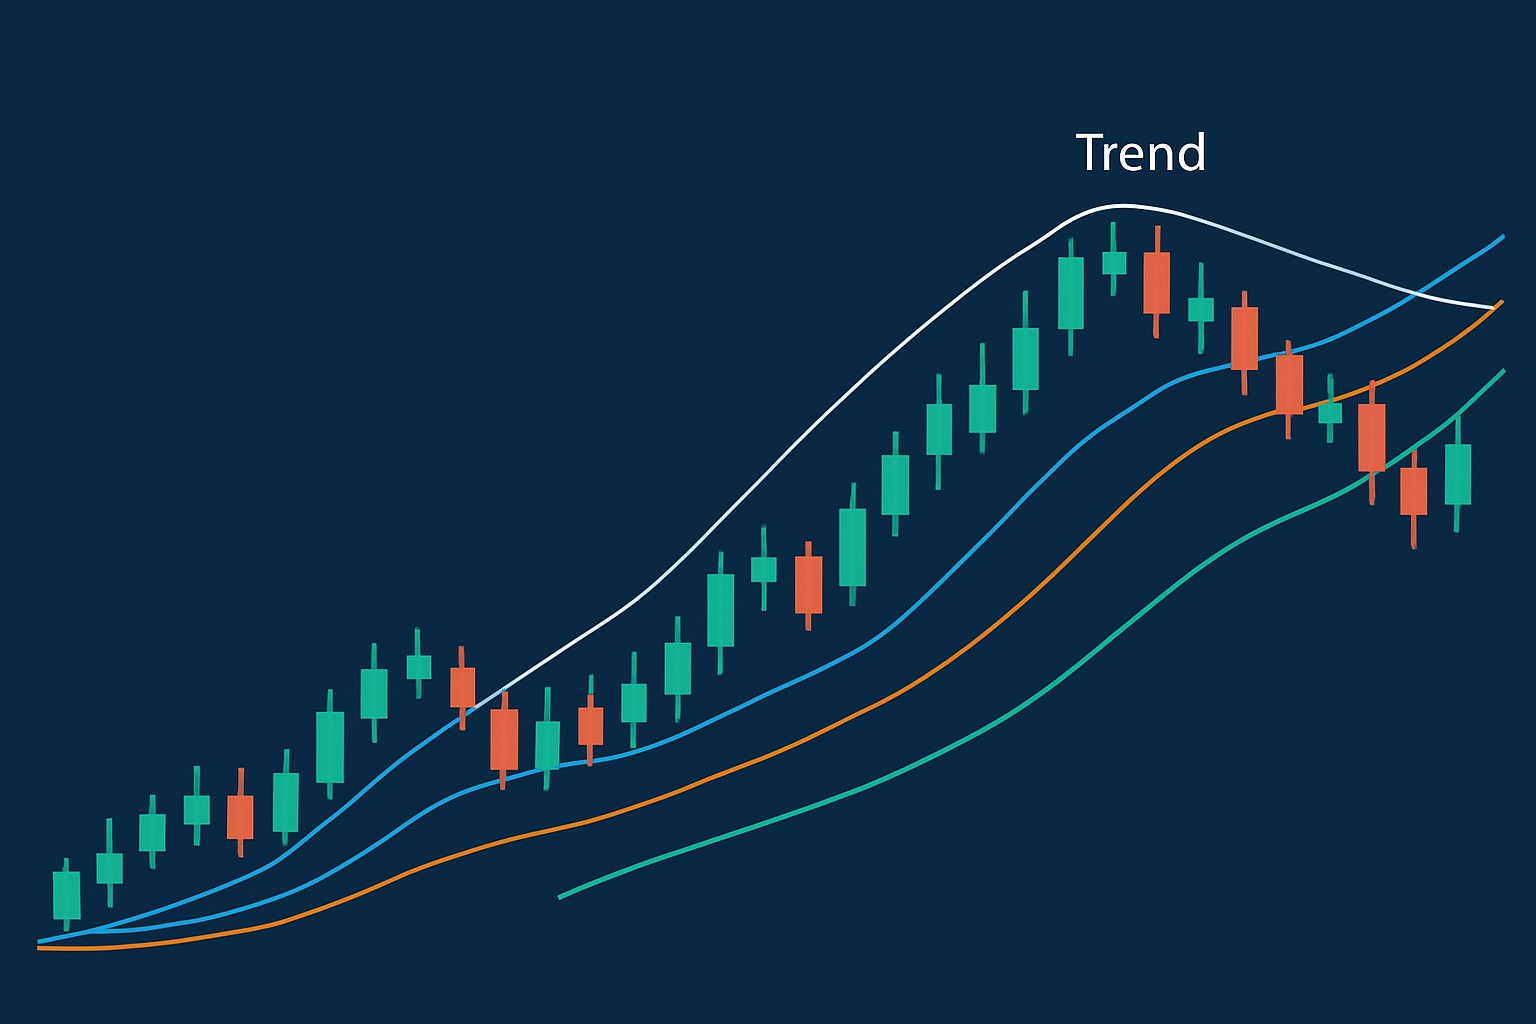
The SMA draws a clear visual trendline that helps traders see the direction a trend is moving and gauge how strong it is. It also gives a heads-up on potential reversals.

Chart illustrating a simple moving average line smoothing price data to highlight a market trend
Calculating the SMA by hand is straightforward. You add up the closing prices of an asset over a chosen number of periods and then divide that total by the number of periods. Take a 5-day SMA for example: just sum up the closing prices from the last five days and divide by five. Whenever a new closing price rolls in the oldest one gets nudged out and the SMA shifts accordingly.
Charting software and trading platforms like TradingView or TrendSpider make plotting SMA lines a breeze. They come with built-in SMA indicators. Just punch in your desired period length and voilà the software sketches out the line instantly.
Choose the timeframe that fits your trading style whether you like to keep an eye on things daily, hourly or weekly.
Hunt down the SMA indicator in your charting platform’s technical analysis toolbox since it’s usually easy to find.
Punch in the period length you prefer like 20, 50 or 200 periods whichever vibes best with your game plan.
Keep an eye on where that SMA line is sitting in relation to the price. This is a great way to get a feel for the overall trend and spot those sneaky turning points.
Common SMA periods usually fall into the 20, 50, 100 and 200 range with each playing a unique part in the game. Traders often lean toward shorter periods like the 20 SMA to catch quick fleeting trends and stay nimble on their feet. Medium stretches like the 50 SMA help tease out intermediate trends and spot support or resistance zones. Then you have got the longer periods—100 and 200 SMAs—which give investors a big-picture feel for the market's overall direction and major trend turns.
| SMA Period | Typical Use Case | Timeframe Suitability | Trend Signals Generated |
|---|---|---|---|
| 20 | Handy for catching short-term trends on the fly | Perfectly suited for intraday or daily action | Reacts swiftly to price twists and turns |
| 50 | Great for getting a feel of intermediate trends | Fits nicely into daily to weekly rhythms | Helps you spot those medium-term shifts without breaking a sweat |
| 100 | A trusty ally for confirming longer-term trends | Best when you’re thinking weekly to monthly | Puts the spotlight on stronger trend momentum, the kind that sticks around |
| 200 | Your go-to for tracking the big-picture market moves | Ideal for monthly outlooks and beyond | Often throws up major trend reversals plus key support or resistance zones—kind of like market signposts |
Pick SMA periods that truly match your trading or investment goals. Day traders often lean towards shorter SMAs aiming for quicker signals that keep them on their toes. Long-term investors typically prefer longer SMAs for smoother and more reliable trend confirmation.
Rising SMA lines generally signal an uptrend and indicate stronger market momentum. SMA lines that dip downward often hint at a slowdown or a downtrend creeping in.
Traders often keep an eye on the price crossing the SMA line as a simple, no-nonsense way to spot trends. When the price nudges above the SMA, it’s usually a hint that a bullish trend is just getting warmed up.
The slope of the SMA and its position compared to the price often give traders a good sense of how strong the momentum is. When the SMA shoots up sharply it is usually a sign that buying pressure is coming on strong. On the flip side if the SMA starts to flatten out or dip it often signals that the trend might be running out of gas or wrapping up its run.
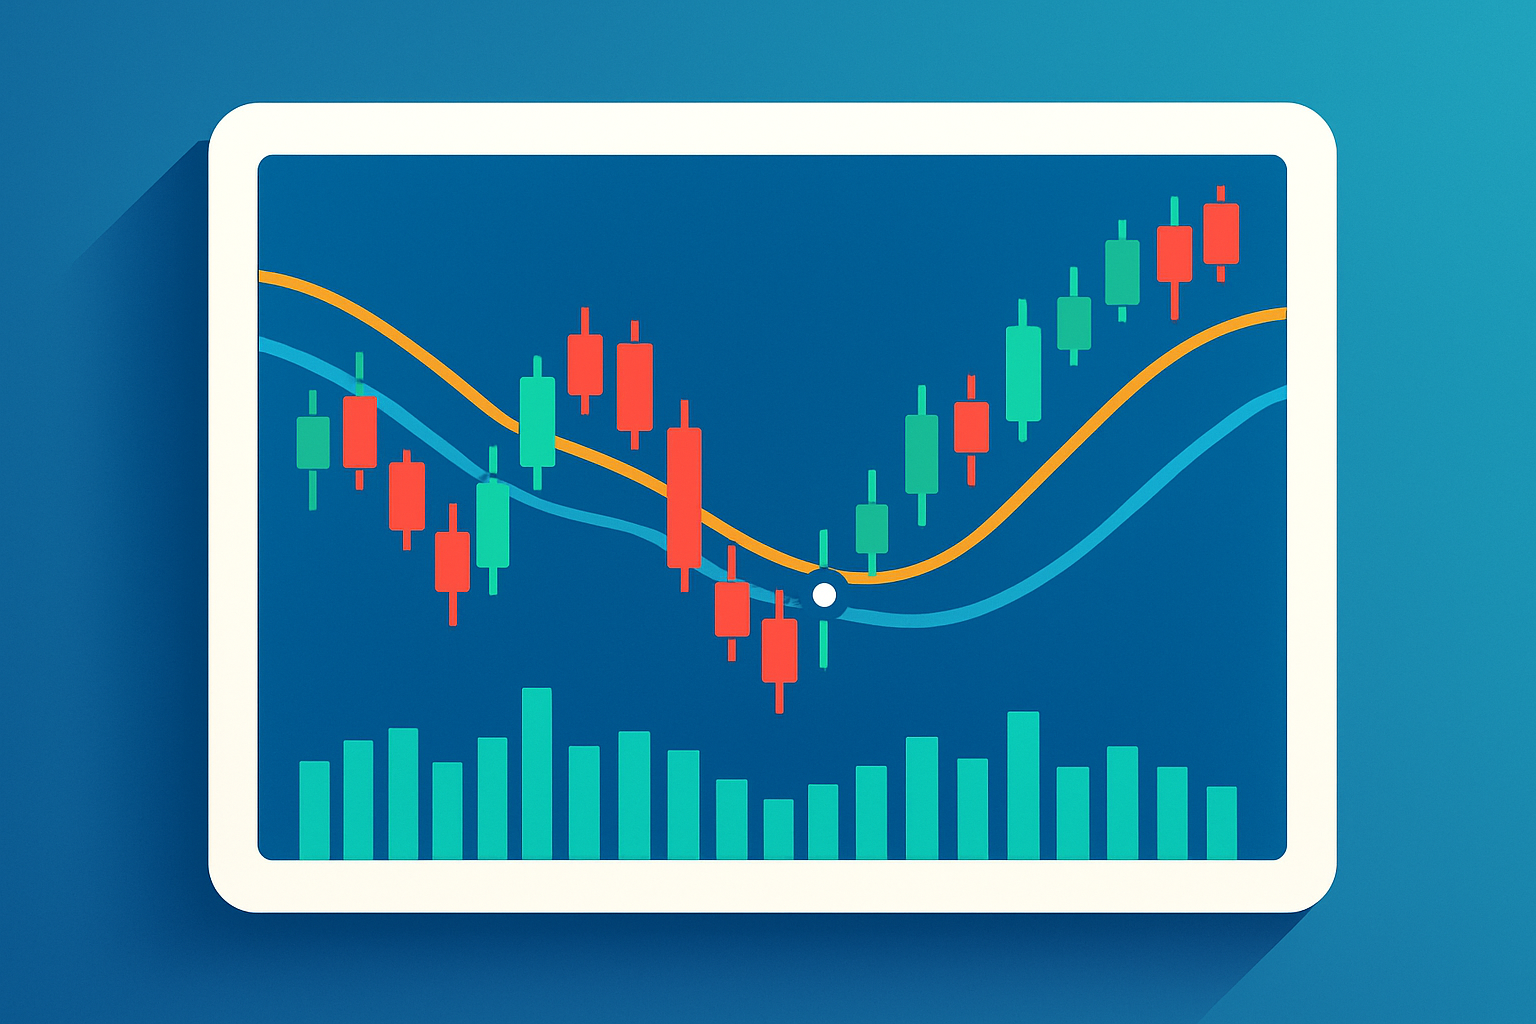
Example of SMA lines with price and volume indicators demonstrating bullish and bearish crossover signals
Relying solely on SMA lines can easily send you down the wrong path if you ignore other market conditions or indicators. I’ve found it’s important to mix in volume, momentum indicators or some fundamental analysis to get the full picture.
Since SMA usually trails behind price movements instead of forecasting them, it can sometimes leave traders jumping in or out of trades a bit later than they would like.
Patience and confirmation are honestly the secret sauce for nailing successful trading with moving averages. Sitting tight and waiting for those signals to line up nicely with the bigger market trends can really save you from those painful, costly mistakes that individuals often regret.
Let’s take a closer look at how you might use SMA lines on a real trading chart to spot a budding uptrend and reinforce your trading decisions with a little help from other indicators.
Pick the asset you want to analyze along with the timeframe—something like the daily chart for a stock usually works well.
Add a 50-period SMA and a 200-period SMA to your chart because these help you spot intermediate and long-term trends that might otherwise go unnoticed.
Watch for the price moving above both SMA lines recently as that often signals a bullish trend gaining momentum.
Check if rising volume supports the breakout since your platform’s volume indicators can be a useful aid here.
Use these signs to decide whether it is time to enter a long position or if waiting for clearer confirmation might be more rewarding before making the trade.

Example chart demonstrating price movement crossing SMA lines with volume surge to signal trend initiation
This example highlights how the simple moving average (SMA) can be a handy tool for spotting trend changes, especially when you team it up with volume analysis. Give it a whirl on demo accounts and user-friendly charting platforms like TradingView, which offers robust features and a bunch of technical indicators to make plotting and studying SMA lines feel less like rocket science.

Struggling to improve your trading performance? Edgewonk's advanced analytics tools are designed to give you the edge you need.
With detailed trade journaling, robust strategy analysis, and psychological insights, you'll gain a comprehensive understanding of your strengths and weaknesses. Don't miss out on this game-changing opportunity.

17 posts written
Discover what IOUs mean in finance, their role as informal debt acknowledgments, and how understandi...

Unlock the power of candle patterns to decode market psychology and improve your trading precision....

Unlock the power of the head and shoulders pattern with this complete guide. Learn to spot, trade, a...

Unlock the power of the bear flag pattern with our practical, step-by-step guide. Understand market...