


Technical Analysis
What is a Harami Pattern? Breaking It Down
Learn how the harami candlestick pattern signals potential market reversals. This guide breaks down...

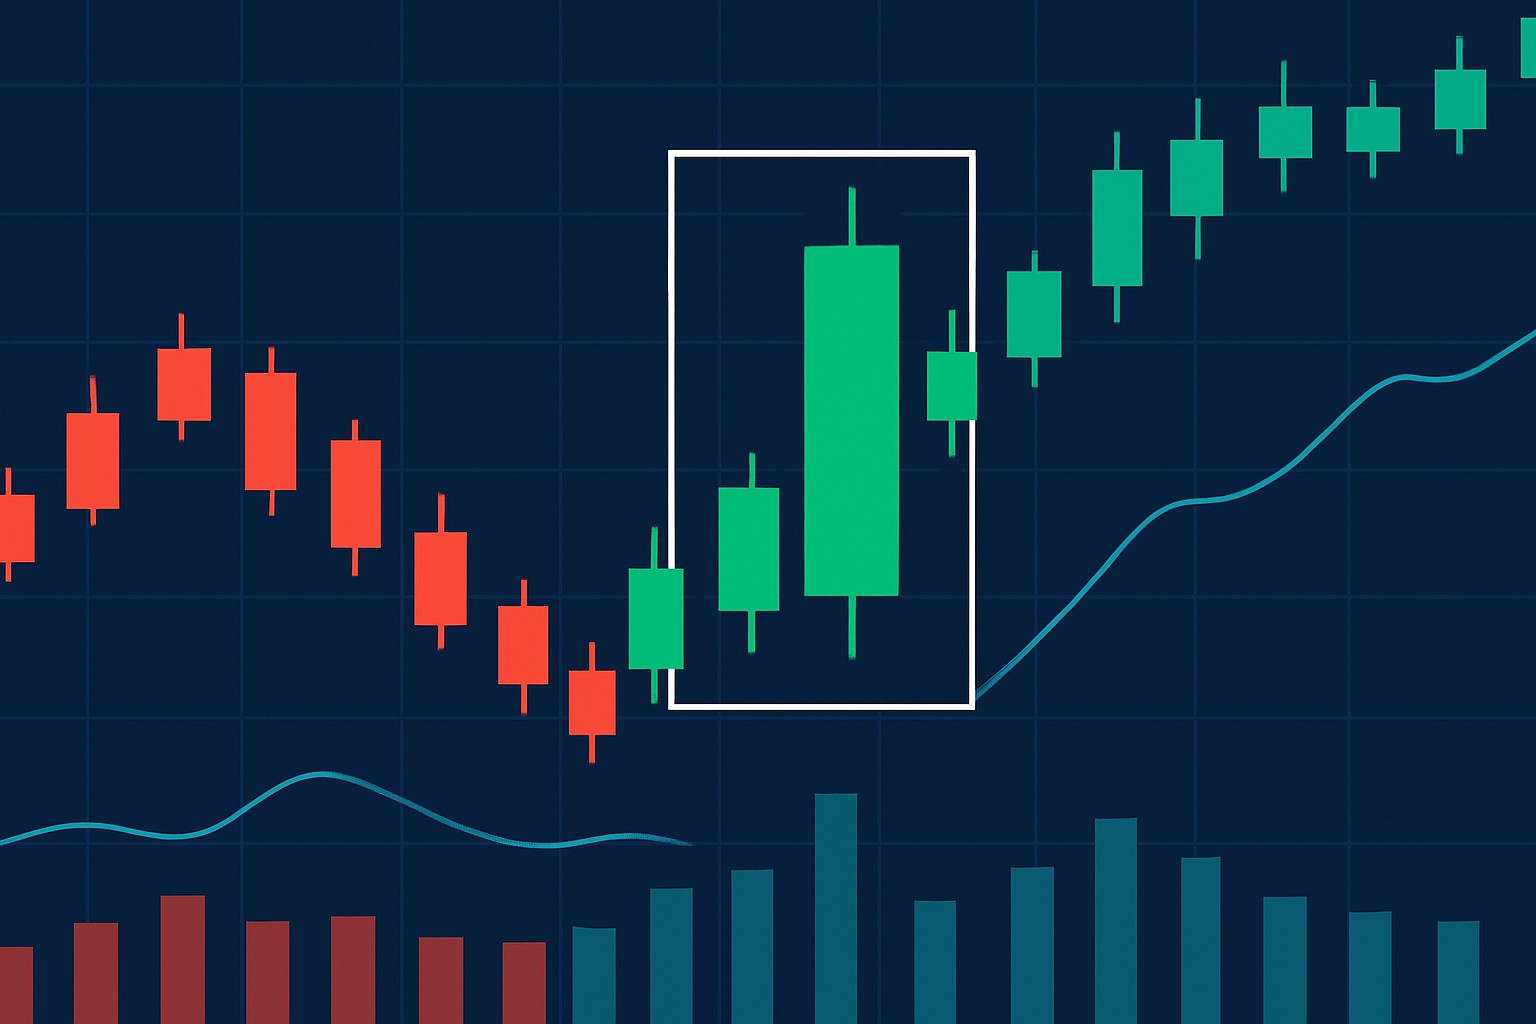
The engulfing candle pattern is often hailed as one of the more trusty signals for spotting potential market reversals. It really grabs your attention because it paints a clear picture of a strong momentum shift between buyers and sellers. Many traders, including myself at times, find it tricky at first to spot a genuine engulfing candle and fully grasp what it’s trying to tell you.
An engulfing candle is a specific candlestick pattern where the body of one candle completely covers—or "engulfs"—the body of the previous candle. This pattern often hints at a significant shift in market momentum and can be a red flag for a potential reversal in the current trend.
Engulfing candles show up in two main flavors: bullish and bearish. Each one sports a distinct shape that really tells the story of market sentiment.
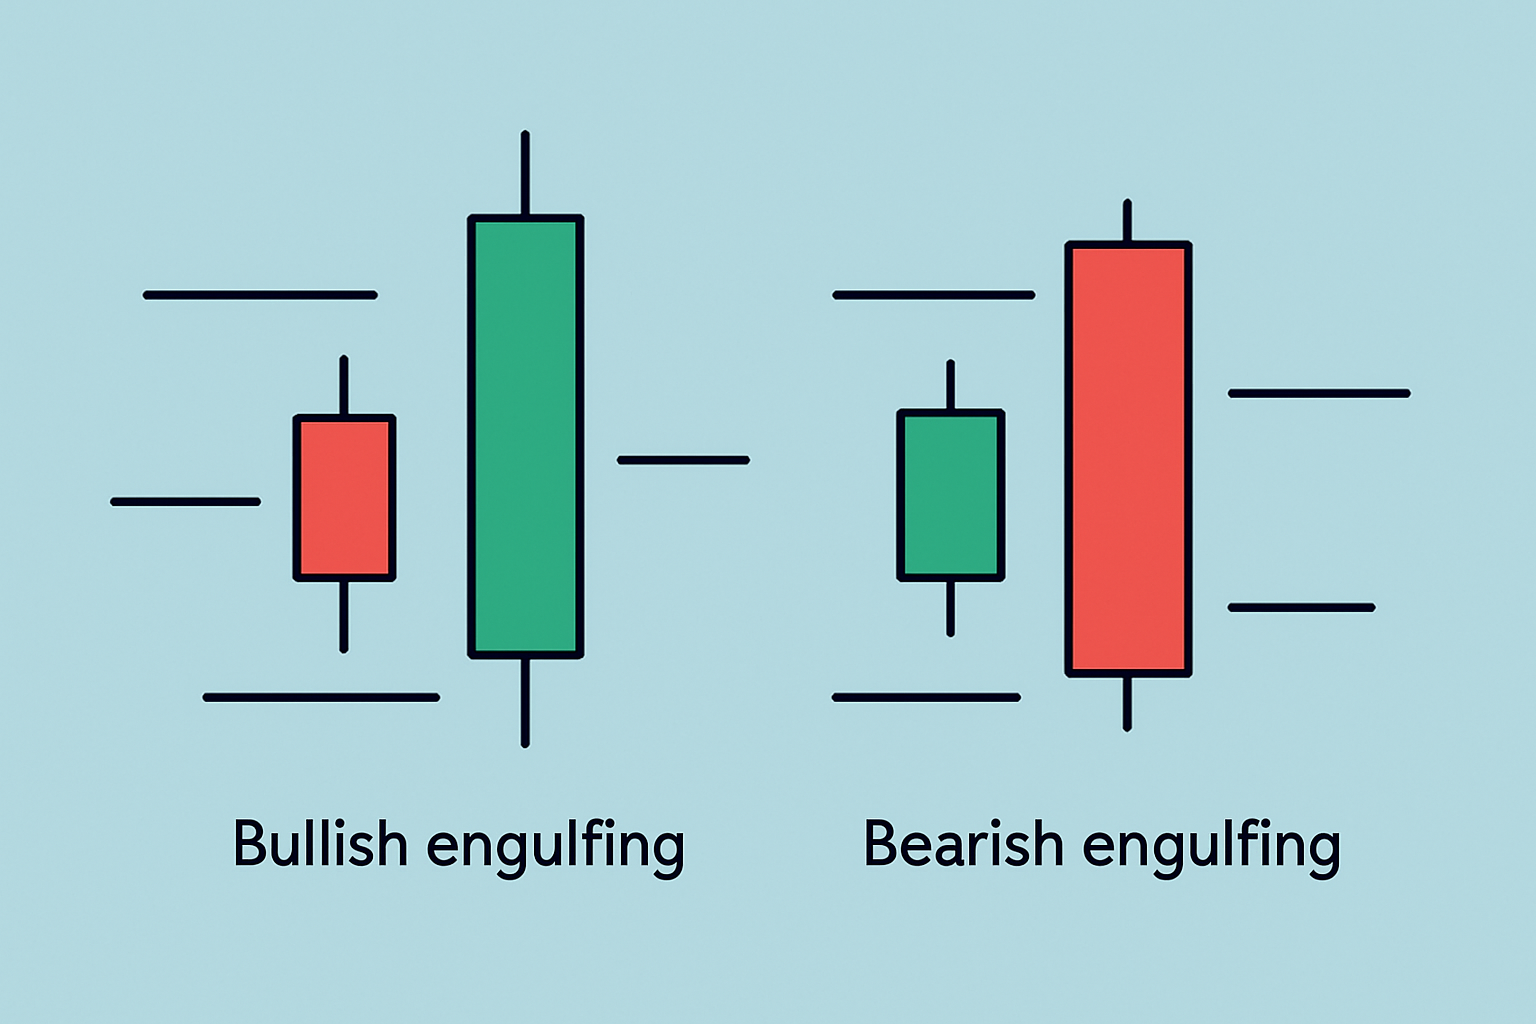
Illustration of bullish and bearish engulfing candle patterns showing the larger candle engulfing the previous smaller candle.
The engulfing candle pattern really shines a light on the tug-of-war between buyers and sellers, with one side clearly coming out on top. This swift change in momentum is exactly why it often points to a trend reversal.
"Picture the engulfing candle like a tug-of-war where suddenly, one team yanks the rope with surprising force, practically shouting that the tide might be turning in their favor."
Spotting a genuine engulfing candle calls for a keen eye and some know-how to dodge usual traps. This step-by-step guide helps you separate the wheat from the chaff, avoid misleading signals, and interpret these patterns in the right market context
Eyeball the body sizes of two candles lined up. The second candle’s body should completely swallow up the first one’s body from open to close with no half measures.
Don’t get fooled by just the wicks overlapping because it’s the full real body that needs to be covered for this pattern to actually count.
Make sure the engulfing candle shows up after a clear trend or direction. On its own, it’s a bit like a plot twist with no context and kinda meaningless.
Keep an eye on the color switch. A bullish engulfing means a green candle is covering a red one while a bearish pattern flips that around with red covering green.
Watch the volume during the engulfing candle. Higher volume usually pumps up the strength of the reversal signal and makes it all the more convincing.
Understanding the broader context truly makes all the difference. Take for example an engulfing candle that pops up after a long trend. It tends to carry more weight than one sneaking into a sideways market. When you see volume spikes tag along with that engulfing candle it piles on the evidence. Platforms like TradingView are a trader’s best friend here because they let you zero in on these details with their customizable charts and volume indicators.
Including engulfing candles in your trading plan is about more than just spotting them in the wild. You need a clear game plan for when to jump in, where to place your stop-losses and the best spots to lock in profits.
Many traders often dive headfirst into a trade at the sight of an engulfing candle without waiting for real confirmation. This impatience can trip them up, especially when the markets are volatile or choppy. Relying purely on the pattern while ignoring volume or the broader trend tends to make things less reliable. It is like putting all your eggs in one basket.
Engulfing candle patterns pop up across many asset types from stocks and forex to cryptocurrencies. When you dig into real-world examples you start to see how these patterns often point to profitable reversals. Fair warning though, they sometimes throw a curveball with false starts.
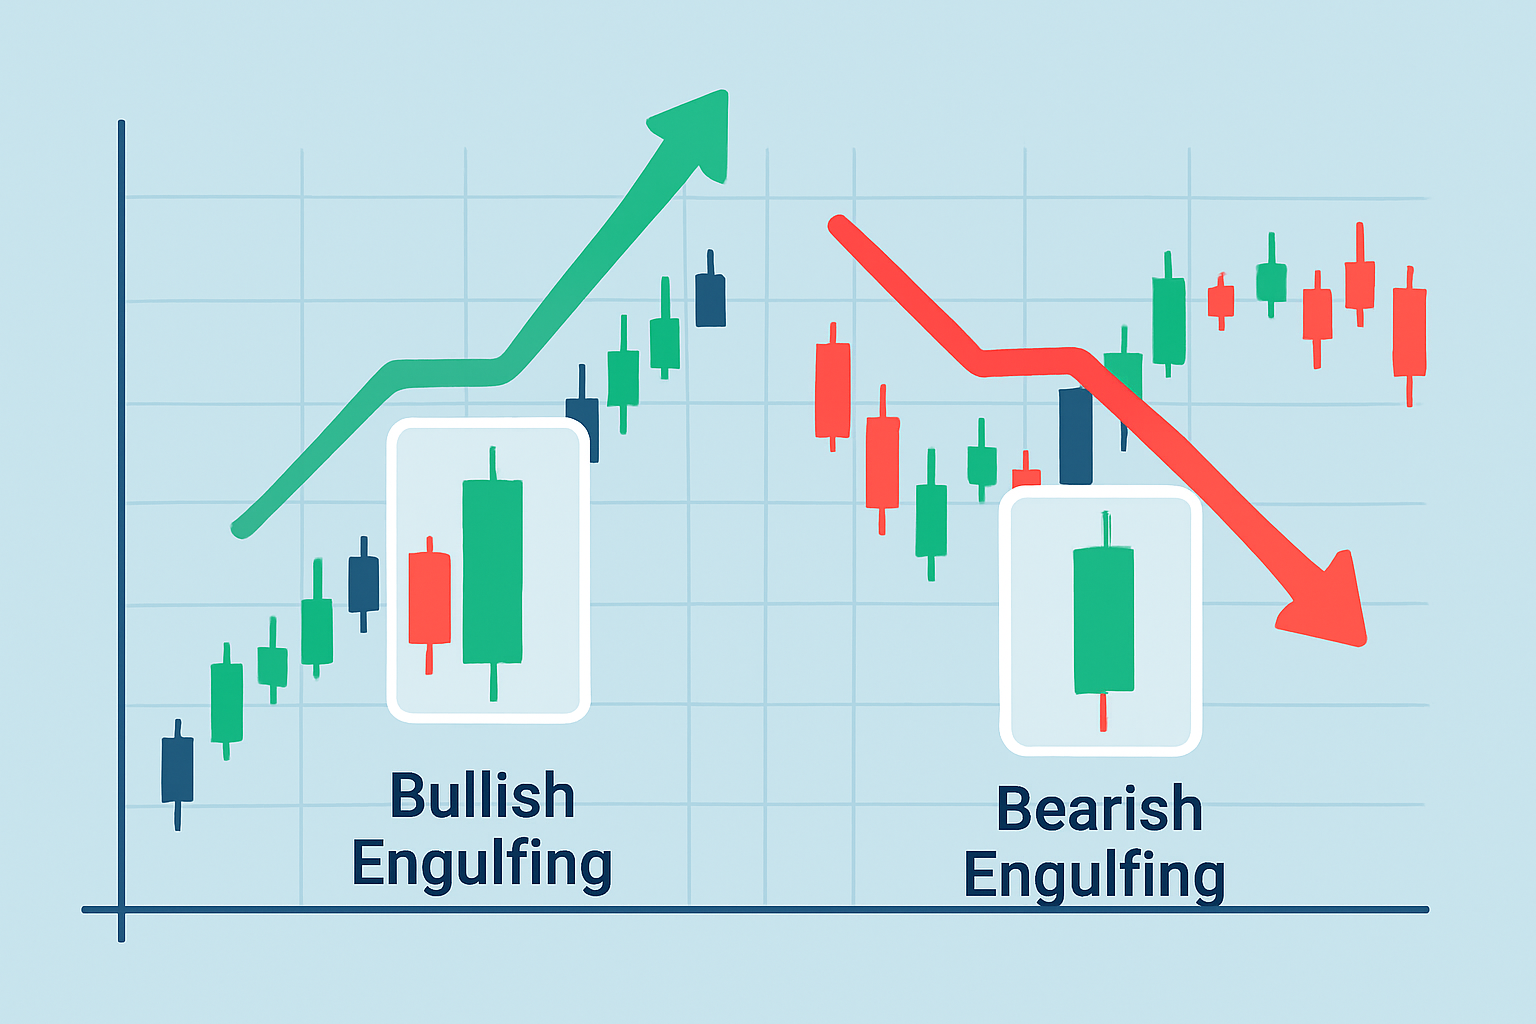
Visual examples of engulfing candle patterns highlighted in multiple markets including stocks, forex, and crypto.
| Market | Date | Pattern Type | Trend Before | Outcome | Notes on Confirmation or Failure |
|---|---|---|---|---|---|
| Stock XYZ | 2023-03-15 | Bullish Engulfing | Downtrend | Reversal Up | Confirmation came as RSI dipped into oversold territory, paired with a nice bump in volume—classic signs to watch for |
| EUR/USD | 2023-02-20 | Bearish Engulfing | Uptrend | Reversal Down | The MACD crossover gave a solid thumbs up to the reversal, leaving little doubt |
| Bitcoin | 2023-04-01 | Bullish Engulfing | Sideways | False Signal | Low volume and a sideways market basically pulled the rug out from under this one, causing the pattern to fizzle |
| Stock ABC | 2023-01-10 | Bearish Engulfing | Uptrend | Reversal Down | Price did not mess around and dropped sharply right after, confirming the signal in a rather dramatic fashion |
| Forex JPY | 2023-05-05 | Bullish Engulfing | Downtrend | Reversal Up | Backed up nicely by an uptick in volume and growing bullish momentum—pretty textbook stuff |
These examples show that engulfing candles tend to work best when they have a little backup from other technical signals like volume spikes or momentum indicators. They can be powerful hints at reversals.
Engulfing candles often stand out as powerful reversal signals, but let’s be honest—they’re far from perfect. Their reliability can take a serious hit in tricky market conditions, like when prices are just going sideways or when volatility spikes without warning. That’s exactly why I’ve found it’s best to pair engulfing candle analysis with other technical tools and a well-rounded grasp of the market.
Let's take a moment to glance over the big picture before diving into the nitty-gritty. This section sets the stage, giving you a clear snapshot of what is to come—no fluff, just the essentials laid out in a straightforward way. Think of it as your roadmap, helping you navigate the details that follow with a bit more ease and a touch of insight.

Are you tired of juggling multiple tools for your trading needs? TradingView is the all-in-one platform that streamlines your analysis and decision-making.
With its powerful charting capabilities, real-time data, and vibrant community, TradingView empowers traders like you to stay ahead of the market. Join thousands who trust TradingView for their trading success.

16 posts written
Learn how the harami candlestick pattern signals potential market reversals. This guide breaks down...

Discover the doji candlestick—a powerful price action signal revealing market indecision. This begin...

Unlock the power of the bear flag pattern with our practical, step-by-step guide. Understand market...

Discover what IOUs mean in finance, their role as informal debt acknowledgments, and how understandi...