


Technical Analysis
Most Important Candle Patterns Every Trader Should Know
Unlock the power of candle patterns to decode market psychology and improve your trading precision....

The rising wedge pattern often pops up in technical analysis and usually signals some pretty important shifts in market direction. Catching this pattern can give traders a leg up in predicting whether prices will reverse or keep marching along the current trend.
A rising wedge pattern pops up on price charts when you see two trendlines slanting upwards and inching closer together. Both the highs and lows of the price steadily climb, but the space between them gets tighter and tighter. Imagine two uphill roads that slowly lean in towards each other until they almost touch yep, that’s the picture a rising wedge paints.
Spotting a rising wedge on a price chart is usually pretty straightforward once you know what to look for. Watch for those higher highs and higher lows that seem to be inching closer and closer together. Then, draw two upward-sloping lines connecting these points to check if they are actually converging.
Start by spotting a pattern of higher highs and higher lows on the price chart. It’s like the market’s little way of telling you it’s moving up.
Draw those trendlines connecting these highs and lows and make sure both are slanting upwards. It’s kind of like tracing a gentle uphill climb.
Keep an eye on the two trendlines as they inch closer and closer together, squeezing the price range tighter and tighter.
Peek at the volume during this whole setup because a rising wedge often plays coy by showing decreasing volume, which hints that the momentum might be running out of steam.
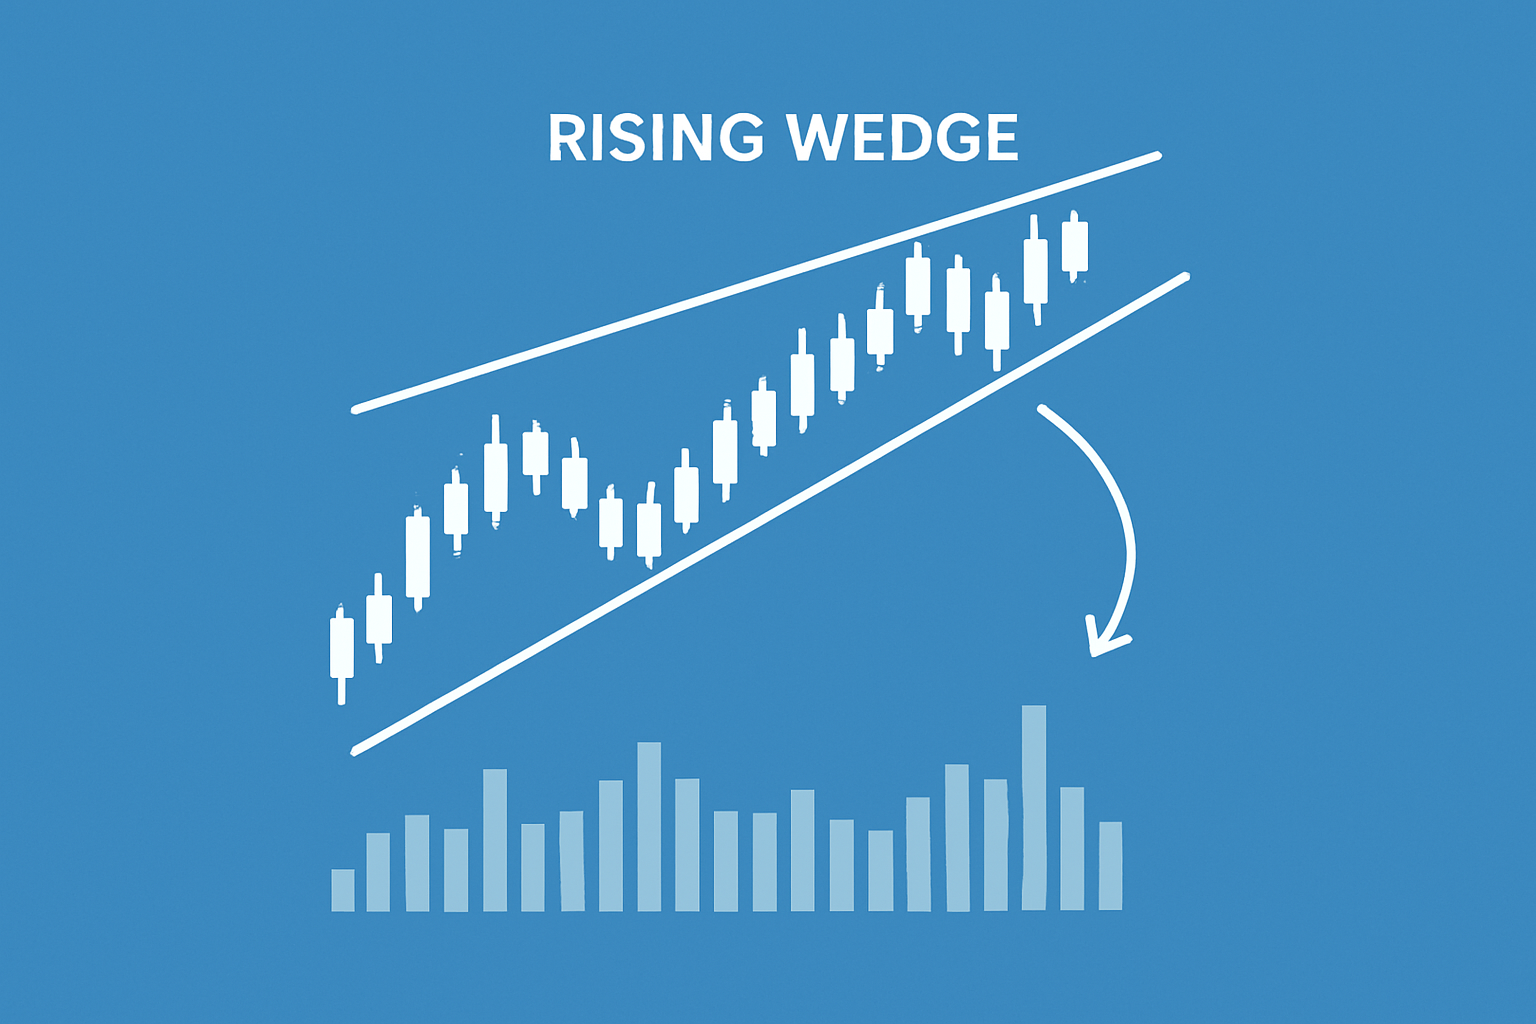
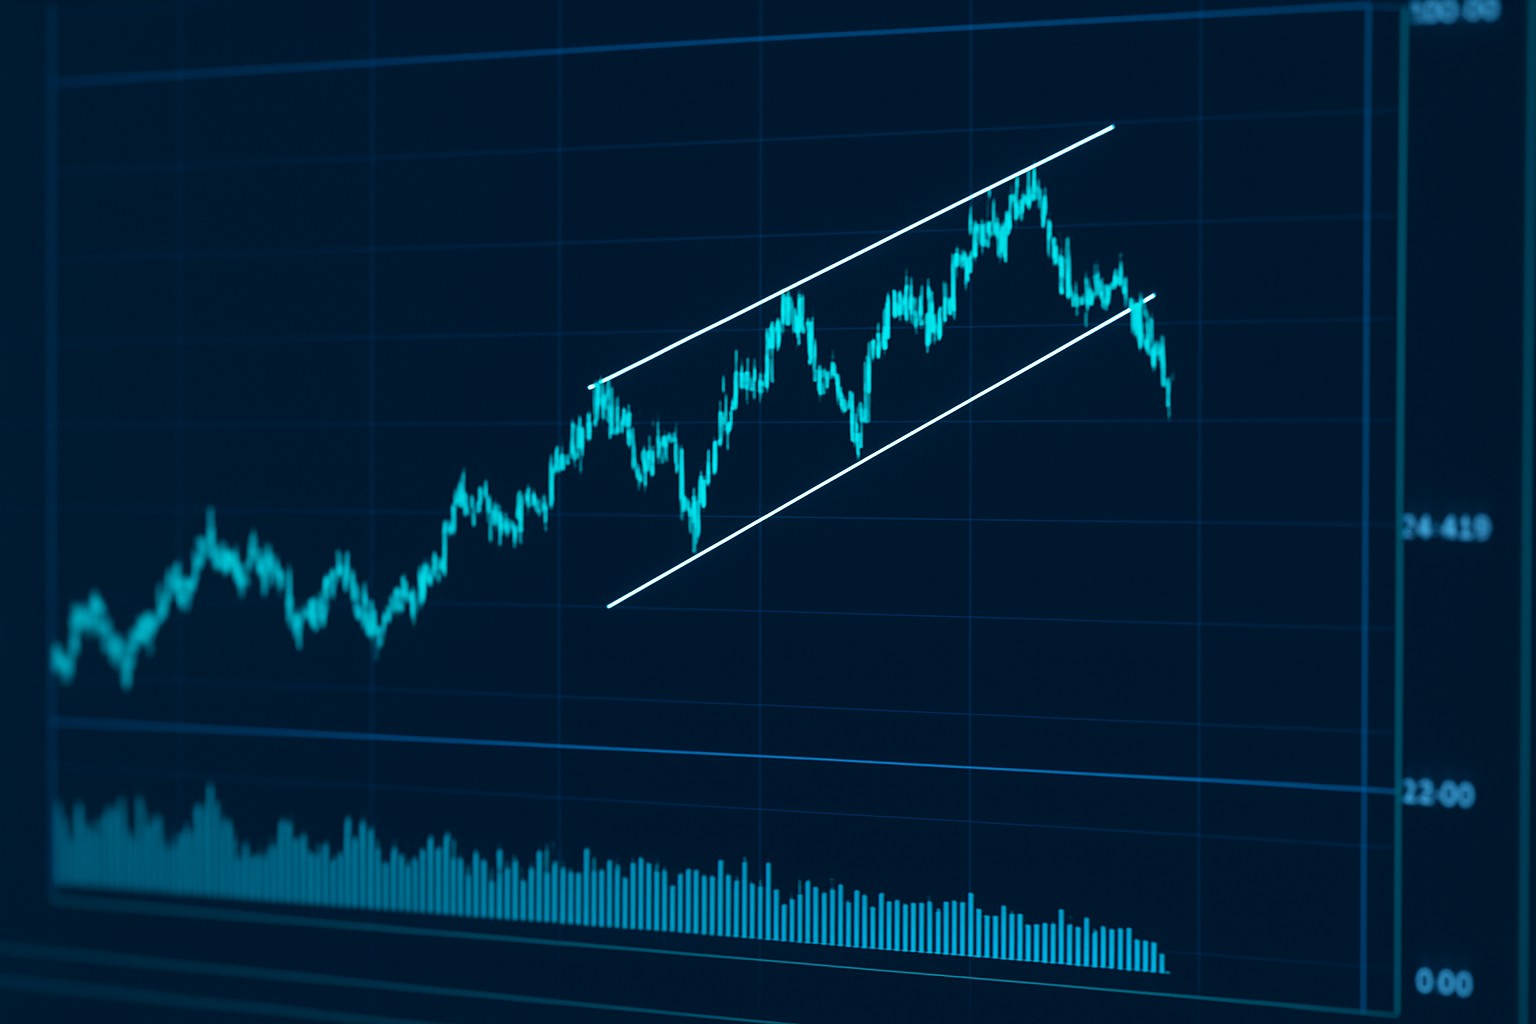
Example of a rising wedge pattern on a price chart showing converging trendlines and decreasing volume.
A rising wedge usually signals that an uptrend is starting to lose steam and is often viewed as a bearish reversal pattern, especially after a solid price rally. In downtrends, it can surprisingly play the role of a continuation pattern.
Picture the rising wedge like a tightening tunnel where each step up feels just a bit more labored—almost like climbing a hill that suddenly seems steeper than you expected. It usually hints that the market's upward momentum is losing steam, and a downturn might be just around the corner.
The rising wedge tends to get a bad rap and is often misunderstood. Even seasoned traders can be tripped up by it. Not every wedge spells an inevitable price drop. If you pay close attention, volume patterns often throw in their own twist. Expecting this pattern to behave like clockwork every time is wishful thinking.
Traders often lean on the rising wedge pattern to nail their entry and exit points, usually waiting patiently for a clear breakout below the wedge's support line. A common play is to set stop loss orders just above the latest high. This pattern tends to pack more punch when you’ve got volume confirmation and a few other technical indicators backing it up.
Be patient and wait until the price drops below the wedge’s lower support trendline before making a move.
Look for a clear breakout accompanied by a noticeable spike in trading volume. This is your best way to avoid those tricky false signals.
Place a stop loss just above the most recent swing high inside the wedge. Think of it as your safety net to keep risk under control.
Set your profit targets by measuring the pattern’s height and projecting that distance down from the breakout point. This classic approach is reliable and proven.
Stay alert for false breakouts by watching for quick reversals, and always double-check with other tools to avoid getting caught off guard.
History has a funny way of showing rising wedges popping up just before big market tumbles, whether it is during a major stock correction or a slump in commodity prices. Not every breakout pans out as neatly as you would hope, so double-checking the pattern and keeping risk firmly in check is absolutely key.
Rising wedge patterns can offer some handy clues but leaning on them too heavily can be a bit of a gamble. Trendlines often come down to interpretation and false breakouts love to show up more often than you would hope. It’s really important to check for volume confirmation since these patterns don’t always play by the same rules across every timeframe.

Tired of missing opportunities and making suboptimal trading decisions? TrendSpider's cutting-edge platform automates complex technical analysis, saving you time and reducing human error.
With multi-timeframe analysis, dynamic alerts, backtesting, and customizable charting, you'll gain a competitive edge in identifying trends and making informed trades across global markets.

16 posts written
Unlock the power of candle patterns to decode market psychology and improve your trading precision....

Master the hammer candlestick pattern—a key indicator for market reversals. This beginner-friendly g...

Discover the bullish harami candlestick pattern—a key technical signal that can hint at trend revers...

Unlock the power of the bear flag pattern with our practical, step-by-step guide. Understand market...