


Technical Analysis
Master the Bear Flag Setup
Unlock the power of the bear flag pattern with our practical, step-by-step guide. Understand market...

The triple top pattern is a classic signal in technical analysis that usually hints at a possible shift from an uptrend to a downtrend. It features three peaks hitting roughly the same price level and shows a stubborn resistance the market can’t seem to crack. For traders, spotting this pattern early can be a game-changer and help them stay one step ahead and tweak their strategies before things turn south.
We will dive into how the triple top pattern shows up on charts and why it’s such a big deal for traders. We will share a straightforward and practical approach to spotting it reliably even when the market is throwing all kinds of noise and wild price swings your way.
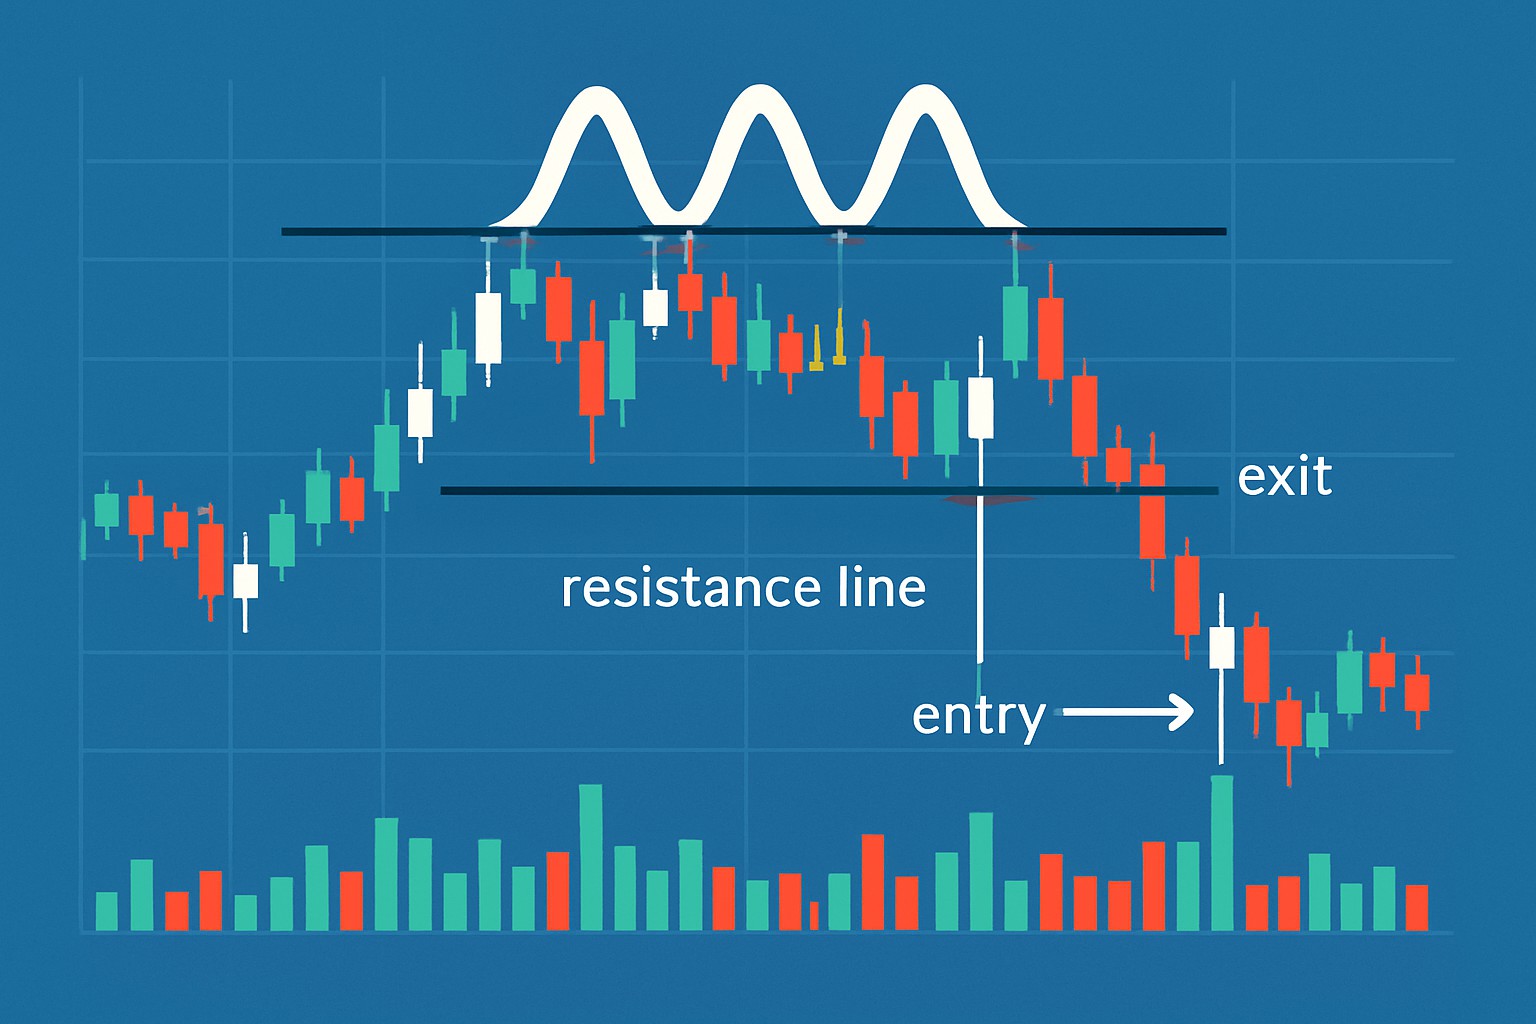
A triple top pattern often signals a bearish reversal following a lengthy uptrend. It occurs when the price makes three attempts to break through a resistance level but just can’t quite push past it, creating three nearly identical peaks. This pattern usually hints that buying pressure is running out of steam, while sellers are gearing up to call the shots.
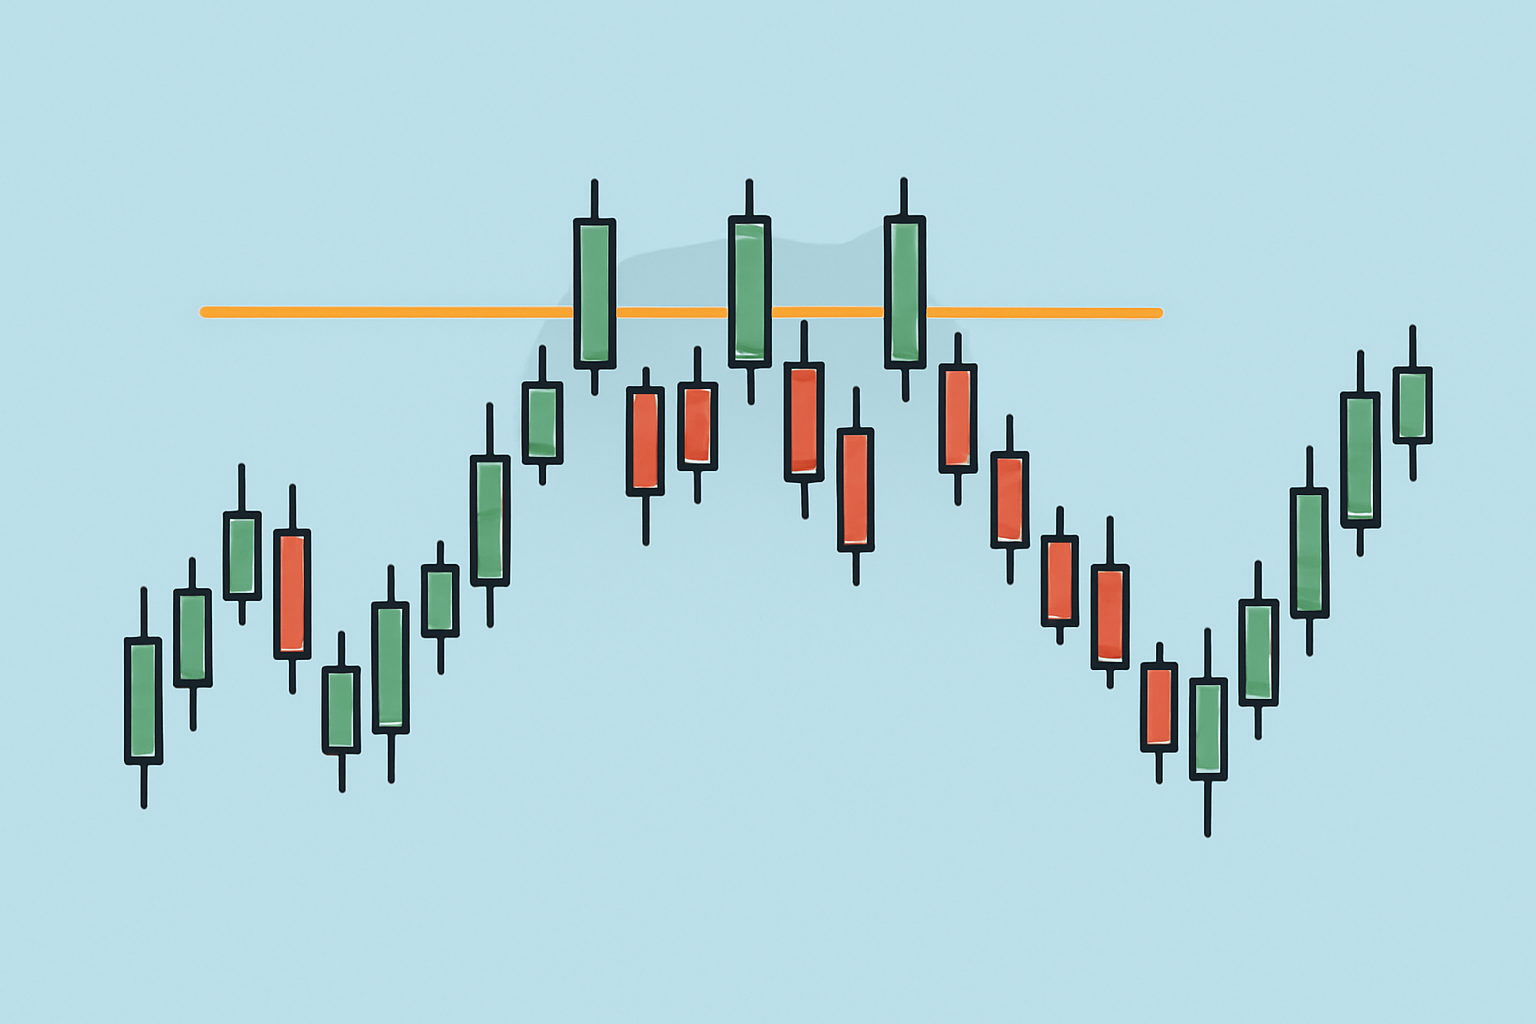
Illustration of a triple top pattern on a price chart with three peaks and a resistance line.
The triple top pattern is pretty important because it often signals a potential reversal after a long-standing uptrend. It’s like a flashing yellow light for traders, hinting that bullish momentum could be running out of steam. Grasping this concept is important when it comes to managing risk and figuring out the right moments to exit or jump into short positions.
Pattern recognition is like having a trader's secret map in your back pocket. Spotting formations such as the triple top doesn’t just help you keep up with the market—it lets you get a leg up, anticipating shifts before they smack you in the face. – Jane Doe, Technical Analyst
Take a close look at recent price data to identify any strong upward trend that usually appears before the pattern forms.
Find three distinct peaks around the same price level, spaced out enough so the market is pacing itself rather than sprinting.
Draw a horizontal resistance line across those peak tops to mark the price ceiling buyers cannot break through, no matter how hard they try.
Watch the volume during these peaks. It often decreases on the second and third peaks, suggesting that demand might be fading.
Ensure the time between peaks is neither too short nor too long. This pattern needs a reasonable time frame to be reliable.
Look for the price to drop below the support level created by the lows between peaks. This confirms the pattern and signals a potential sell-off ahead.
Each of these steps comes with subtle details that can really shift the way you interpret the data. For example, picking out true peaks from the smaller pullbacks and keeping an eye on volume trends often saves you from chasing false signals—that’s a headache you want to skip.
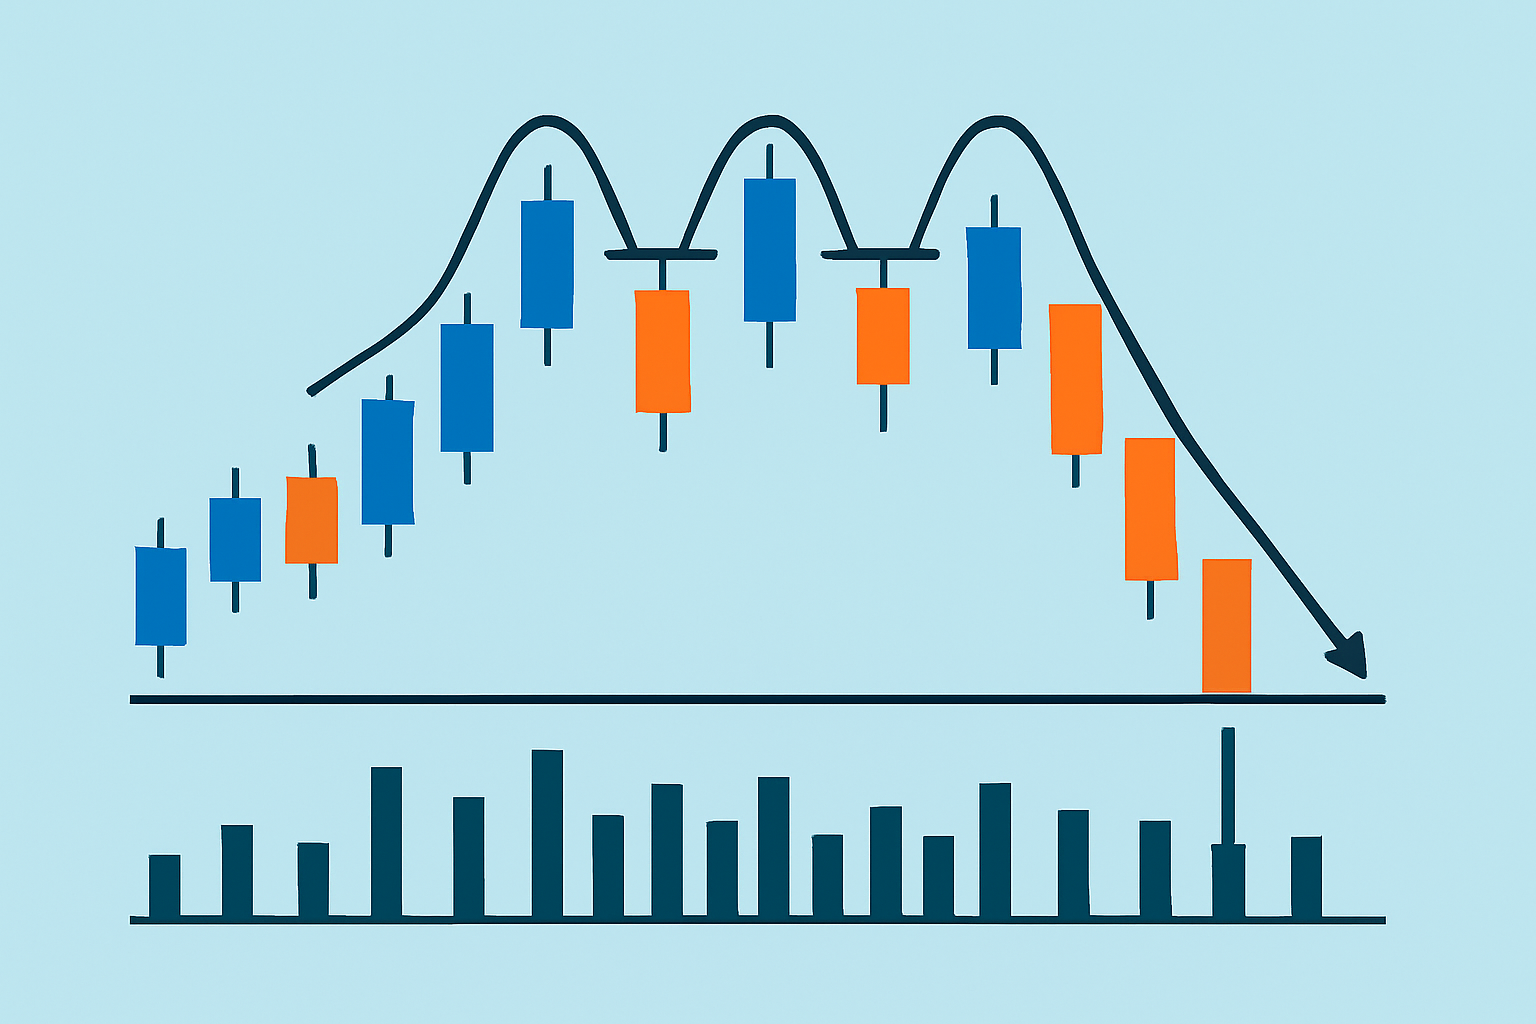
Annotated chart showing detailed steps to identify a triple top pattern including peaks, resistance line, volume decrease, and breakdown point.
Knowing these common mistakes can really set you on the path to a sharper and more disciplined approach. Dodging these usual pitfalls often leads to more accurate chart reading and tends to boost your confidence in trading decisions.
When it comes to spotting triple top patterns quickly it is a real lifesaver to lean on advanced charting tools like TradingView or TrendSpider. TradingView packs a punch with its wide array of technical indicators and drawing tools that make nailing down resistance lines and peaks a breeze. Plus it doubles as a social hub where traders swap their insights on these patterns which can be eye-opening. TrendSpider takes a different route by offering automated pattern recognition that does the heavy lifting for you. This handy feature saves time and helps cut down on manual errors. Many platforms come with alert systems to flag important price levels or pattern formations so you’re not left in the dark when it counts.
Wait for volume confirmation by keeping an eye on declining volume at the peaks, followed by a sudden volume spike when the breakdown finally hits—it's like the market’s way of giving you a nudge.
Stay sharp with price action and watch closely for a clear break below the support level formed by the lows nestled between the peaks.
Once the breakdown is confirmed, place a stop-loss just above the resistance or the most recent peak—think of it as your safety net against any sneaky reversals.
Set your price targets by measuring the distance between resistance and support, then project that same distance downward from the breakdown point—kind of like using a ruler where the market is your paper.
Keep managing risk like a pro: size your positions carefully and be ready to tweak your stop-loss as the trade unfolds, because markets have a way of keeping us on our toes.
Confirming the triple top pattern through both volume and price action is a solid way to steer clear of false signals that can trip you up. By setting clear entry and exit points based on the pattern, you position yourself to capitalize on potential downtrends while keeping your risk nicely in check.
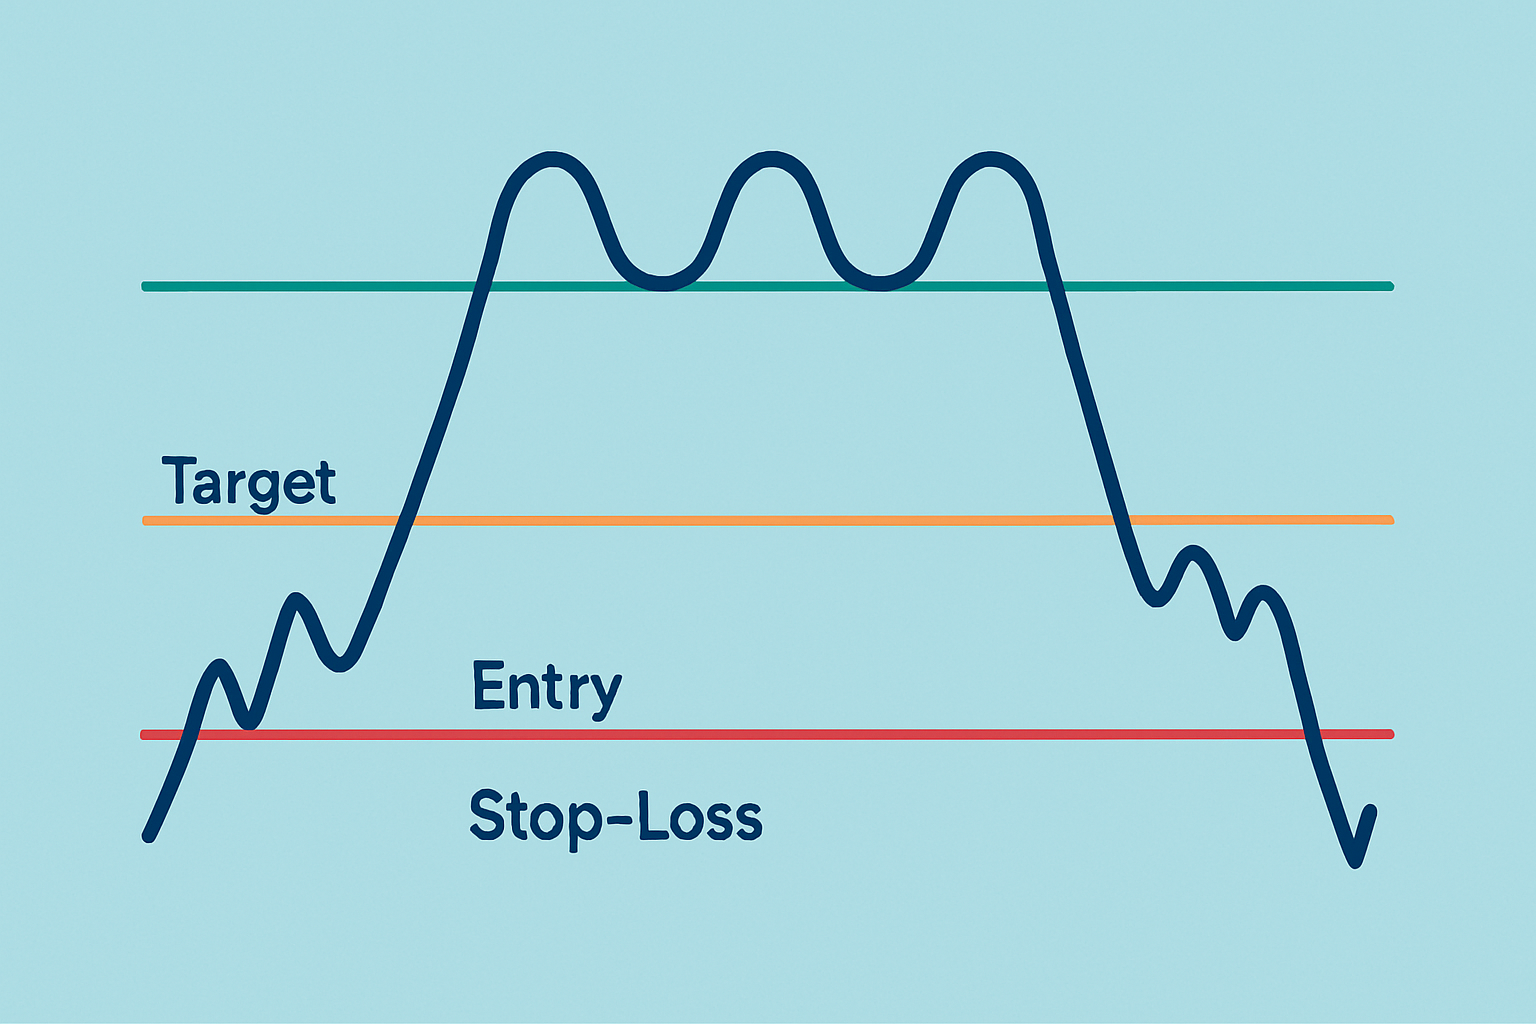
Chart highlighting triple top pattern with annotations for entry point, stop-loss placement, and profit target.

Are you tired of juggling multiple tools for your trading needs? TradingView is the all-in-one platform that streamlines your analysis and decision-making.
With its powerful charting capabilities, real-time data, and vibrant community, TradingView empowers traders like you to stay ahead of the market. Join thousands who trust TradingView for their trading success.

20 posts written
Unlock the power of the bear flag pattern with our practical, step-by-step guide. Understand market...

Discover what IOUs mean in finance, their role as informal debt acknowledgments, and how understandi...

Master the hammer candlestick pattern—a key indicator for market reversals. This beginner-friendly g...

Discover the bullish harami candlestick pattern—a key technical signal that can hint at trend revers...