


Technical Analysis
Profiting from Head and Shoulders Patterns in Any Market
Unlock the power of the head and shoulders pattern with this complete guide. Learn to spot, trade, a...

Momentum shifts in trading, often identified using tools like the relative vigor index, signal those key moments when an asset's price movement takes a turn—either changing direction or picking up speed. Spotting these shifts early on can really give traders a leg up, allowing them to jump in or cash out at just the right time. Grabbing these changes sooner rather than later helps keep losses at bay and lets you ride fresh trends.
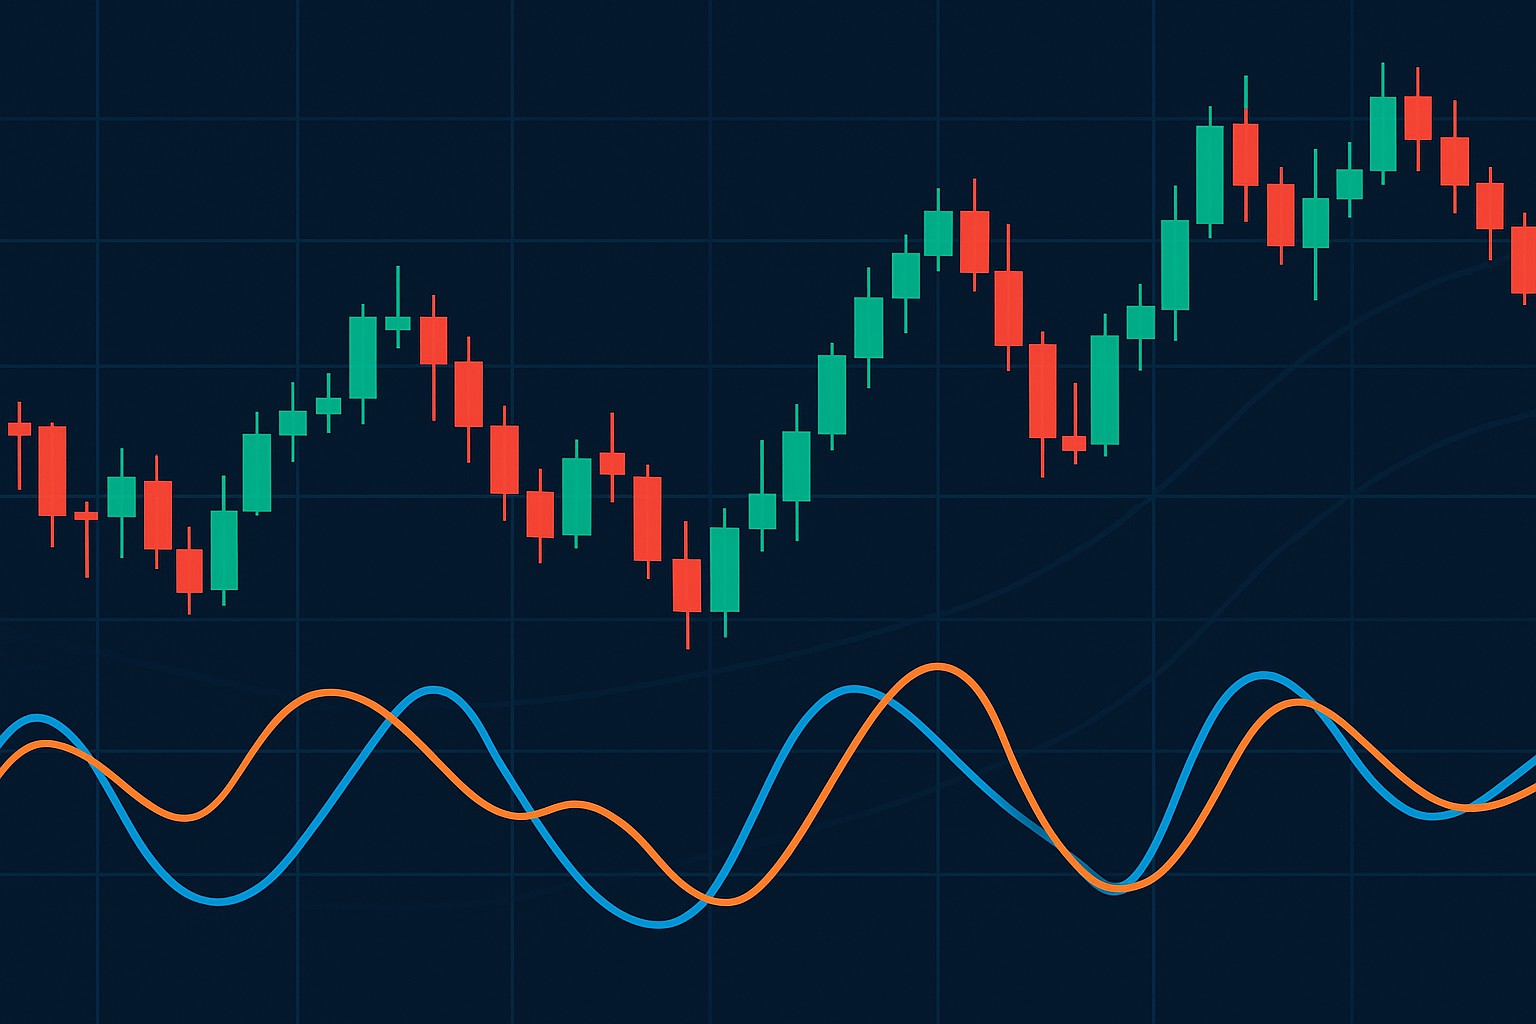
The Relative Vigor Index (RVI) is a momentum oscillator that measures the strength behind price movements by comparing closing prices to the overall trading range. It is a way to get a read on how strong a trend really is, while also giving heads-up signals on potential reversals as it dances around the zero line.
The Relative Vigor Index measures momentum by comparing an asset's closing price to its trading range over about 10 days. After that it smooths this ratio with a weighted moving average to make the data less jumpy.
Unlike typical indicators like the Relative Strength Index or Moving Average Convergence Divergence, the RVI takes a different route by focusing on how strong price closes are within the daily range rather than just fixating on price changes or averages.
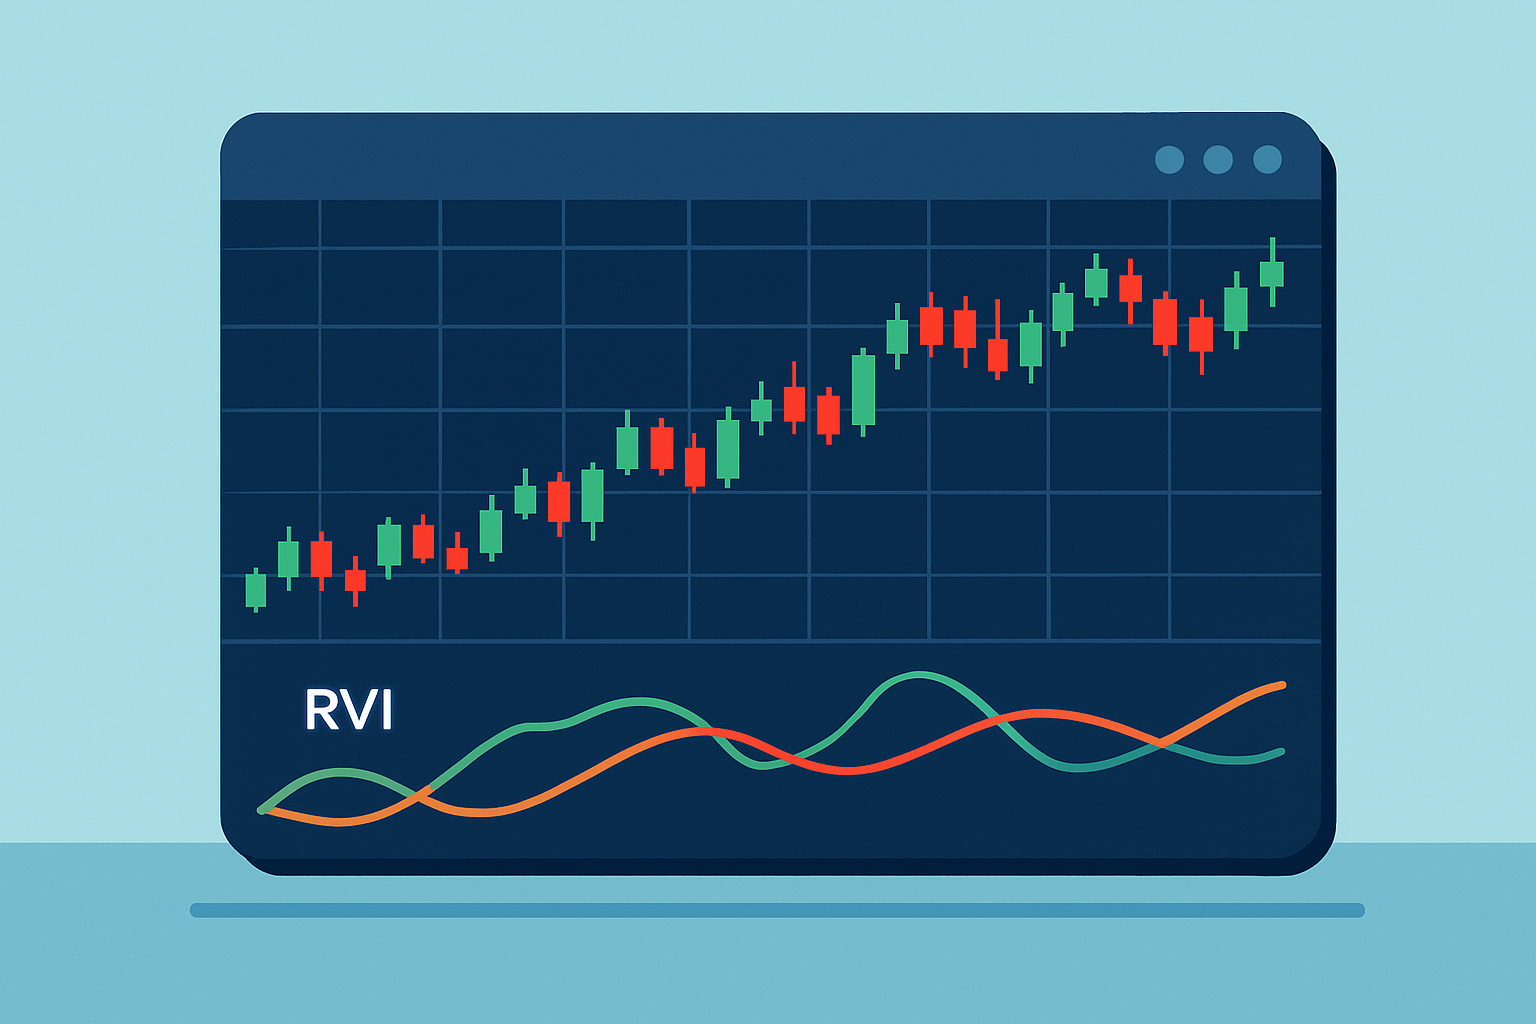
Chart displaying the Relative Vigor Index (RVI) alongside price action and signal line for momentum analysis
There's something almost magical about catching the exact moment when momentum shifts in trading. It’s like riding a wave just as it starts to break—if you time it right, you’re in for a smooth, exhilarating ride. Of course, spotting these shifts isn’t always a walk in the park; it takes a keen eye and a bit of experience. Still, mastering this skill can truly turn the tides in your favor, helping you to surf through the markets instead of getting wiped out by sudden changes. In my experience, understanding momentum shifts adds a whole new layer to trading strategy that’s hard to beat.
Momentum shifts reveal that the balance of power in the market has swung between buyers and sellers. Catching these changes early on can give traders a leg up in forecasting whether a trend is about to flip or march stubbornly onward.
Calculate the Relative Vigor Index using common settings like a 10-period smoothing and a 4-period signal line to keep a finger on the pulse of momentum.
Watch for the RVI line crossing above or below zero or its signal line because this often suggests momentum might be shifting.
Look for divergences by comparing price highs and lows with those of the RVI. These subtle mismatches can be early warnings about trend reversals nearby.
Always double-check RVI signals with volume indicators or other momentum oscillators. Think of this as getting a second opinion to avoid false alarms.
Use these insights to choose your entry and exit points, matching your trades with momentum shifts for sharper timing.
Choosing the right parameters for the RVI really makes all the difference. Shorter periods tend to make the indicator jump on sudden momentum shifts faster but be warned—they can also throw out more false alarms that day traders and scalpers tend to live with. On the flip side, longer periods help cut through market noise and deliver clearer signals that swing and position traders usually appreciate.
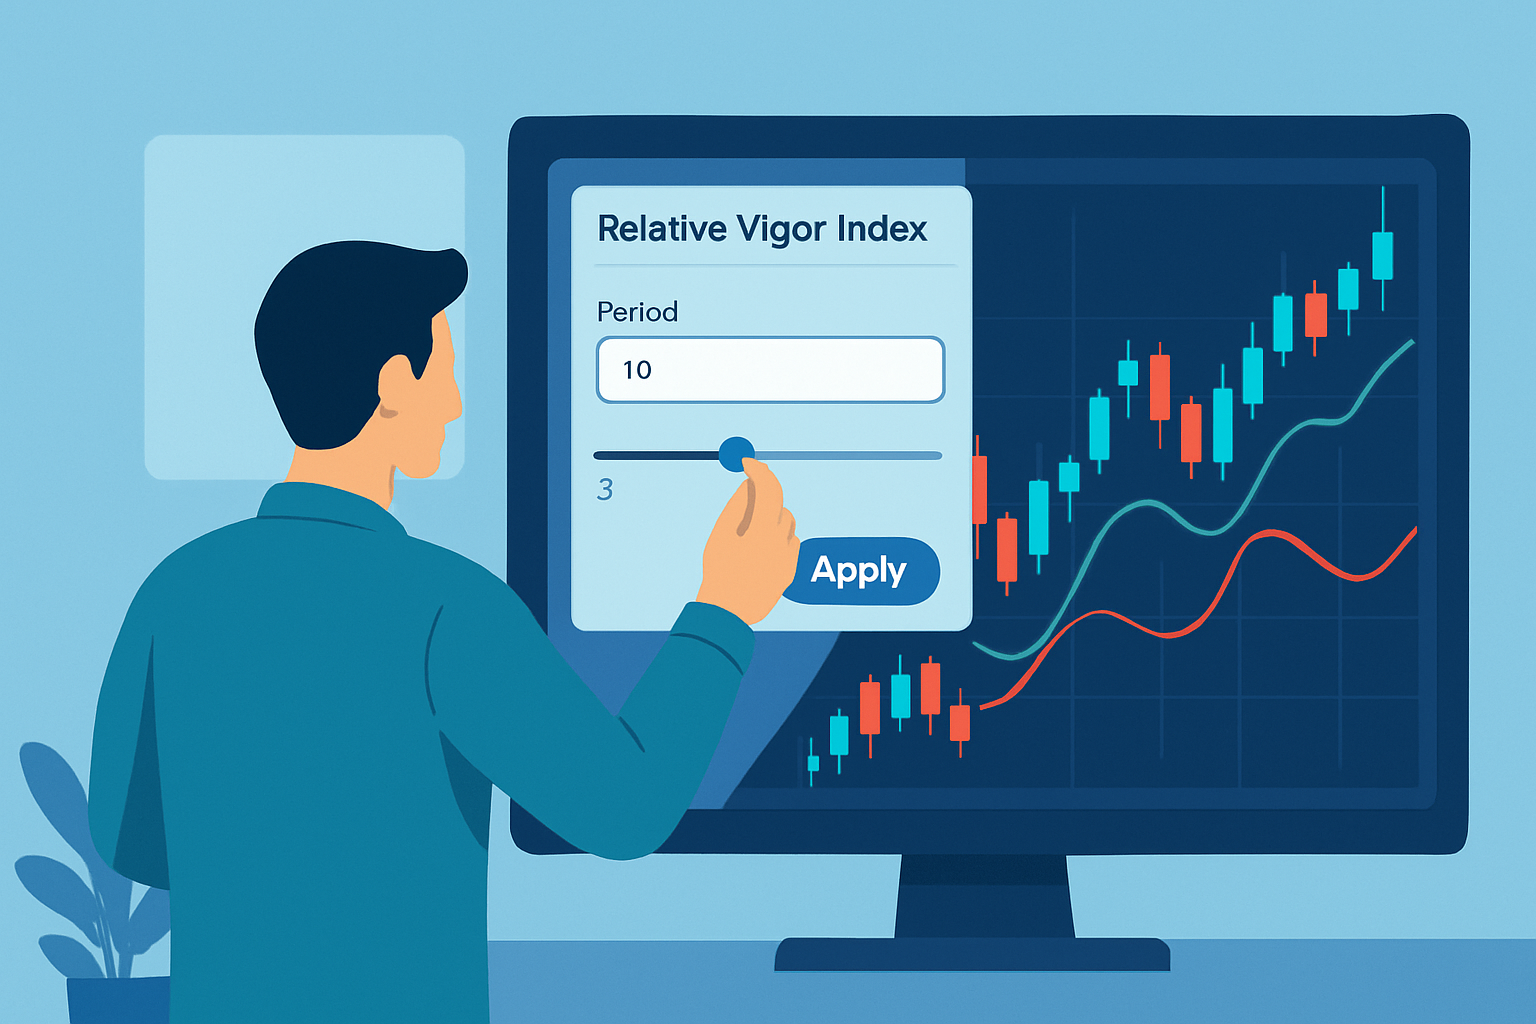
Setting and adjusting Relative Vigor Index parameters on a trading platform for customized momentum analysis
RVI signals usually behave themselves and show reliable signs. But every now and then they can lag behind or throw out false positives especially when the market is moving sideways in a choppy way.
Taking a closer look at real chart examples really helps traders get a feel for how the RVI mirrors momentum shifts. For instance, when the RVI crosses above the signal line it is often a sign that bullish momentum is kicking in and a new upward trend is gaining steam.
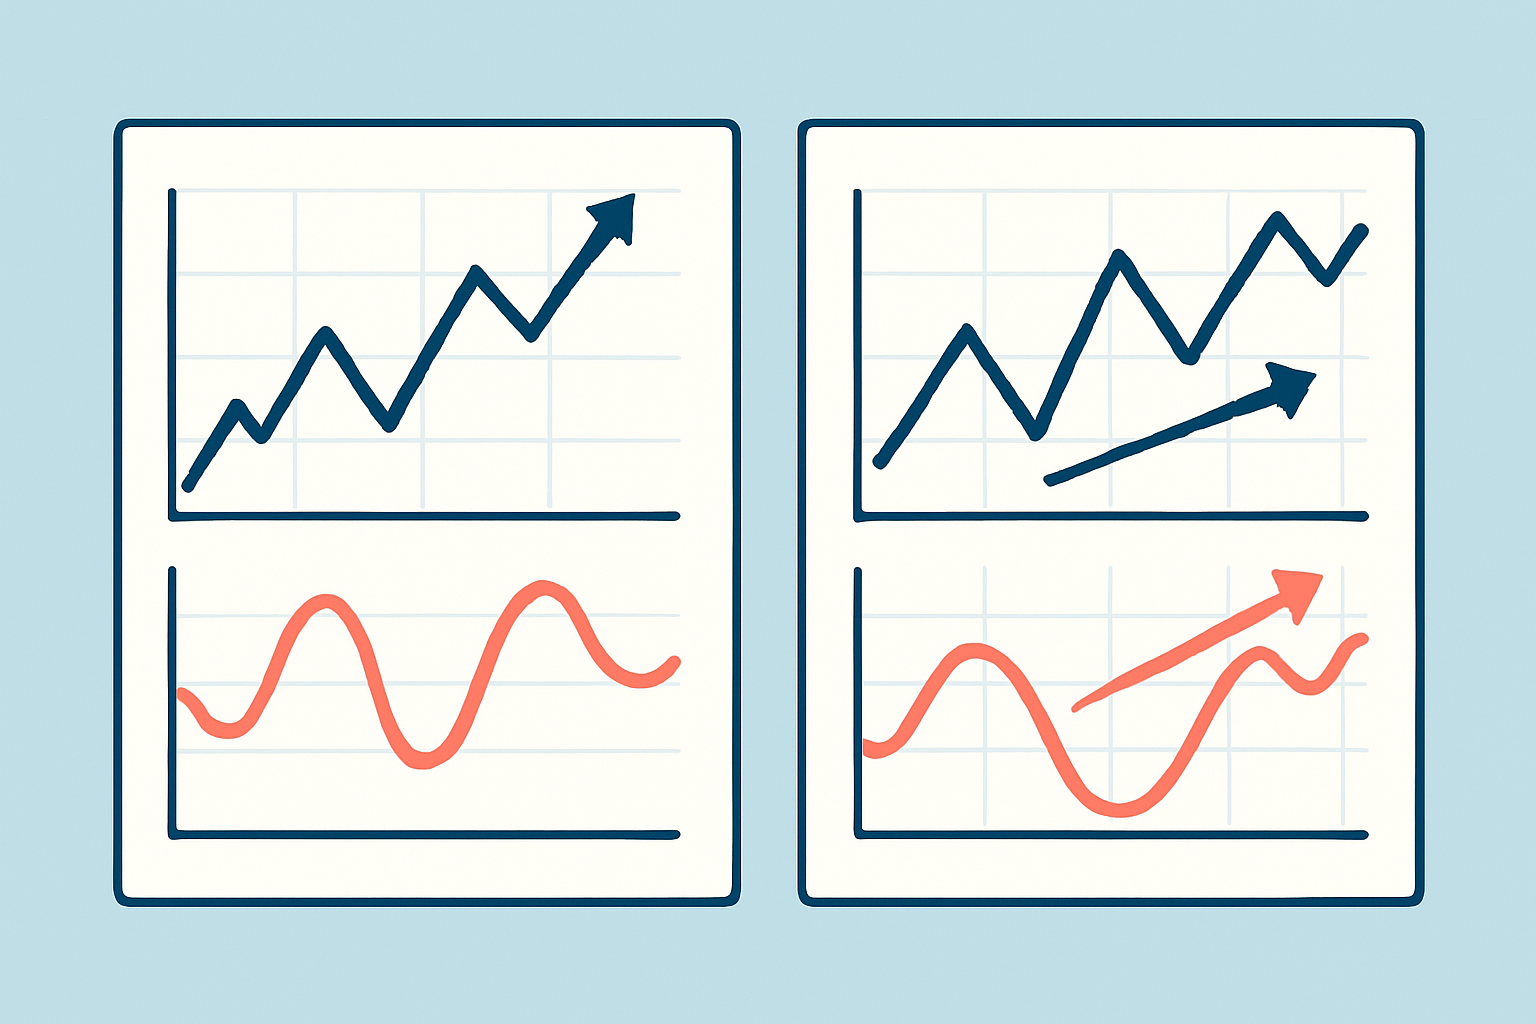
Side-by-side charts illustrating momentum shifts detected by the Relative Vigor Index with annotations
Using the RVI alongside other technical indicators like RSI, MACD or volume-based tools usually gives momentum signals more muscle. This layered approach tends to weed out false positives and adds weight to trade setups by confirming momentum shifts from different angles.
When combining indicators, it’s wise to steer clear of overlap by picking tools that offer different types of signals. When the signals don’t see eye to eye, it’s a red flag that calls for some extra caution—this really drives home why having a clear trading plan and consistent rules for interpreting them is so vital.
Discipline truly is the unsung hero when trading momentum shifts with the Relative Vigor Index. Keeping your emotions on a short leash can save you from chasing phantom signals or jumping ship too soon.

Are you tired of juggling multiple tools for your trading needs? TradingView is the all-in-one platform that streamlines your analysis and decision-making.
With its powerful charting capabilities, real-time data, and vibrant community, TradingView empowers traders like you to stay ahead of the market. Join thousands who trust TradingView for their trading success.

11 posts written
Unlock the power of the head and shoulders pattern with this complete guide. Learn to spot, trade, a...

Discover what IOUs mean in finance, their role as informal debt acknowledgments, and how understandi...

Master the hammer candlestick pattern—a key indicator for market reversals. This beginner-friendly g...

Unlock the power of the bear flag pattern with our practical, step-by-step guide. Understand market...