


Technical Analysis
Most Important Candle Patterns Every Trader Should Know
Unlock the power of candle patterns to decode market psychology and improve your trading precision....

The bear flag trading pattern is a popular go-to among swing traders looking to ride the wave of sharp price drops. Catching this pattern early on lets traders jump in during brief pauses in the downtrend, often boosting profits while keeping risk reasonably in check
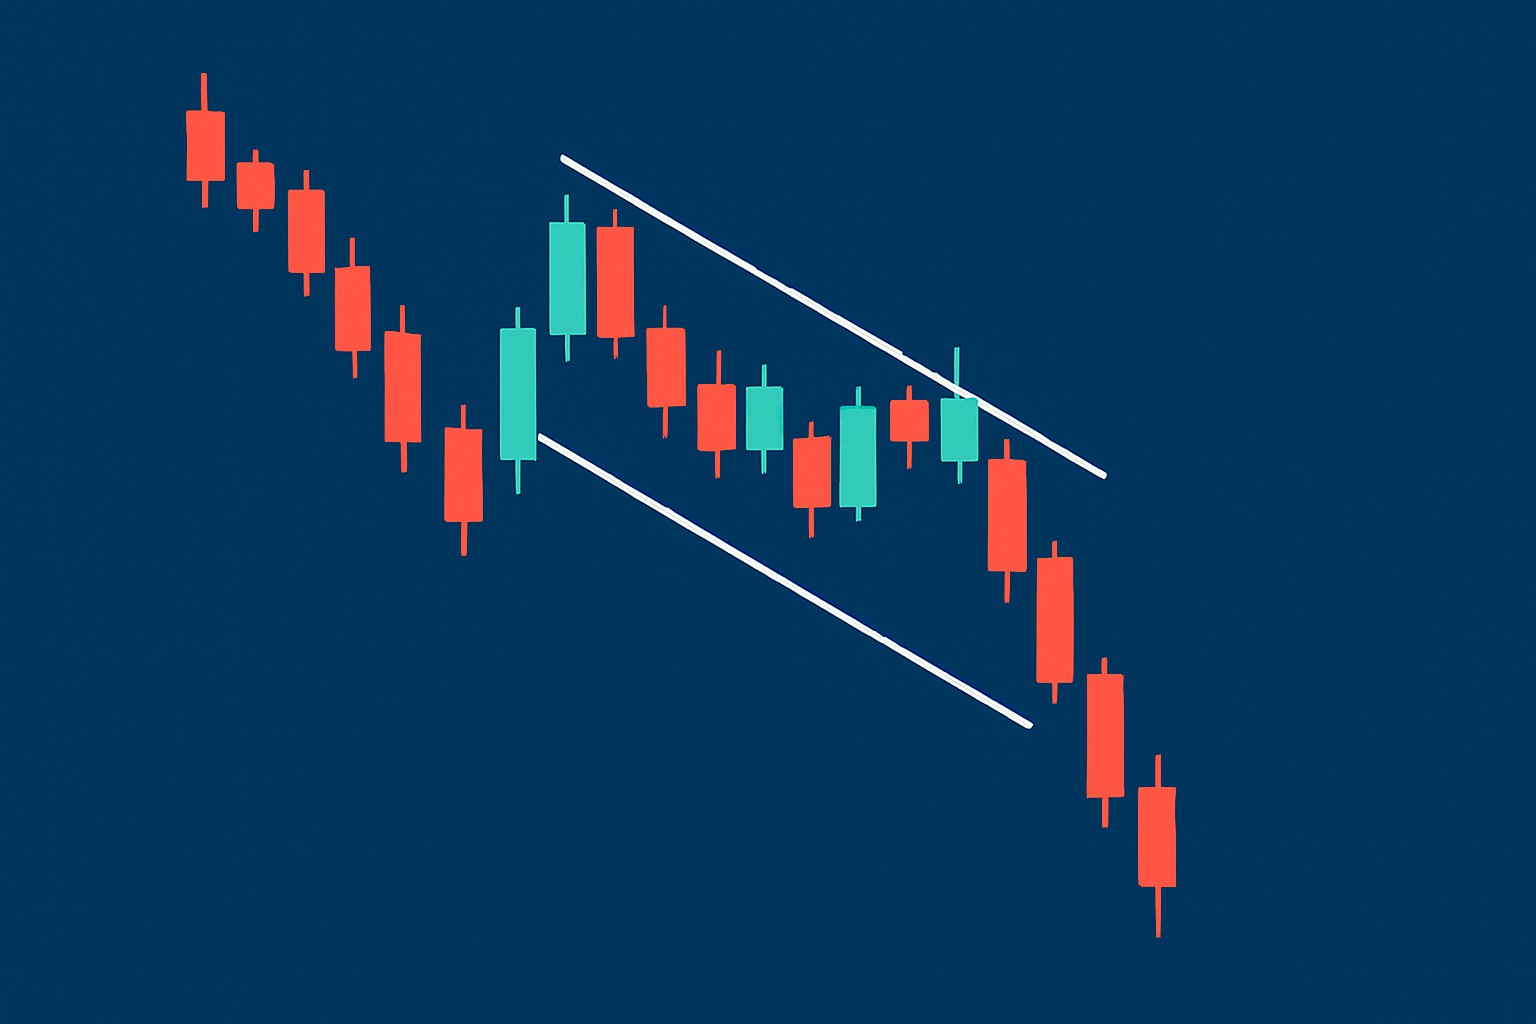
The bear flag trading pattern is a classic bearish continuation signal that often marks a brief breather before the downtrend kicks back into gear. It shows up right after a sharp price drop called the flagpole. Then things settle into a short consolidation phase. This pause usually takes shape as a small upward or sideways channel called the flag. During this lull buyers try to push the price higher but the lower volume hints they’re just treading water.
An example chart illustrating a classic bear flag pattern with the flagpole, consolidation flag, and breakdown breakout.
On real charts you’ll spot the flagpole as a sharp drop usually sparked by heavy selling pressure. Then the flag takes shape when the price tries to bounce back but can’t find much steam—something you can tell from the softer volume.
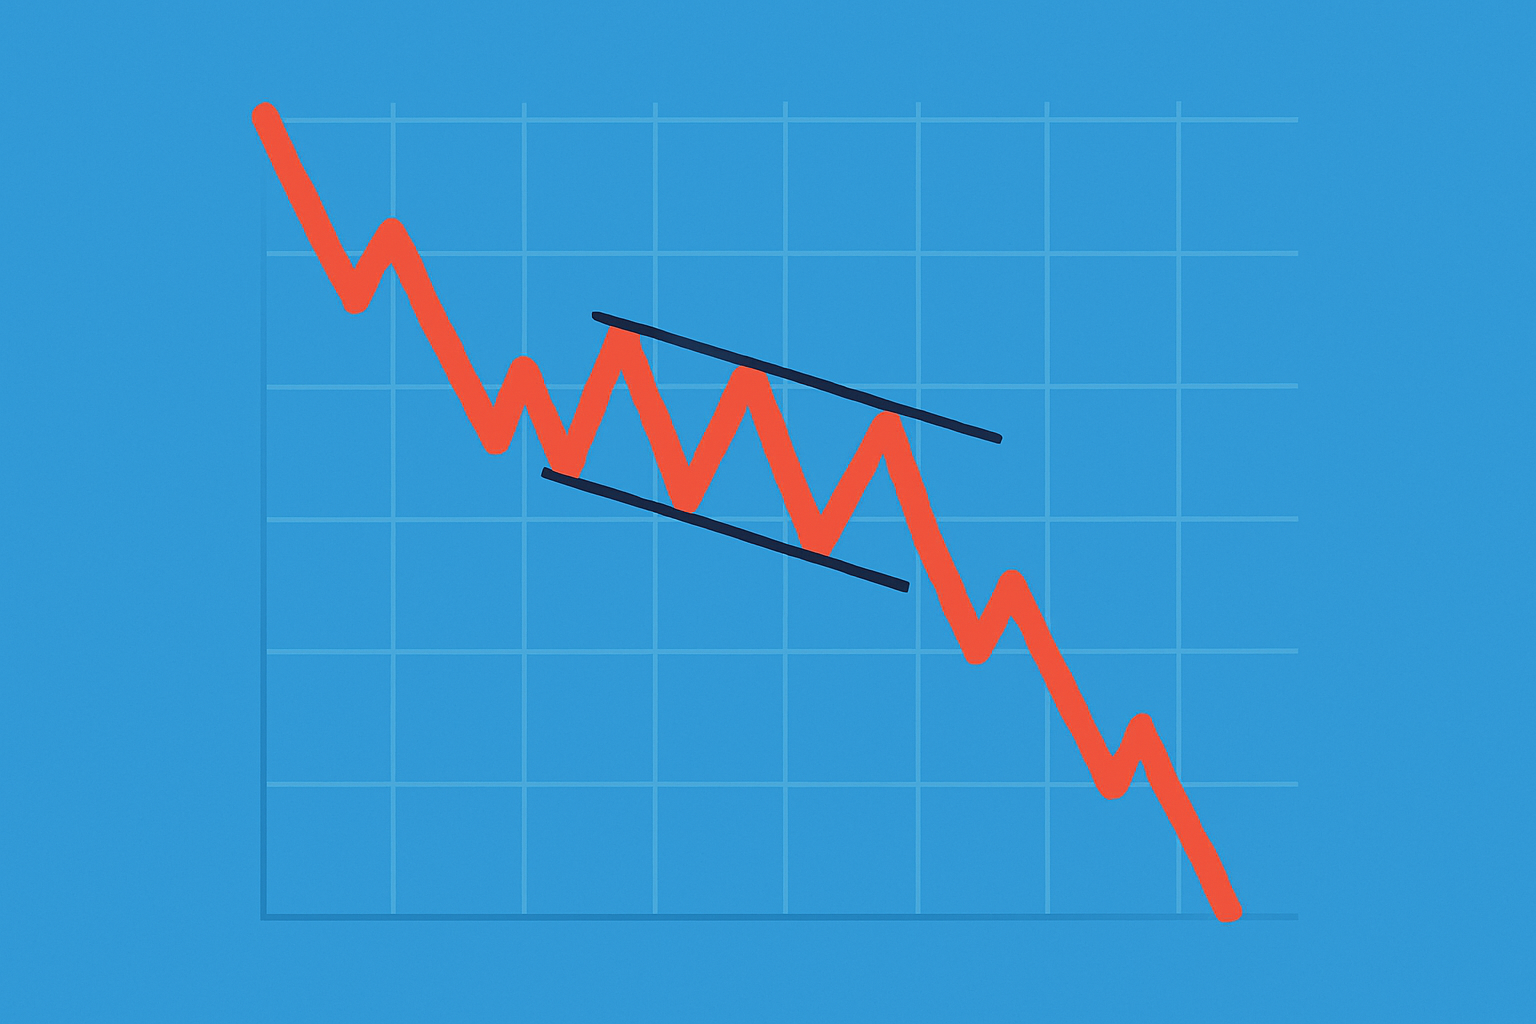
Spot an initial sharp drop in price called the flagpole. It is like the dramatic opening act that grabs your attention.
Watch for a consolidation phase where the price drifts slightly up or sideways and carves out a narrow channel called the flag. Think of it as the calm before the storm.
Keep an eye on the volume during the flag stage because it usually tapers off and suggests the buying pressure is losing steam.
Be ready for a breakout when the price slips below the flag's lower boundary. Ideally, this is accompanied by a surge in volume. This is when things usually get interesting.
Finally, confirm the breakout with solid price momentum and a noticeable jump in volume to make sure the bear flag pattern isn’t playing tricks on you.
Every step requires a good dose of patience and careful attention. It’s tempting to jump the gun before a breakout is fully confirmed, but resist that urge. Also, keep an eye on volume trends to steer clear of false signals.
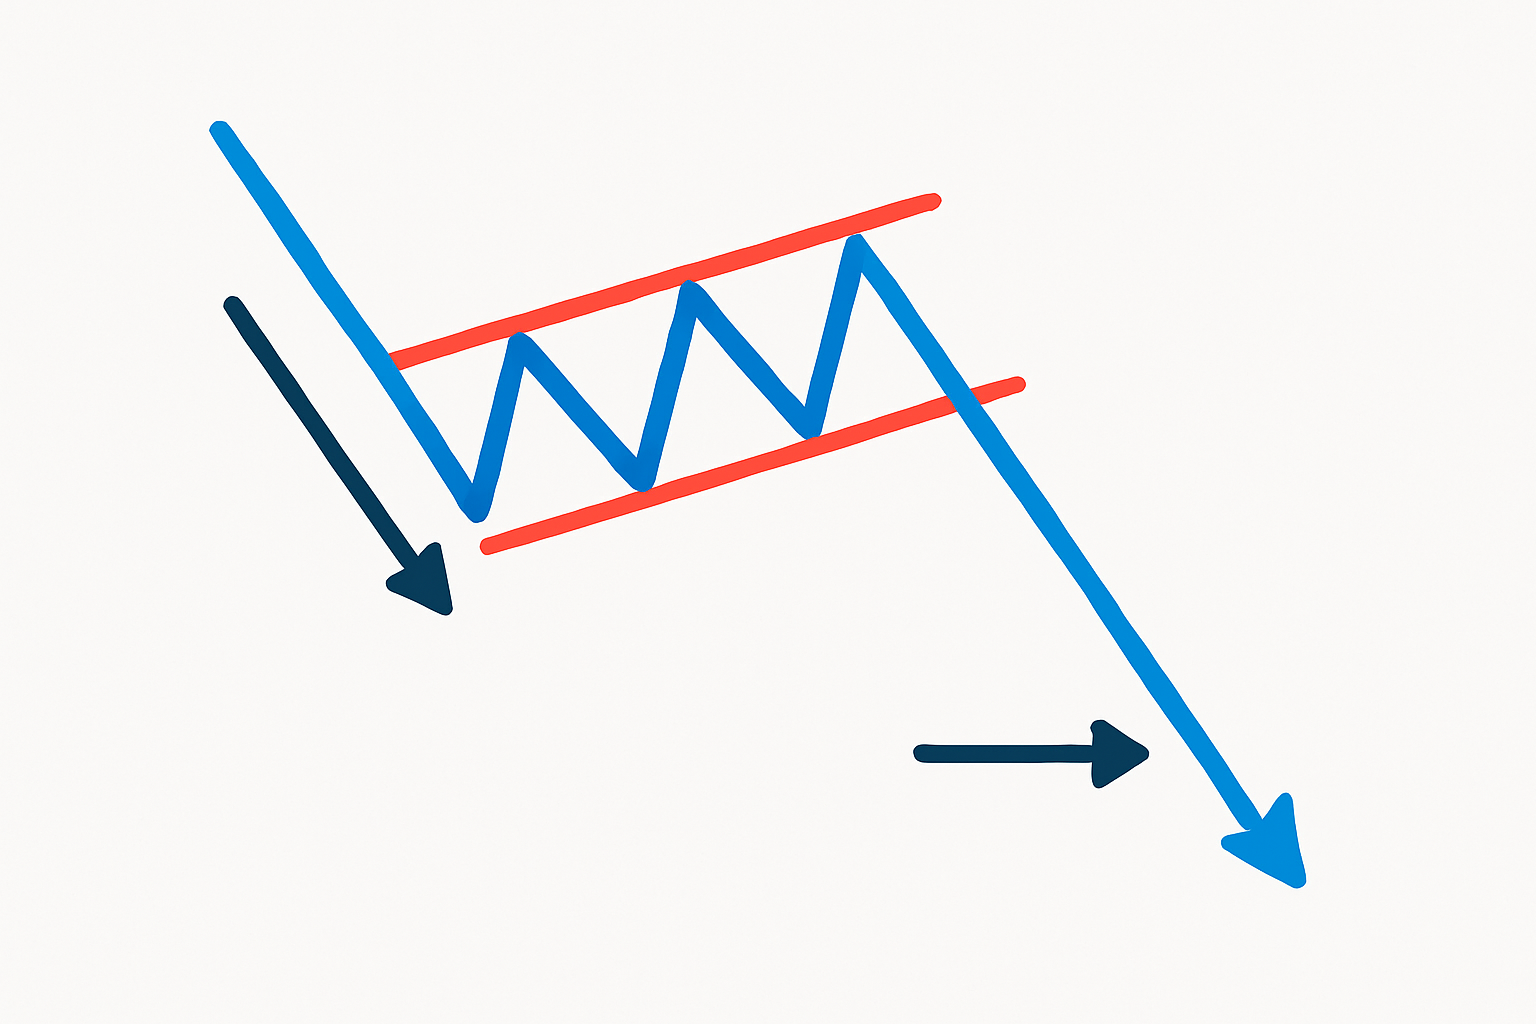
Illustration breaking down each step of identifying a bear flag pattern on a price chart.
Using these tools hand-in-hand with price action usually gives you a nicer edge in spotting bear flags more accurately. For example, checking volume trends alongside trendlines can help confirm that the consolidation isn’t just smoke and mirrors. The RSI often throws up early signs of momentum shifts.
To nail trading the bear flag it’s best to hold your horses until you see a clear breakout below the flag’s support. Preferably one backed by strong volume—no flimsy signals here. When you jump in with short positions, set your stop-loss just above the flag’s upper edge to keep risk in check. Then let the flagpole’s length be your trusty guide for picking a reasonable profit target.
Open a short position when the price dips below the flag consolidation area, ideally on a spike in volume that really backs the move.
Set a stop-loss order just above the flag’s upper edge or the most recent swing high—this little guardrail helps you dodge those pesky false breakouts that like to trick traders.
Figure out your profit target by measuring the height of the flagpole and then projecting that same distance down from where the price breaks out—think of it as your trading compass.
Manage your position size with care, tweaking your risk to fit snugly within your overall trading plan—because nobody wants to be caught off-guard.
Managing risk is absolutely key when trading bear flags. It’s really about staying disciplined and honoring your stop-loss and profit targets without letting emotions sneak in and mess things up. No pattern guarantees a win so it pays off to size your positions carefully and stick to a solid tried-and-true plan to keep your capital safe.
You can dodge these common slip-ups by double-checking the volume data and holding tight for clear breakout signals. Stick to disciplined stop-loss rules like your trading life depends on it. Relying on trustworthy charting platforms such as TrendSpider—which offers automatic pattern recognition and volume analysis—goes a long way in cutting down on pesky human errors.
Think back to a recent chart of a major stock where a sudden sell-off whipped up a sharp flagpole and was followed by about a week of mild consolidation that shaped the classic bear flag trading pattern. Traders who patiently hung tight waiting for the price to break below this quiet zone—ideally confirmed by a bump in volume—jumped into short trades that rode the next steep drop and nabbed quick, significant gains.

Tired of missing opportunities and making suboptimal trading decisions? TrendSpider's cutting-edge platform automates complex technical analysis, saving you time and reducing human error.
With multi-timeframe analysis, dynamic alerts, backtesting, and customizable charting, you'll gain a competitive edge in identifying trends and making informed trades across global markets.

23 posts written
Unlock the power of candle patterns to decode market psychology and improve your trading precision....

Discover how central banks' hawkish and dovish stances shape financial markets and affect your inves...

El Salvador's adoption of Bitcoin as legal tender marks a groundbreaking experiment in national curr...

Unlock the power of the head and shoulders pattern with this complete guide. Learn to spot, trade, a...