


Technical Analysis
What is a Harami Pattern? Breaking It Down
Learn how the harami candlestick pattern signals potential market reversals. This guide breaks down...

Candlestick charts are a cornerstone of technical analysis and the inverted hammer candlestick pattern often pops up as an important signal. Catching this pattern early can give traders a leg up and help them anticipate potential trend reversals and make wiser trading decisions.
An inverted hammer is a single candlestick pattern that sports a small real body nestled near the bottom of the price range, paired with a long upper shadow and hardly any lower shadow to speak of. You will typically spot it popping up after a downtrend, hinting at a possible bullish reversal.
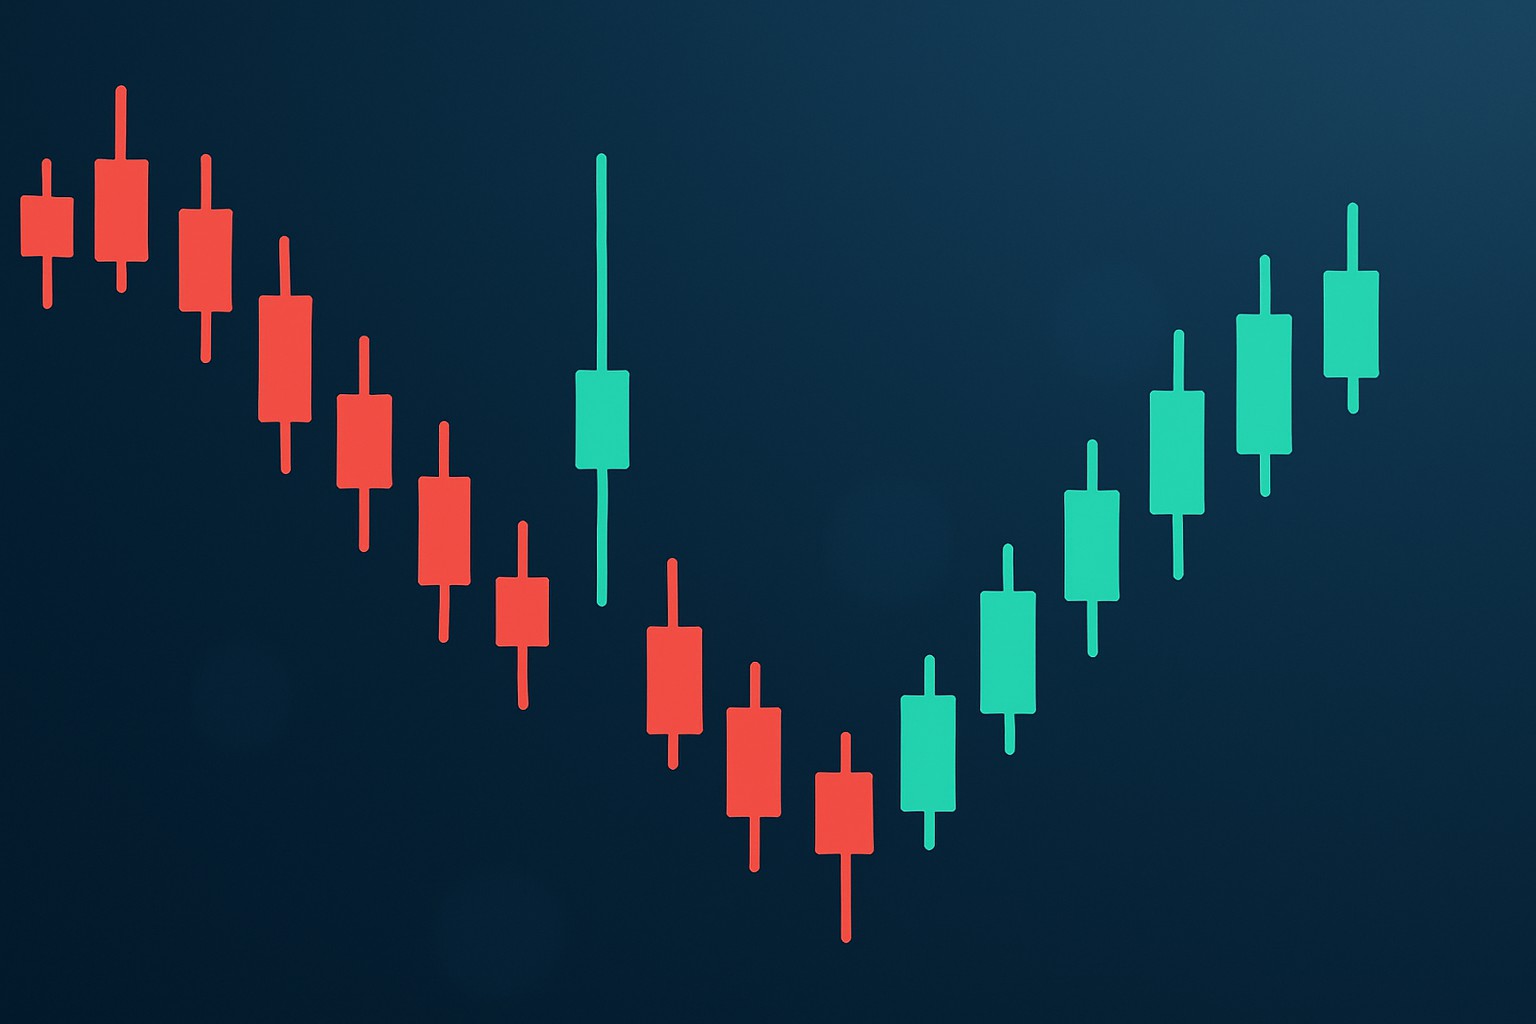
The inverted hammer often shows up with a long upper wick and a tiny real body tucked near the bottom.
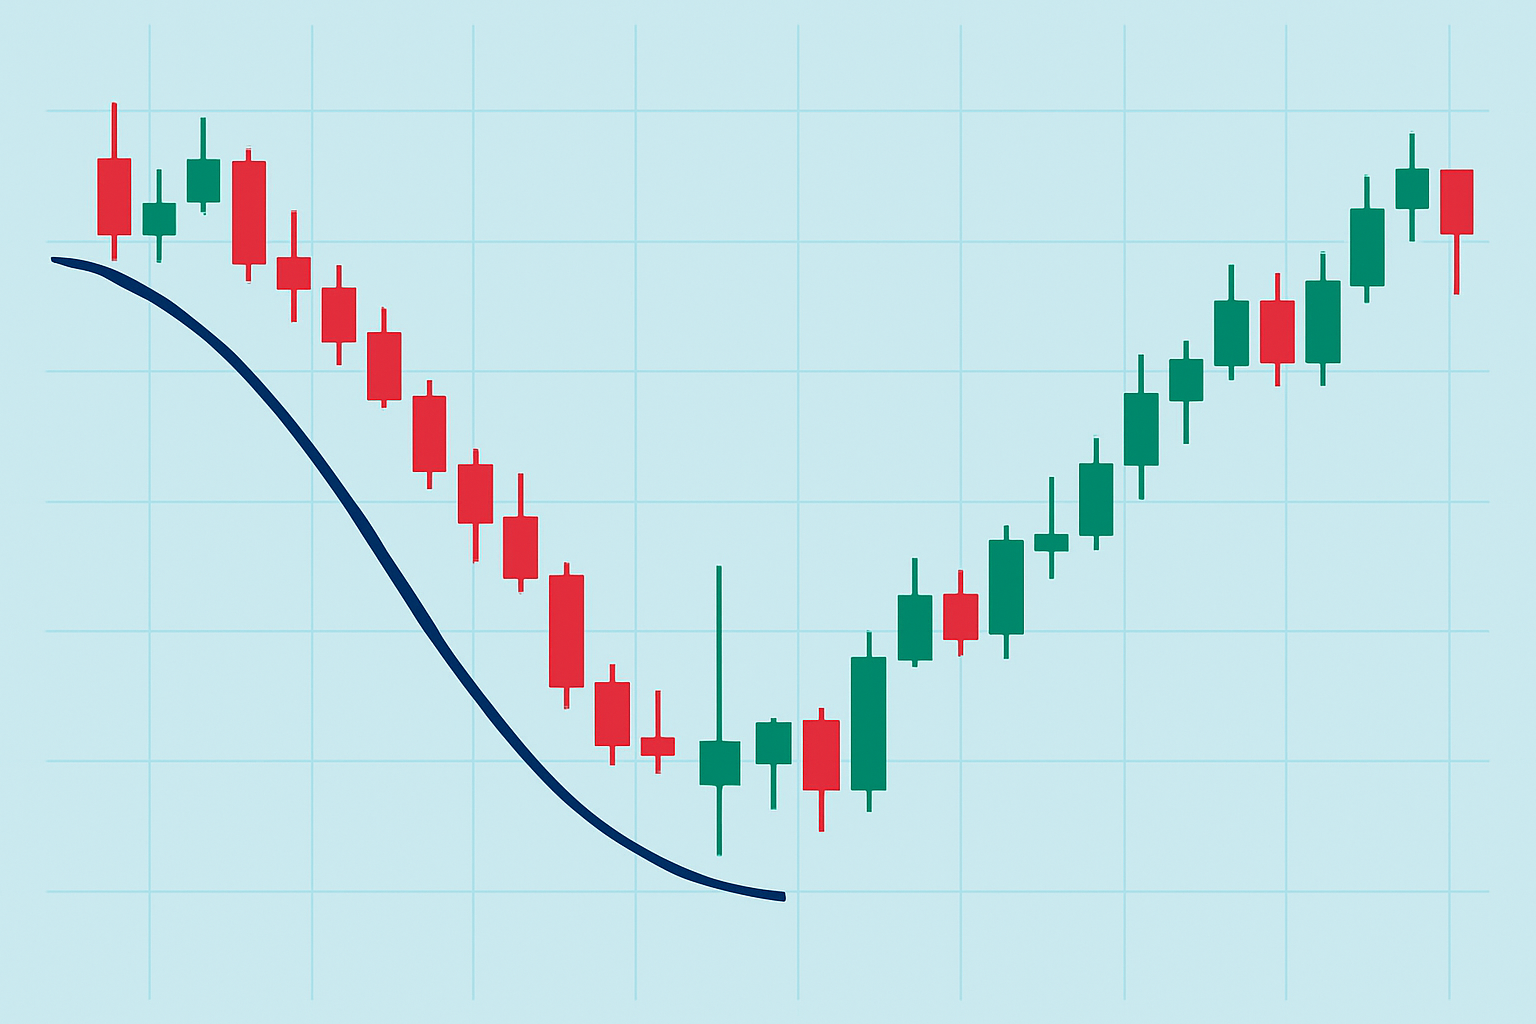
Illustration of an inverted hammer candlestick showing its defining long upper shadow and small real body at the bottom of a downtrend.
| Candle Part | Description | Relation to Inverted Hammer |
|---|---|---|
| Open Price | The price where trading kicks off for the candlestick period | Usually sits near the bottom of the candle’s range, hanging close to the closing price |
| Close Price | The price where trading wraps up for the candlestick period | Tends to be tucked near the open, creating a small real body that shows a bit of hesitation |
| High Price | The highest price reached during the period | Stretches well above both open and close, forming a long upper shadow that grabs your attention |
| Low Price | The lowest price reached during the period | Often matches or comes close to the open and close, with hardly any lower shadow to speak of |
| Body Size | The gap between open and close prices | Small, hinting at indecision or barely any net change — like the market couldn’t quite make up its mind |
| Wick Size | The length of the upper and lower shadows | A long upper wick, usually at least twice as tall as the body, paired with a very short or missing lower wick |
Spotting the inverted hammer calls for a keen eye on the candlestick's shape and importantly where it pops up in a downtrend. You have to zero in on the shadows and the body’s size and its place right after a price drop.
Look out for a small real body hanging around the lower end of the price range. It’s a subtle hint that prices didn’t wander much during that stretch.
Keep an eye out for a long upper shadow that is at least twice as long as the real body because this signals a clear rejection of higher prices.
Make sure the lower shadow is barely there or completely missing as this detail helps nail down the pattern.
Check the color of the real body as it might be bullish or bearish. However, the bigger picture usually matters more than the color.
Lastly, verify that the inverted hammer appears after a solid downtrend since it’s often a sign that market sentiment could be shifting, fingers crossed.
The inverted hammer hints at a possible shift in control from sellers to buyers after a downtrend. It’s like buyers are stepping up and trying to nudge prices higher even though sellers initially hold the line. That long upper wick is a classic sign of price rejection at higher levels and offers a glimmer of hope for a reversal.
The inverted hammer often flashes a quick spark of bullish hope right after a heavy sell-off, hinting at a possible turnaround. Still, it’s wise to keep your guard up since the rally might fizzle out before it really gathers steam.
A solid thumbs-up is usually a strong bullish candle following the pattern and ideally backed by rising volume. Without that confirmation, the inverted hammer tends to signal uncertainty or a quick breather in the downtrend, nothing more.
After spotting an inverted hammer traders tend to look for confirmation before jumping in to make their entries more reliable. This usually involves watching for higher volume or a follow-up bullish candle and leaning on other indicators or price levels to feel confident about the potential reversal signal.
Hang tight for a bullish candle to appear right after the inverted hammer. It’s like the market’s way of nodding yes to buyer strength and suggesting that a trend reversal might be just around the corner.
Keep an eye out for a rise in trading volume during or shortly after this confirming candle because it adds much-needed weight to the pattern’s reliability.
Use nearby support or resistance levels to boost your confidence when making trade calls and to clearly define entry and exit points.
Check signals from oscillators like RSI or MACD as they can give you a better sense of momentum and help you avoid those pesky false alarms.
Place your stop-loss orders just below the inverted hammer’s low. Think of it as your safety net in case the reversal doesn’t happen as expected.
Picture a well-known tech stock that’s been sliding downhill for several days straight. Then suddenly an inverted hammer shows up on the daily chart followed by a bullish candle with a nice boost in volume. Traders using platforms like TradingView often catch this pattern early and jump into long positions just before a significant rally kicks off.
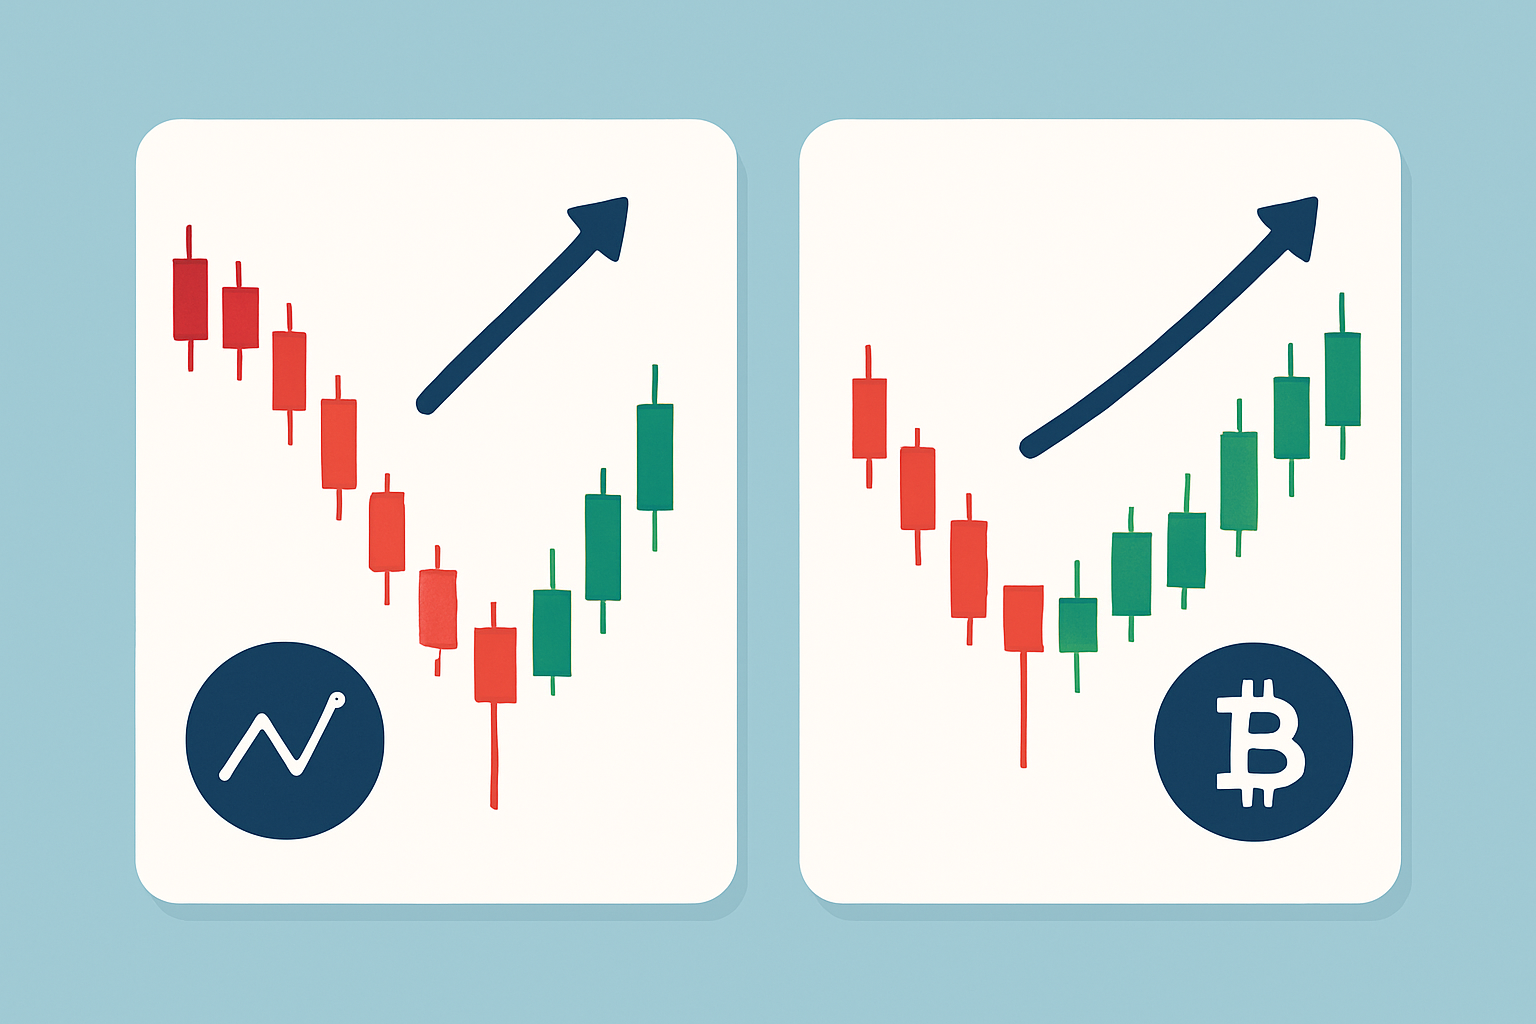
Example charts from stock and crypto markets showing the inverted hammer pattern followed by confirmation candles signaling reversal.
The inverted hammer candlestick can be quite a handy indicator though it’s far from a magic bullet. Market volatility and unexpected news often have the final say because deeper factors overshadow what this pattern might hint at. Low trading volumes tend to throw a wrench in the works and lead to signals that can mislead even the most cautious traders.

Are you tired of juggling multiple tools for your trading needs? TradingView is the all-in-one platform that streamlines your analysis and decision-making.
With its powerful charting capabilities, real-time data, and vibrant community, TradingView empowers traders like you to stay ahead of the market. Join thousands who trust TradingView for their trading success.

19 posts written
Learn how the harami candlestick pattern signals potential market reversals. This guide breaks down...

Master the hammer candlestick pattern—a key indicator for market reversals. This beginner-friendly g...

Unlock the power of the bear flag pattern with our practical, step-by-step guide. Understand market...

Discover the bullish harami candlestick pattern—a key technical signal that can hint at trend revers...