


Technical Analysis
IOU Meaning in Finance
Discover what IOUs mean in finance, their role as informal debt acknowledgments, and how understandi...

Candlestick patterns are a cornerstone of technical analysis, offering traders those little visual nuggets that hint at potential shifts in market direction. Take the inverted hammer candle for example—it’s one of those patterns that often gets tossed aside or misunderstood, even though it actually packs some valuable clues about possible trend reversals.
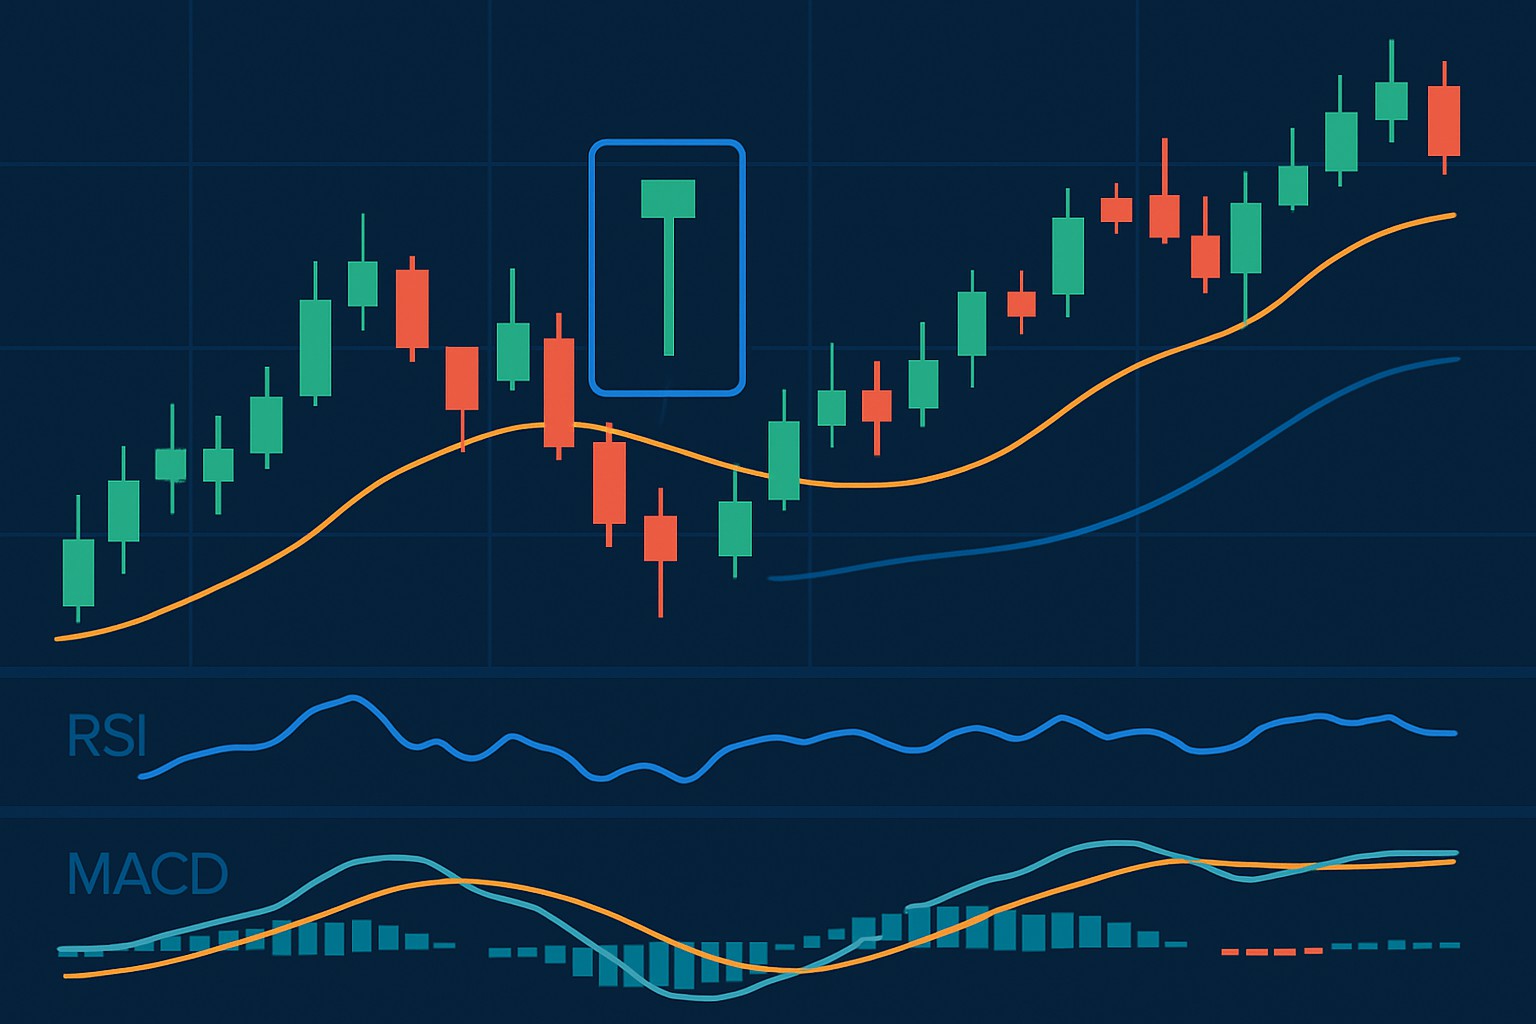
The inverted hammer candle is a quirky candlestick pattern that stands out for its small real body close to the candle’s low and a long upper shadow at least twice as long as the body. You’ll often spot it after a downward trend like a signal flare from buyers pushing back against the bears.
A common misunderstanding is mixing up the inverted hammer candle with the shooting star pattern. They look quite similar at first glance but the shooting star usually appears at market highs and signals a bearish reversal like a warning flare. Unlike the inverted hammer which can be more subtle, the shooting star shows up after an uptrend and suggests that sellers are beginning to steal the spotlight from buyers.
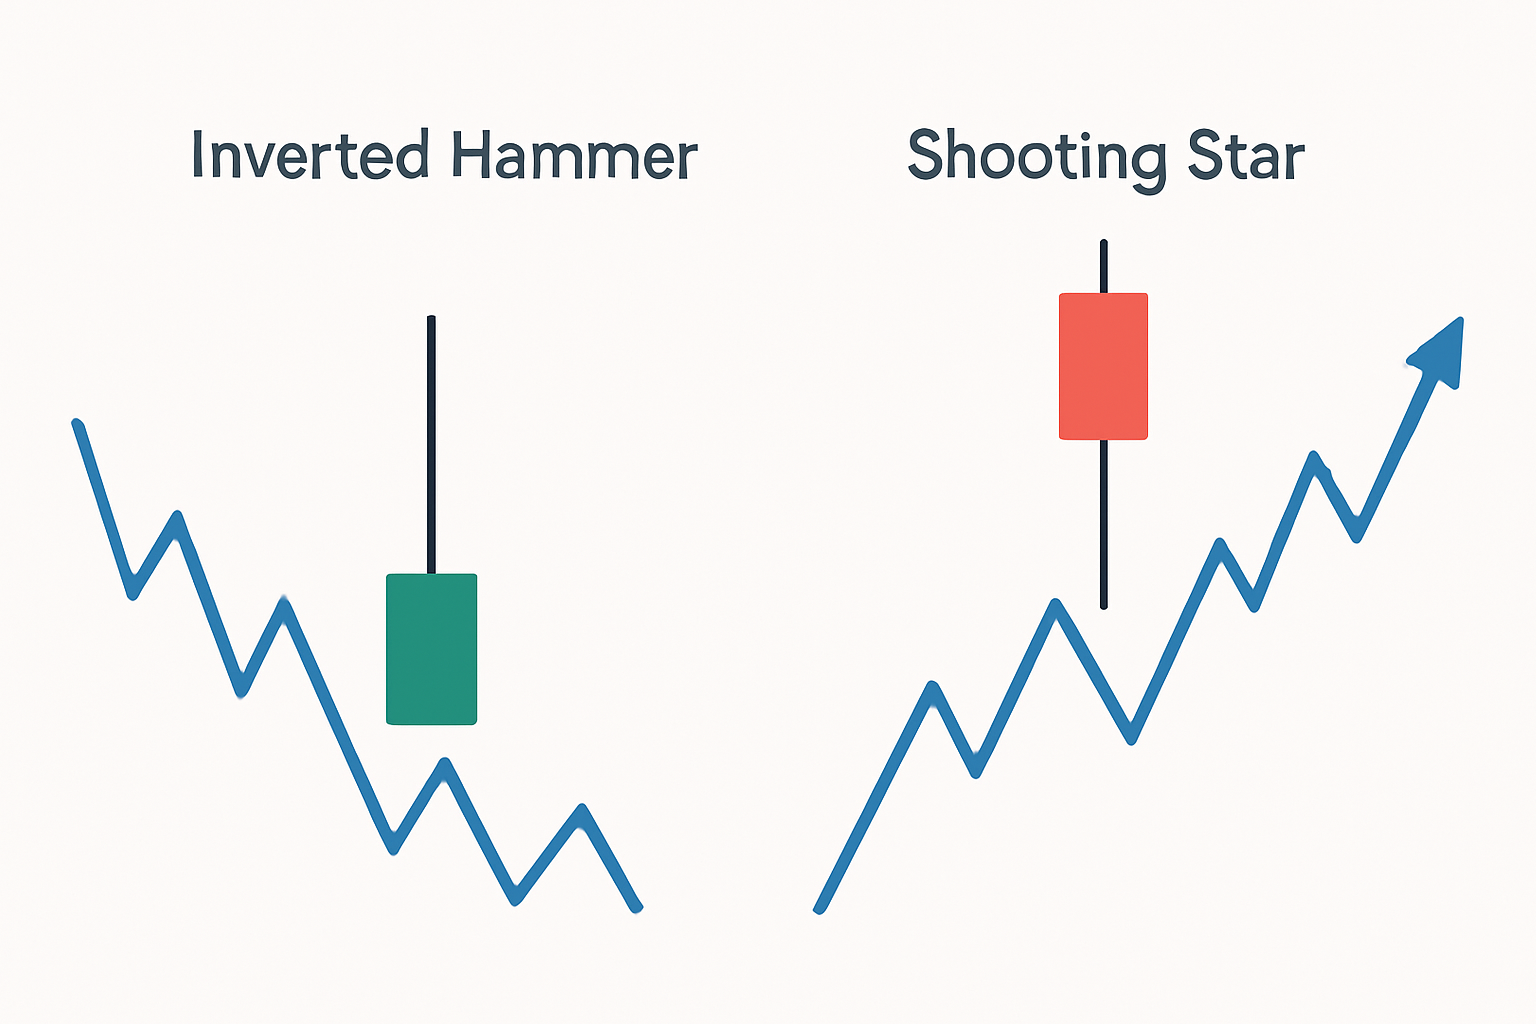
Side-by-side illustration of an inverted hammer candle versus a shooting star candle, highlighting their key differences and market positions.
The inverted hammer candle tells a story about the tug of war between sellers and buyers. Sellers try to shove prices down early in the session but buyers step in and lift the price leaving behind an unmistakably long upper shadow. Even though the close nearly matches the open, that upper wick hints at a growing bullish interest eager to flip the script on the downtrend.
The inverted hammer signals a tug-of-war between bears and bulls, with bulls gradually flexing their muscles despite some early selling pressure. Spotting this pattern can be a real game-changer for traders looking to sniff out a potential trend reversal before it fully takes hold.
Spotting an inverted hammer candle calls for a keen eye on the candle's shape and its spot in the price trend. Traders would do well to begin with clean, clear price charts and double-check that a downtrend is genuinely underway. Then, keep an eye out for a candle that ticks all the boxes for the classic inverted hammer look.
Make sure the previous trend is heading downward and clearly showing a pattern of lower lows and lower highs—a steady slide down the hill.
Keep an eye out for a candle with a small real body near the session's lower price range, like the little guy trying to hold his ground.
Look for a long upper wick at least twice the length of the body, a classic sign that buyers are trying to push back with some gusto.
Check that there is little or no lower shadow. This means sellers didn’t get aggressive below the open price—a subtle but important detail.
Be patient and wait for the next candle to close on a bullish note or show higher volume. This confirms the reversal might be taking shape. It’s like waiting for the green light before stepping off the curb.
Understanding inverted hammer candles really hinges on the context and trading volume. A single inverted hammer usually doesn’t tell you much and can sometimes send you down the wrong path. When one pops up near a key support level or right after a sharp drop, it starts to grab your attention. If you see a noticeable spike in volume on the day the inverted hammer appears, it often signals stronger buyer interest and makes the pattern more trustworthy.
Traders typically seek some solid confirmation of an inverted hammer signal before pulling the trigger on a trade, aiming to keep risk in check. They tend to keep an eye out for things like higher volume or bullish closes following the pattern, or they might peek at other trusty indicators such as the Relative Strength Index (RSI) or Moving Average Convergence Divergence (MACD).
| Method | How It Works | Interpretation | Example Scenario |
|---|---|---|---|
| Volume Spike | Trading volume jumps noticeably on the day the inverted hammer shows up | This often means strong buying pressure is pushing back against selling | Volume doubles after a downtrend, hinting that a reversal might just be around the corner |
| Bullish Close | The very next candle closes above the inverted hammer's close | This confirms buyers haven’t thrown in the towel and are still running the show | A green candle closing above the inverted hammer's close signals the tide is turning |
| RSI Divergence | Price drops to new lows while the RSI stubbornly refuses to follow | This usually signals weakening bearish momentum and teases a bullish reversal on the horizon | Price hits new lows but RSI forms higher lows, suggesting something's about to give |
| MACD Crossover | The MACD line crosses above the signal line | This marks a shift in momentum that flips from bearish to bullish, like changing gears | MACD crosses above its signal line the day after the inverted hammer pops up |
| Support Level Proximity | The inverted hammer makes an appearance close to a well-known support level | When support holds firm, it ups the odds of a reversal happening | Price finds support, forms an inverted hammer, showing buyers are standing their ground |
Grasping the theory is one thing but seeing real examples in action really helps nail down the understanding. Picture this: a stock has been sliding steadily day after day. Then out of nowhere an inverted hammer pops up near its usual support level followed by a strong bullish candle carrying higher volume. This is a clear nudge that a reversal might be brewing. Traders using platforms like TradingView can catch these patterns live which is a huge help when confirming signals before making a move.
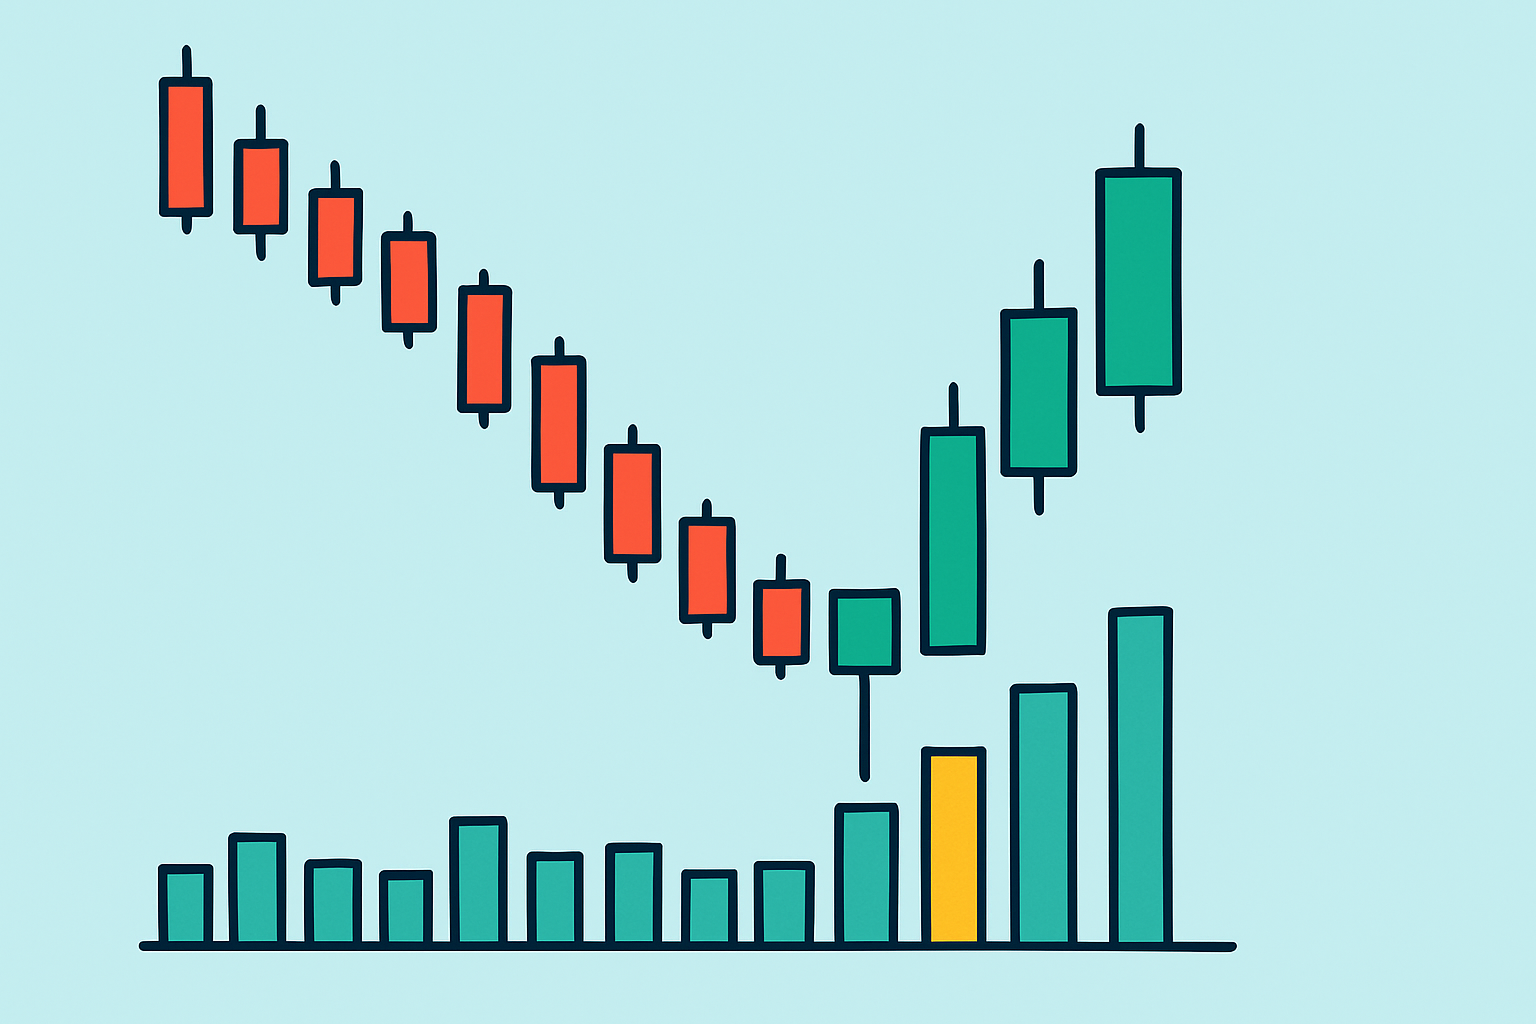
Chart example highlighting an inverted hammer candle followed by a confirming bullish candle with volume, illustrating effective trade setup.
Spot a clear downtrend by thinking of it as a series of lower highs and lower lows moving together.
Look out for the inverted hammer candle which usually appears with a long upper wick and a small real body near the bottom like a little flag waving upside down.
Confirm the pattern by checking for higher volume and a bullish candle that closes above where the inverted hammer ended.
Consider entering the trade around the open or close of that confirmation candle because the timing feels just right.
Protect yourself by setting a stop loss just below the inverted hammer's low to manage risk.
Stay alert. Watch the trade develop and plan your exit carefully whether that is by hitting resistance levels or using trailing stops to secure gains.
Inverted hammer candles can be quite handy but relying on them alone is like putting all your eggs in one basket—it rarely pans out well. I have seen plenty of traders fall into the trap of trusting this pattern blindly only to get burned by false breakouts or jump into trades too soon. It is surprisingly easy to confuse the inverted hammer with lookalikes like the shooting star. That mix-up usually leads to bad timing and inevitable losses.
Achieving steady success really pays off when you pair inverted hammer candles with a broader toolkit of technical analysis and savvy risk management. Keep an eye on support and resistance levels—they’re like your roadmap to potential reversal spots. Then, play the waiting game for confirmation candles or momentum indicators such as RSI or MACD to give you a nudge. When setting stop losses, placing them just beyond recent lows helps keep those risks nicely in check. And don’t forget, careful position sizing is your friend here.

Are you tired of juggling multiple tools for your trading needs? TradingView is the all-in-one platform that streamlines your analysis and decision-making.
With its powerful charting capabilities, real-time data, and vibrant community, TradingView empowers traders like you to stay ahead of the market. Join thousands who trust TradingView for their trading success.

17 posts written
Discover what IOUs mean in finance, their role as informal debt acknowledgments, and how understandi...

Master the hammer candlestick pattern—a key indicator for market reversals. This beginner-friendly g...

Discover the bullish harami candlestick pattern—a key technical signal that can hint at trend revers...

Discover the doji candlestick—a powerful price action signal revealing market indecision. This begin...