


Technical Analysis
How to Spot a Hammer Candlestick in Trading Charts
Master the hammer candlestick pattern—a key indicator for market reversals. This beginner-friendly g...

The spinning top candle is one of those classic candlestick patterns in technical analysis that gives pretty handy clues about market sentiment. It’s a tug of war playing out between buyers and sellers, often signaling a bit of hesitation or a potential shift in price direction.
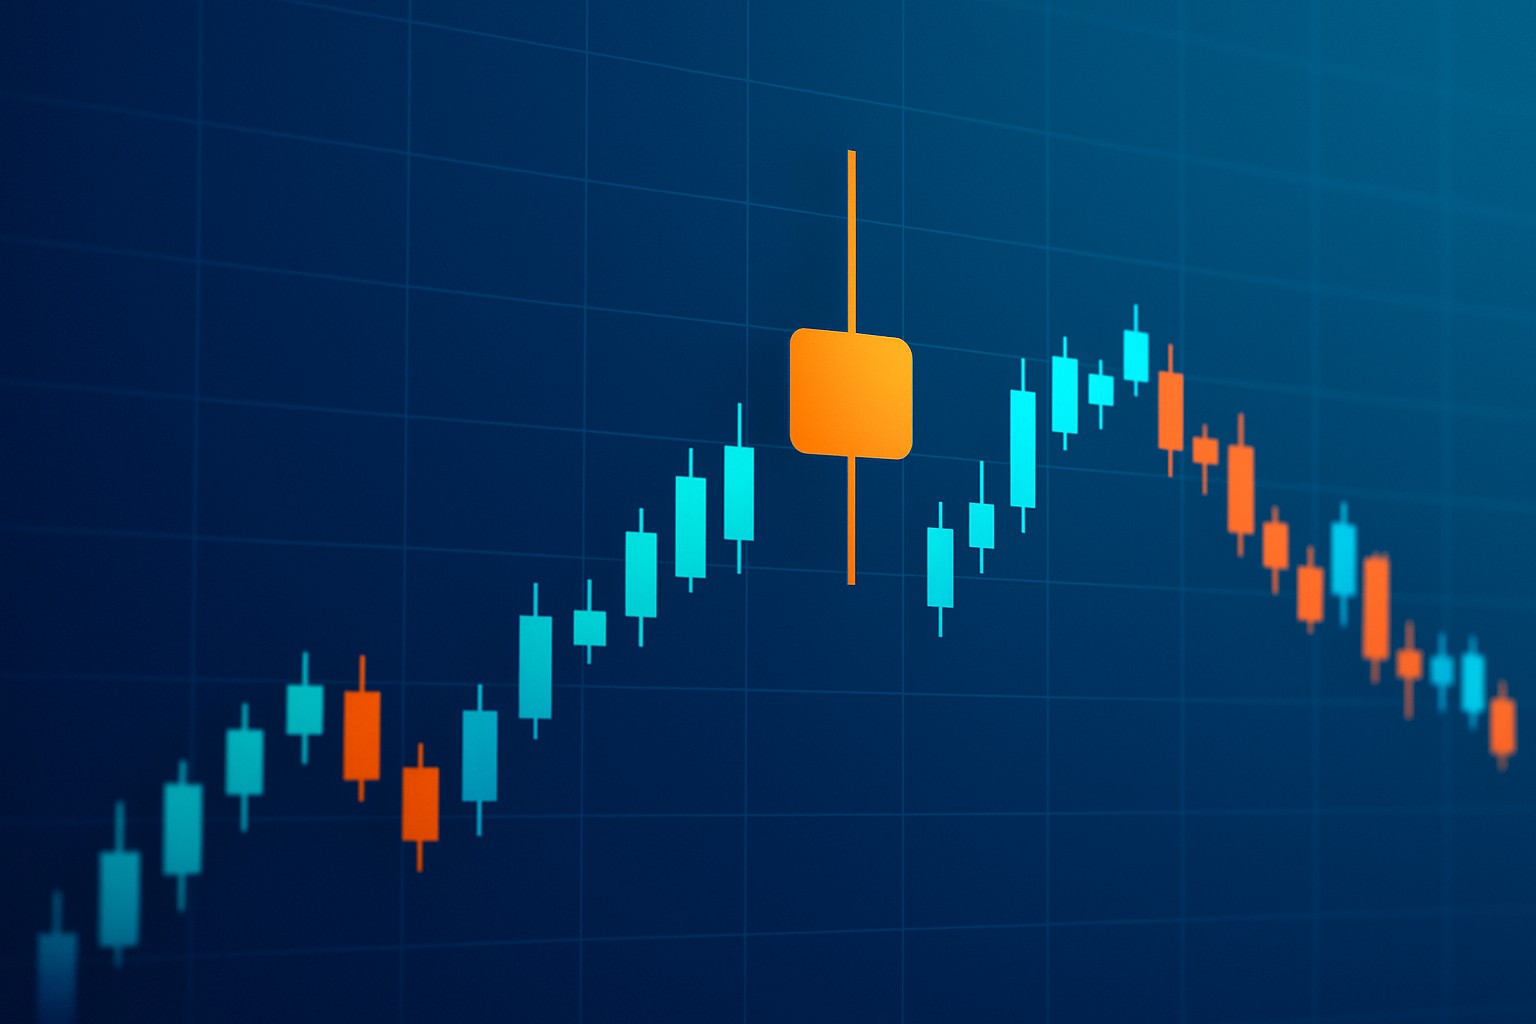
A spinning top candle sports a small real body that means the opening and closing prices are close together while showing fairly long upper and lower shadows on both sides. This pattern hints that prices moved around quite a lot during the period but ultimately ended up close to where they started.
Spot a spinning top candle by zeroing in on the candle’s shape on the price chart. The key is finding a small body accompanied by wicks that are roughly the same length or even a bit longer. Taking a quick glance at the candle’s color can offer a handy clue about the short-term bias.
Take a good look at the candle's length and notice how the real body is surprisingly small compared to the overall size like a tiny heart beating inside a big frame.
Eyeball the lengths of the upper and lower shadows. Ideally they should both be fairly long and roughly the same size to give that balanced look.
Check out the candle's color. Green or white usually signals a bullish close while red or black leans bearish. But don’t let the color alone fool you because it’s only part of the whole picture.
Think about where this candle pops up in the bigger trend or price pattern to really get a feel for what it’s trying to tell you.
Example of a spinning top candle on a candlestick chart highlighting its small real body and long shadows
A spinning top candle paints a picture of a market that is a bit unsettled where buyers and sellers are neck and neck roughly balancing each other out. It captures this delicate dance of equilibrium and uncertainty and often suggests the current price trend could be running out of steam.
A spinning top candle captures one of those rare moments in the trading fray when neither buyers nor sellers are ready to call the shots. It’s like the market is taking a deep breath, briefly hitting the pause button before gearing up for whatever comes next.
The importance of spinning top candles tends to shift depending on the market mood. After sharp trends, they often give a little nudge toward possible reversals. In those sideways markets where nothing seems to make up its mind, they usually hint at ongoing uncertainty.
| Market Context | Interpretation | Potential Price Outcomes | Trading Considerations |
|---|---|---|---|
| Uptrend | Buying momentum appears to ease off a bit | Could spark a reversal or just a pause in the trend | Best to hold your horses and wait for confirmation from the next few candles or indicators |
| Downtrend | Selling pressure seems to lose steam | Might hint at a bottom forming or a brief retracement | It is wise to look for bullish signals before jumping in |
| Sideways/Range | Market looks indecisive, with forces evenly matched | Likely to keep chugging along the range or break out unexpectedly | Let the range boundaries be your trusty guide for entries and exits |
| Near Support/Resistance | Price is poking at key levels but with some hesitation | Could swing either way—reversal or breakout depends on volume and follow-through | Pair volume with momentum indicators to get a clearer read on the market's next move |
To boost the reliability of your trading calls, it is smart to consider spinning top candles with other trustworthy technical indicators like moving averages and RSI.
If you’ve ever watched a spinning top wobble just before it settles, you’ll get why these candles are such a fascinating read on the charts. In this section, we will dive into some real-world trading strategies that harness the subtle hints these little guys drop—think of them as the market’s way of whispering, not shouting. Ready to sharpen your trading instincts? Let’s get into it.
Traders often weave spinning top candles into a broader strategy by pairing them with confirmation signals and careful risk management. For instance, catching a spinning top flickering near a trendline followed by a confirming candle can serve as a reliable entry point.
Keep an eye out for a spinning top candle near key technical zones like support or resistance—you often find them in these spots.
Hold your horses and wait for the next candle to give you a clearer sign. Aim for a strong close that backs up your direction.
When you’re ready to pounce, plan your entry just above or below this confirming candle depending on whether you’re betting on a breakout or a reversal.
Don’t forget to tuck in a stop loss just beyond the farthest wick of the spinning top. This move helps shield you from sudden price swings.
Finally, set profit targets in line with your risk-reward plan and nearby technical levels. Keep an eye on your position to tweak it as the market unfolds.
Spinning top candles can be helpful though they often get a bad rap for being confusing. On their own they don’t always shout ‘trend reversal’ so it’s best not to put all your eggs in that basket.

Tired of missing opportunities and making suboptimal trading decisions? TrendSpider's cutting-edge platform automates complex technical analysis, saving you time and reducing human error.
With multi-timeframe analysis, dynamic alerts, backtesting, and customizable charting, you'll gain a competitive edge in identifying trends and making informed trades across global markets.

19 posts written
Master the hammer candlestick pattern—a key indicator for market reversals. This beginner-friendly g...

Discover the bullish harami candlestick pattern—a key technical signal that can hint at trend revers...

Unlock the power of candle patterns to decode market psychology and improve your trading precision....

Unlock the power of the bear flag pattern with our practical, step-by-step guide. Understand market...