


Trading Strategies
Trend Trading Strategies To Ride Big Market Moves
Master trend trading strategies to harness powerful market moves. Learn from basics to advanced tact...

Getting a solid grasp on supply and demand trading can truly flip the script for traders across the board whether you’re dabbling in forex, stocks or diving into the wild world of cryptocurrencies. Plenty of people know the basics but it’s those practical battle-tested tips that help you spot, time and manage trades around supply and demand zones that really separate the rookies from the pros. This article takes a closer look at some sneaky less obvious techniques and insider strategies that seasoned traders swear by when it comes to pinpointing authentic zones, fine-tuning entry and exit moves and nudging your risk-reward balance into a healthier spot.
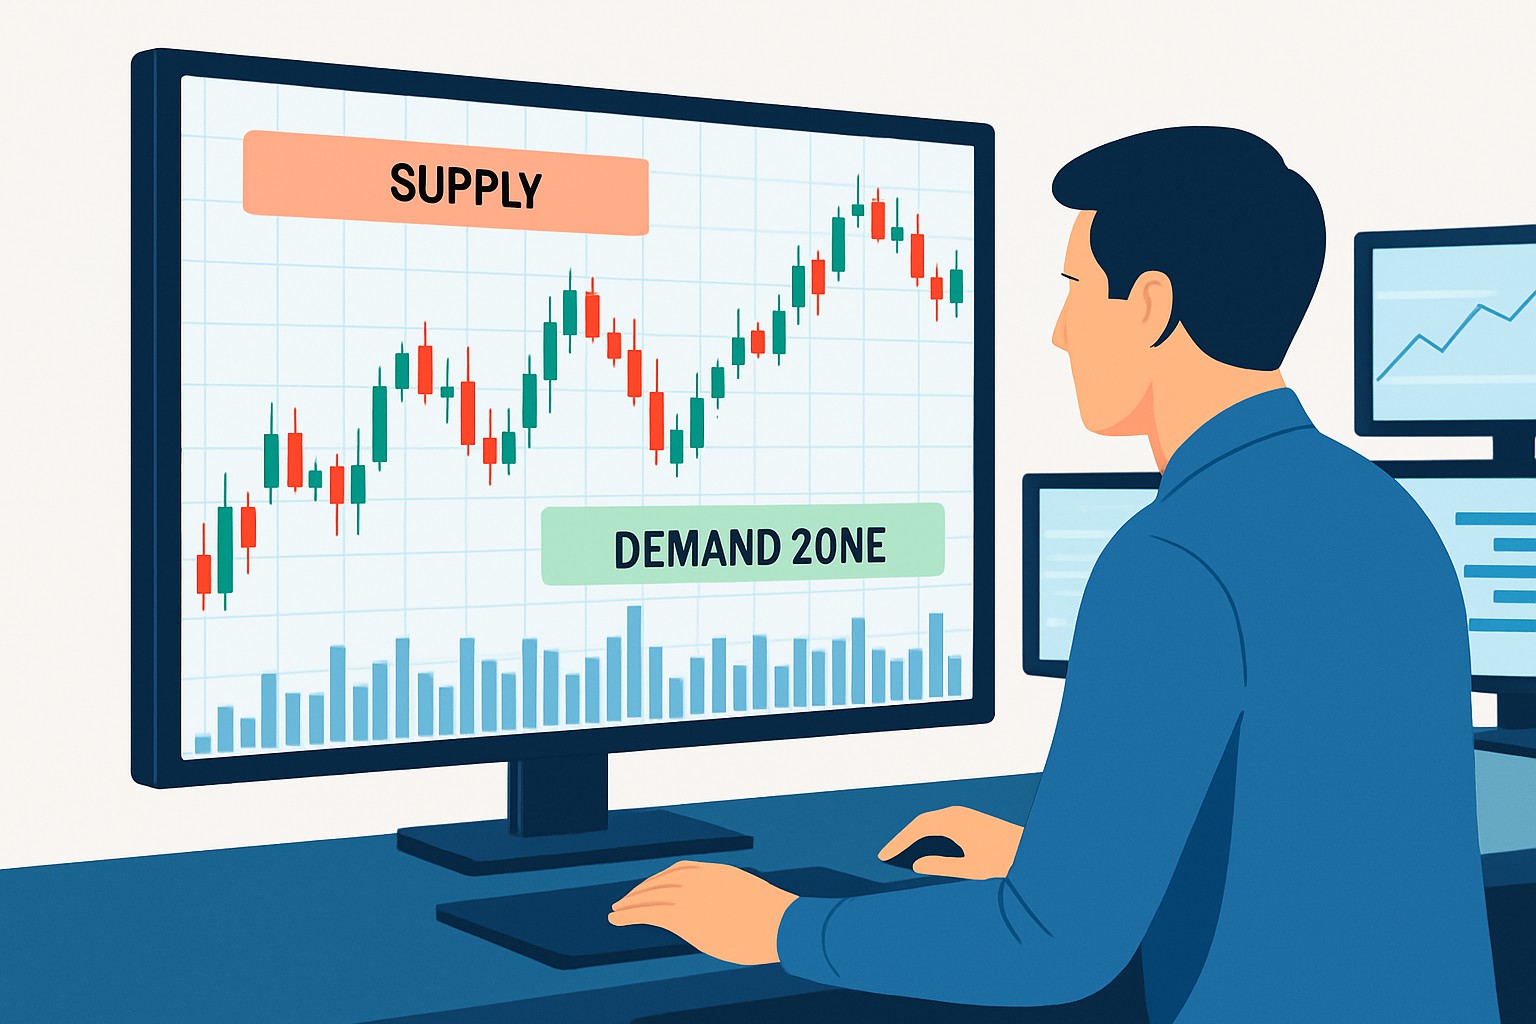
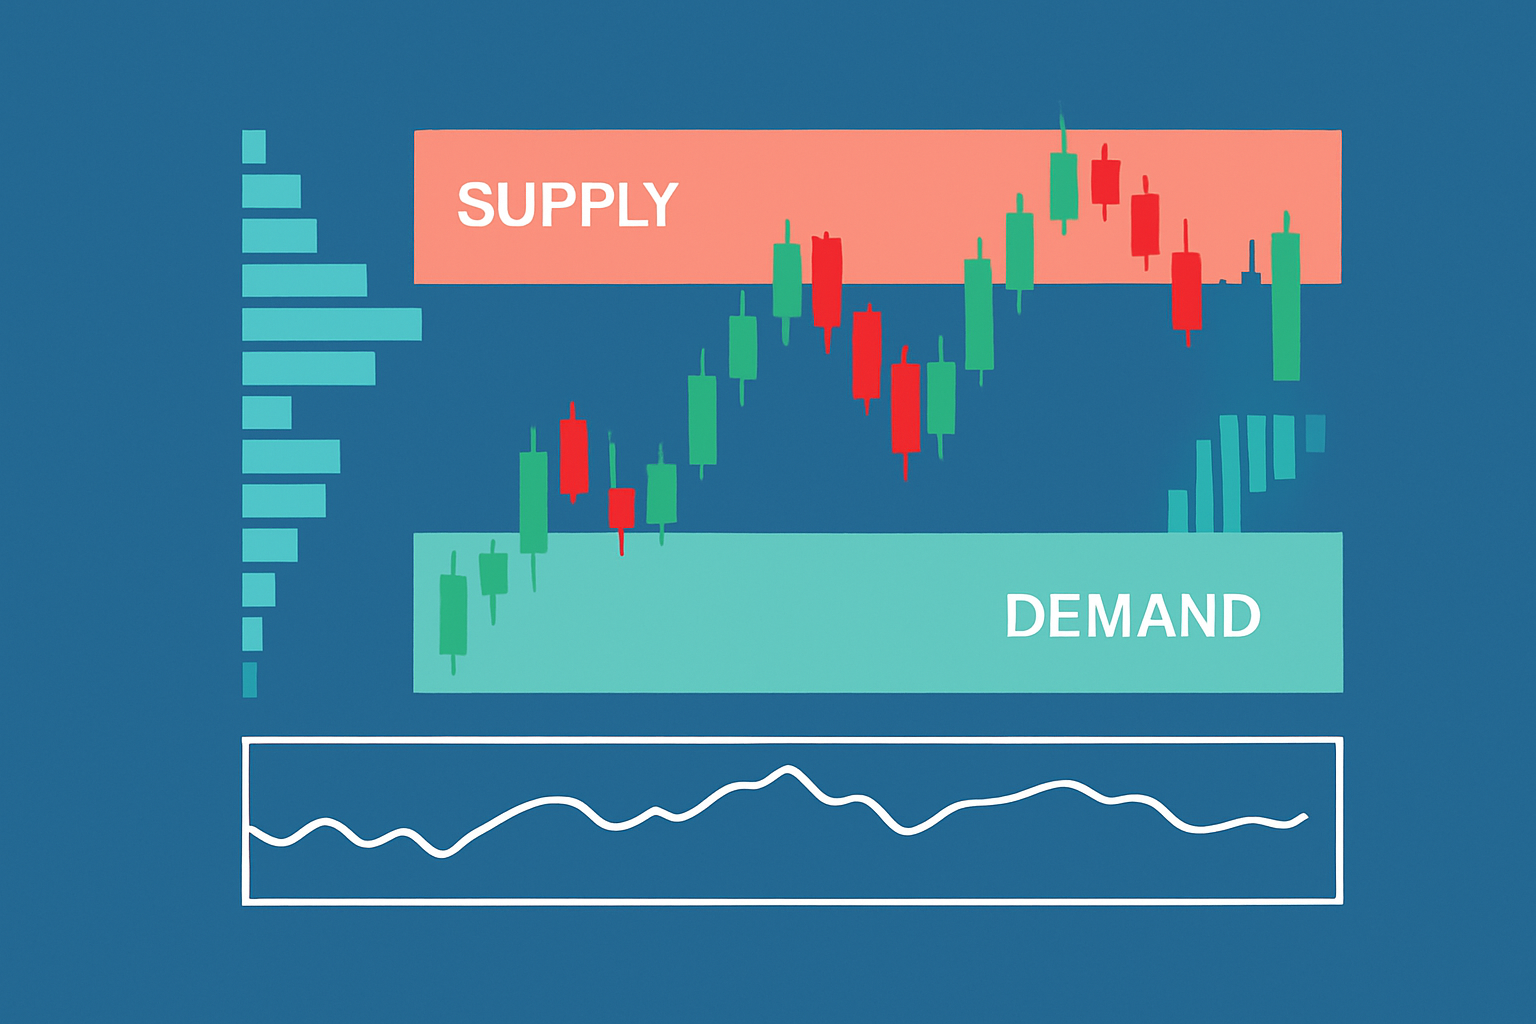
Supply and demand trading revolves around spotting those key price levels where supply outstrips demand, or vice versa. These zones aren’t just random lines on a chart—they actually capture the ebb and flow of market psychology and the often unseen movements of institutional orders. Because of this, they become key areas where prices tend to either hit the brakes and reverse or find the fuel to keep on going.
Not all supply and demand zones are created equal. The real deal usually shows up as sharp price moves bursting away from a level signaling serious buying or selling pressure. Instead of just eyeballing obvious consolidations or flat support and resistance areas it’s smarter to hunt for clues like increased volume and distinct candle patterns plus order flow signals that back up the zone’s credibility and strength.
Timing is everything when trading near supply and demand zones. It’s not just about waiting for the price to hit the zone and hoping for the best. You want to watch for subtle price action signals like candlestick rejection patterns or confirmation candles that show when buyers or sellers are stepping onto the stage. Add volume and momentum indicators to the mix and you have a better shot at spotting false breakouts. This helps you avoid jumping the gun and keeps losses in check.
Be patient and wait for the price to pull back near the identified supply or demand zone before jumping in. Good things come to those who wait.
Keep an eye out for candlestick patterns like pin bars, engulfing candles or dojis that hint at rejection in the zone. These little signals often sneak up on you.
Use volume spikes or momentum oscillator crossovers to double-check your entry signals. Make sure there’s genuine interest behind the move and not just a flash in the pan.
Avoid trading during periods of low liquidity like market openings or holidays because that’s prime time for those pesky false breakouts.
Set alerts on your trading platform to give you a heads-up when price nears these zones so you can step back from the screen and still stay on top of things.
Placing stop losses and take profit levels with some thought behind them is vital if you want to protect your capital and boost your gains in supply and demand trading. Instead of throwing stops in at random, it’s smarter to tuck them just beyond the opposite edge of the zone. This way you avoid getting kicked out by pesky pullbacks that happen often. Let the width of the zone guide you in setting realistic profit targets. If you can, try using trailing stops to lock in profits as the price moves in your favor.
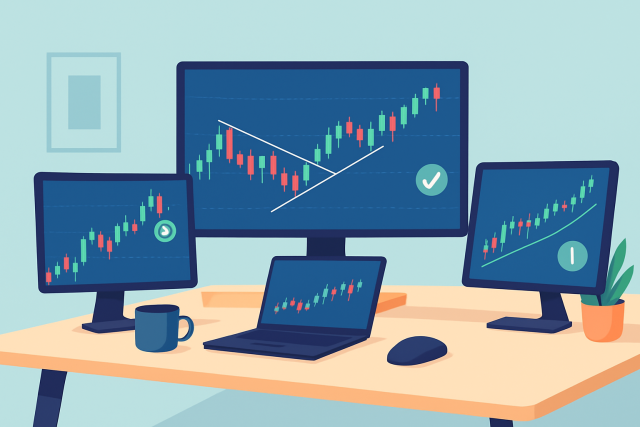
To sharpen the accuracy of your supply and demand setups, it’s a good idea to blend in a few technical indicators like RSI and moving averages. Volume profile and momentum oscillators also help. This well-rounded cocktail usually confirms the strength of those important zones and filters out false signals.
Example chart showing supply and demand zones with supporting RSI and volume indicators for enhanced trade setup validation.
Many traders tend to mix up traditional support and resistance levels with the real deal—true supply and demand zones—or they jump into trades without getting the proper confirmations. Overtrading on shaky signals and ignoring the bigger market picture can sneakily chip away at your potential profits before you even realize it.
Improving your supply and demand trading skills involves more than just dry theory. It usually comes down to putting some handy tips and clever shortcuts to work—those little tricks experts swear by to get ahead. By tapping into lightning-fast data analysis and keeping your records neatly organized while setting up notifications that actually catch your eye, you can sharpen your reflexes and navigate these vital zones with more confidence and precision.
Use lower timeframes like 5-minute or 15-minute charts to hone in on your entries after spotting supply or demand zones on higher timeframes. It’s like zooming in with a magnifying glass to catch finer details.
Keep a detailed journal tracking how often your trades work out and how price behaves around those zones. This can be a real eye-opener for finding the most reliable areas.
Set up alerts on your platform to notify you when price nears key zones so you’re not left staring at the screen all day and missing golden opportunities.
Backtest your favorite zones on historical charts using tools like TrendSpider's backtesting feature. It’s like a dress rehearsal, seeing how your zones held up over time before risking real money.
Blend in some fundamental analysis—think economic reports or earnings announcements—alongside your supply and demand zone checks to give your trading decisions more muscle.

Struggling to improve your trading performance? Edgewonk's advanced analytics tools are designed to give you the edge you need.
With detailed trade journaling, robust strategy analysis, and psychological insights, you'll gain a comprehensive understanding of your strengths and weaknesses. Don't miss out on this game-changing opportunity.

23 posts written
Master trend trading strategies to harness powerful market moves. Learn from basics to advanced tact...
Master trade patterns with TrendSpider’s AI-powered tools. Learn expert tips to spot key formations,...

El Salvador's adoption of Bitcoin as legal tender marks a groundbreaking experiment in national curr...

Unlock the power of the head and shoulders pattern with this complete guide. Learn to spot, trade, a...