


Trading Strategies
Supply and Demand Trading Tips That You Can Actually Use
Unlock expert supply and demand trading tips proven to improve your market timing, entry strategies,...

Grasping key trade patterns is vital for traders aiming to sharpen their market timing and make smarter decisions. With the help of TrendSpider’s advanced tools, this article highlights practical trade patterns that can seriously elevate your analysis game.
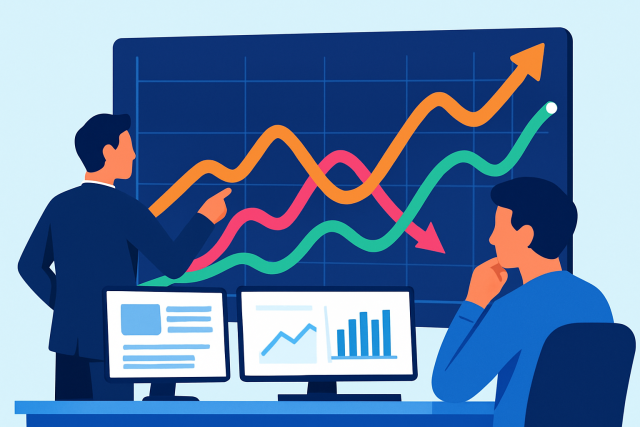
Trade patterns are those recurring shapes you often see on price charts, hinting at changes in market momentum and possible shifts in direction. Spotting these patterns can give traders a clearer sense of when to jump in or step out of positions—kind of like having a weather vane for risk management.
TrendSpider changes how traders spot patterns by blending AI-powered automation with easy-to-use tools. It helps them uncover complex trade patterns faster and with much more precision—no more scrambling through charts like a headless chicken. Features include dynamic trendlines that move with price action, synchronization across multiple timeframes, and smart alerts you can customize.

Harnesses AI-driven algorithms to effortlessly spot key trends, support and resistance levels, and potential entry and exit points—no more tedious manual chart scanning required.
Utilizes cutting-edge AI to detect a wide array of chart patterns with pinpoint precision, including those trade-specific gems that can spell opportunity or caution well before the crowd catches on.
Empowers users to craft and tweak their own technical indicators tailored to their unique trading style and the specific quirks of their favorite trade patterns.
Brings together multi-timeframe charts, Fibonacci retracements, dynamic price alerts, and layered indicators — a toolkit designed to deepen your technical dive and bring chart patterns into sharp focus.
Offers a tiered subscription lineup (Basic, Pro, Premium) tailored to every trader’s experience and needs—from handy automatic trend analysis to the full suite of professional-grade tools.
Blends automated insights with custom alerts and deep-dive analytics, helping traders move fast and smart when it matters most.
Covers a broad spectrum of technical analysis techniques beyond just patterns—think trendlines, volume profiling, and robust backtesting tools—to bulk up your strategy toolbox.
When it comes to trading, spotting the right patterns can really make all the difference. With TrendSpider’s suite of tools, you’re not just guessing; you’re riding the waves with a bit more confidence. Let’s dive into some trade patterns that are worth your attention and how these tools can help uncover them with ease.
Focusing on trade patterns that have a better shot at success can truly sharpen your edge. TrendSpider’s tools make it a breeze to spot and track these formations, taking the guesswork out of pattern-based trading.
Double Tops and Bottoms classic setups that often signal a big shift is brewing
Head and Shoulders patterns that traders swear by like a reliable old friend
Triangles including Ascending, Descending and Symmetrical—they might look simple but can pack a punch when the breakout happens
Flags and Pennants quick little pauses before the market takes off again like catching your breath during a sprint
Cup and Handle a pattern that’s as satisfying as your favorite coffee mug hinting that good things are just around the corner
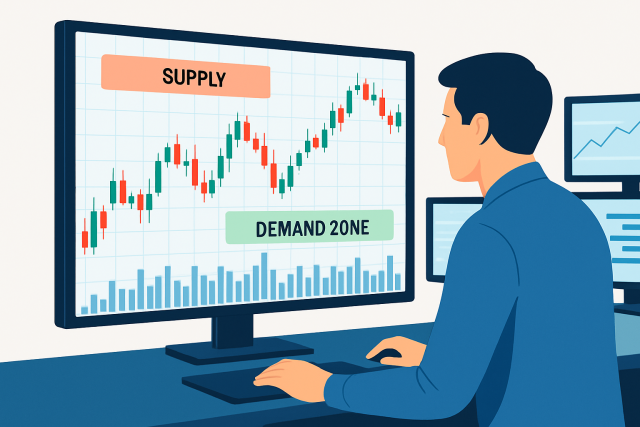
You might have come across these patterns popping up now and then—double tops and double bottoms are like old friends in the trading world. They do not just hint at a possible reversal; they almost shout it, though of course, as with all things in the market, nothing is set in stone. Spotting a double top usually means the price tried to push higher twice but just could not quite make it stick, almost like it hit a stubborn ceiling. On the flip side, a double bottom shows the price dipped down to a support level twice and bounced back up, as if the market found solid ground to step on. In my experience, keeping an eye out for these formations can save you from some nasty surprises and sometimes even help catch a sweet turn before it really takes off.
Double tops and bottoms are classic reversal patterns that often signal key resistance or support levels. Think of them as the market's way of waving a warning flag. Thanks to TrendSpider's automated trendline and level detection, traders can spot these patterns early and get timely alerts when the neckline gives way. They can also confirm breakout or breakdown moves.
Alright, let’s roll up our sleeves and dive into the classic Head and Shoulders pattern. It’s one of those trusty chart formations that is been around the block, signaling trend reversals like a seasoned traffic cop. Whether you’re a newbie or have some skin in the trading game, getting familiar with this pattern can really sharpen your market intuition.
The head and shoulders pattern is widely regarded as a trusty signal for trend reversals, showing two shoulders flanking a standout head in the middle. What makes it tick is how sharp and clear the neckline stands out. Once that line is broken, it usually signals a meaningful shift in direction. TrendSpider shines by removing guesswork and automatically spotting that neckline across different timeframes. It also fires off spot-on alerts to help you confirm the pattern. By diving into multiple timeframes like daily, hourly or weekly charts, you get a clearer picture and boost your odds of nailing the pattern.
Triangle patterns squeeze price action into tightening support and resistance lines, often hinting at an impending breakout. TrendSpider’s clever dynamic drawing tools catch these triangular shapes automatically, giving you a nudge just as the price creeps toward key breakout levels.
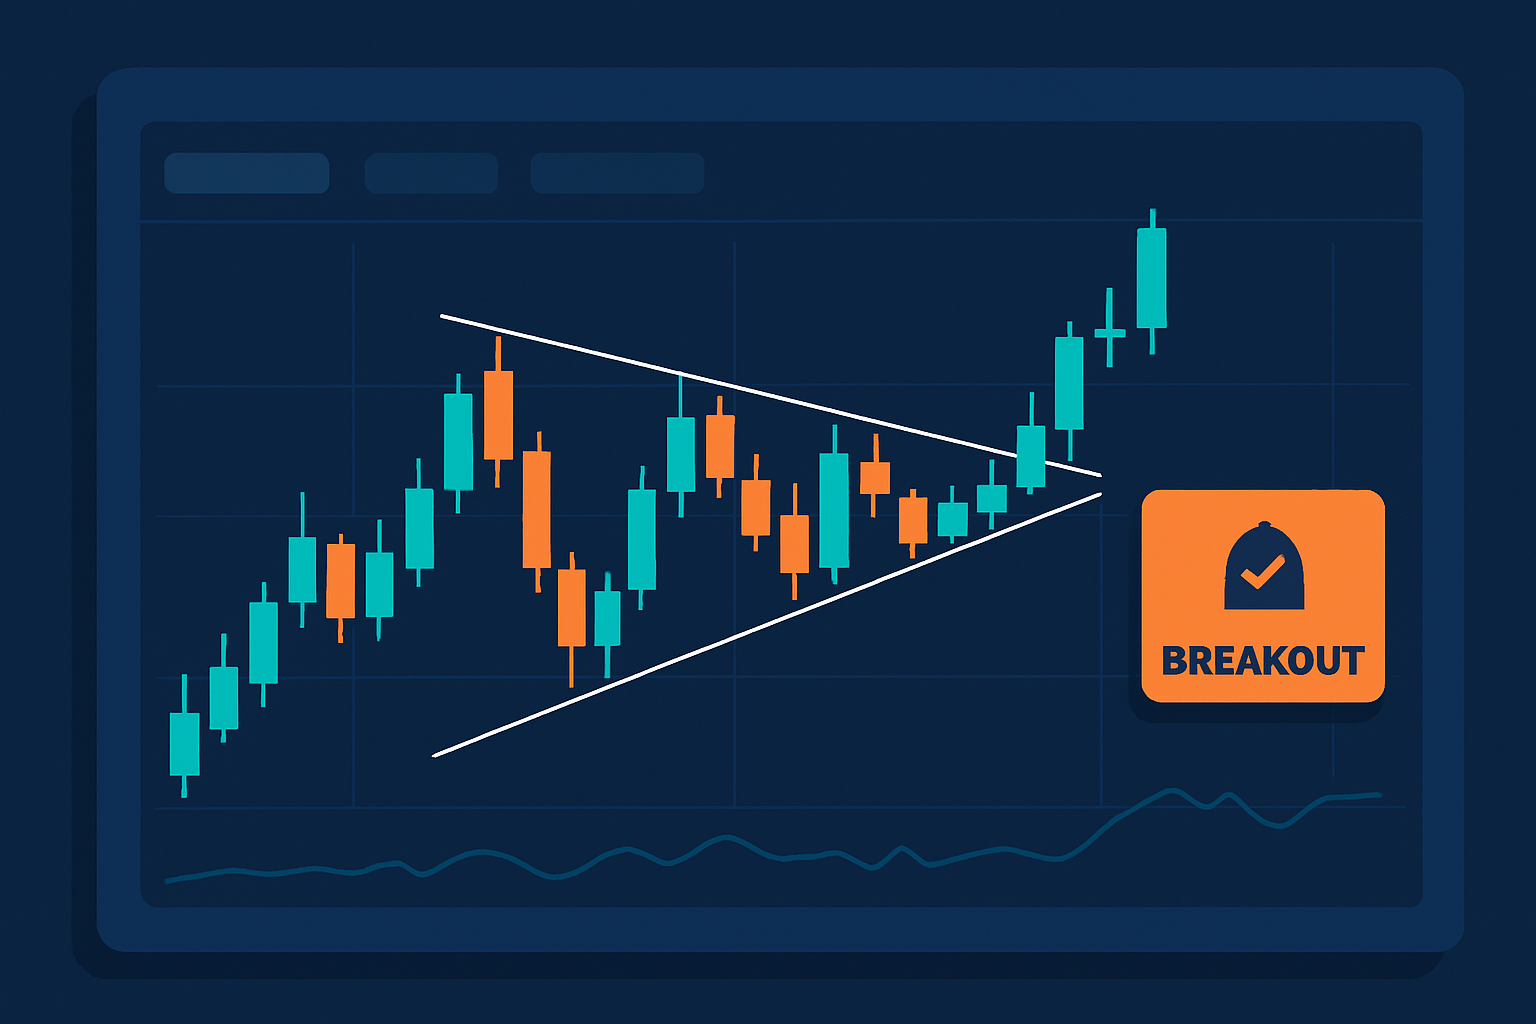
Chart illustrating triangle patterns with TrendSpider’s automated trendlines and breakout alert notifications.
Flags and pennants are classic short-term continuation patterns that typically show up right after sharp price moves, signaling a little breather before the trend resumes its march. TrendSpider’s clever pattern recognition tool quickly spots the strong move in the flagpole along with the tight consolidation that follows. It doesn’t just stop there—it visually highlights these formations and serves up backtesting data from similar past examples, so you can tweak your strategy with confidence.
The cup and handle pattern is a bullish continuation setup featuring a rounded bottom aptly named the cup, followed by a smaller consolidation phase we call the handle. Nailing the handle’s timing is pretty vital, as it often shows up just before those exciting breakout moments. Fortunately, TrendSpider’s algorithm makes life easier by automatically spotting the pattern and firing off alerts when breakout points are reached.
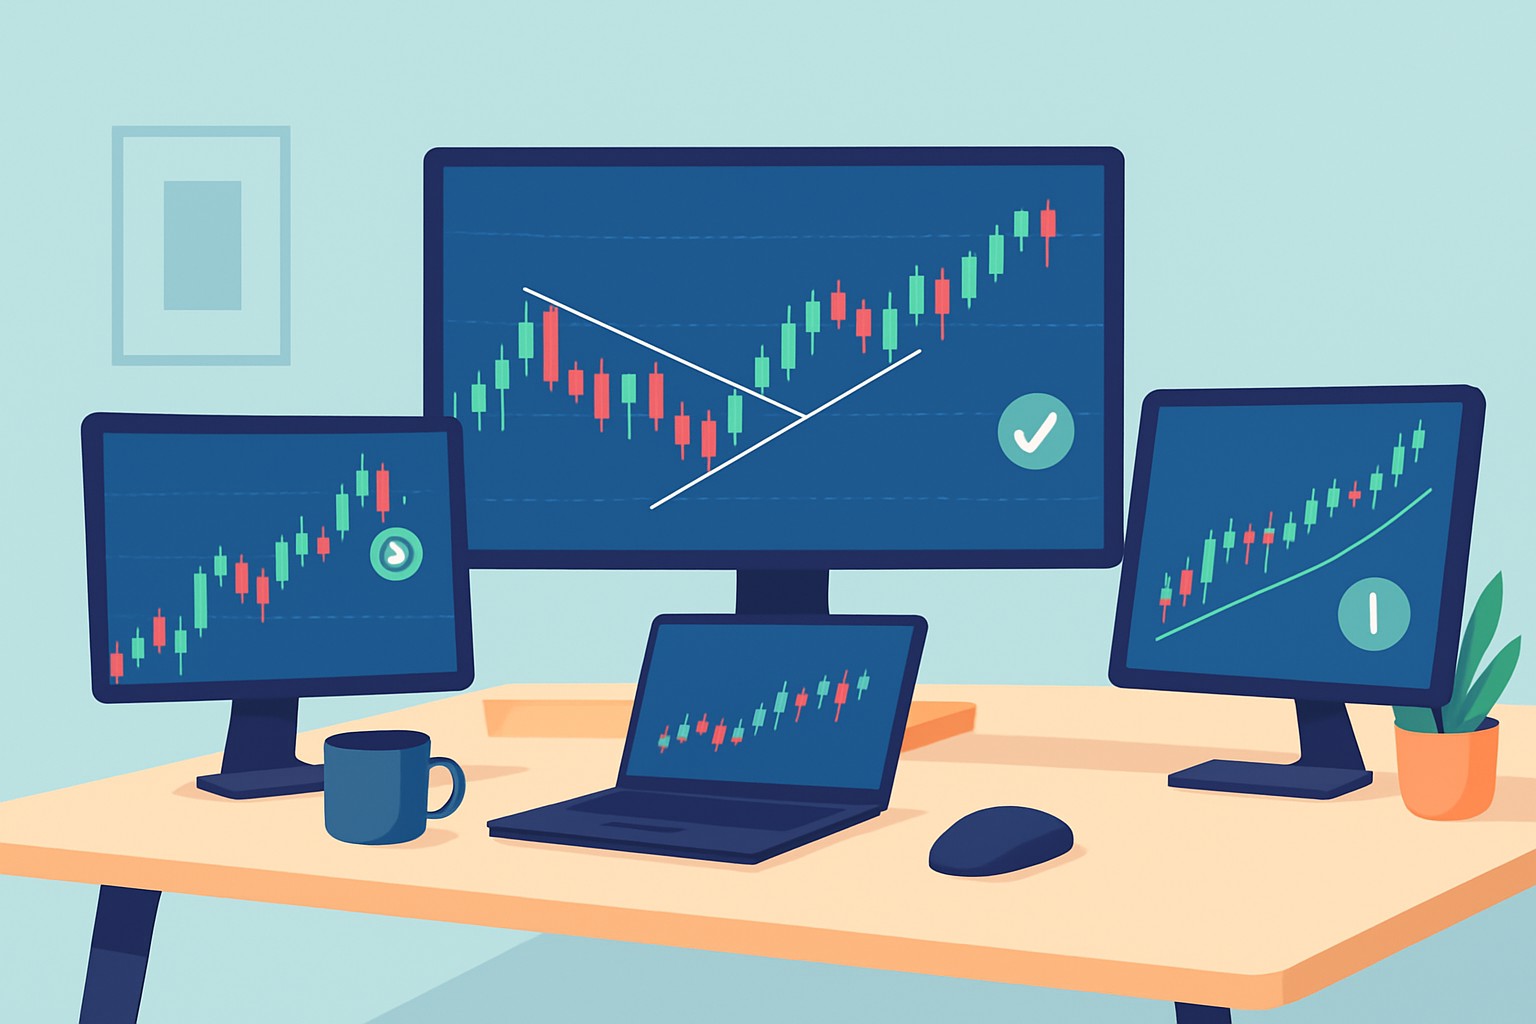
Checking trade patterns across several timeframes usually gives your trades more muscle in reliability. TrendSpider's multi-timeframe synchronization lets you see how patterns unfold on daily, weekly and intraday charts all at once. It is like having a bird's-eye view and a close-up rolled into one.
Customize alert settings in TrendSpider so you’re instantly in the loop when important trade patterns kick in or get confirmed. By setting clear pattern-specific alerts you’ll stay ahead of the game with important breakout or breakdown signals.
Pick the trade pattern that matches your trading style perfectly. Think of it as choosing the right dance partner for the market floor.
Set up alert triggers like neckline breaks or pattern completions to make sure you catch the market's major moves.
Choose how you want to receive notifications — email, SMS or mobile push — so you are always informed whether you are at your desk or grabbing a coffee.
Test your alert settings on past charts first. This rehearsal helps eliminate false alarms before going live and saves you from unnecessary stress.
TrendSpider really shines with its automated pattern recognition and spot-on algorithms, while TradingView brings to the table a buzzing social trading community alongside a treasure trove of indicators. Using both platforms together lets traders cross-check those algorithmic pattern signals with fresh ideas from peers and their own hands-on charting skills.
Picking the right trading platform can really change the game in how you analyze patterns, catch alerts on time, and make smarter calls. Here’s a side-by-side look at key features to help you weigh up two popular contenders.
| Criteria |  | |
|---|---|---|
| Pricing | Pro+ at $19.95, Premium for $39.95, and Elite hitting $59.95 per month—something for almost every budget. | Standard at $49.99, Pro for $79.99, and Elite topping out at $129.99 per month—it’s an investment, but one that serious traders might find worthwhile. |
| Charting Tools | Super easy to navigate, offering a wide range of customization, multiple indicators, and the handy ability to save your own templates. | Sophisticated and automated chart analysis that delivers crystal-clear visualizations, saving you time and guesswork. |
| Pattern Recognition | Mostly relies on you spotting patterns manually, using a vast toolkit of technical indicators—kind of like having a big toolbox but needing to pick the right tool yourself. | Powered by AI, it automatically spots trade patterns and signals, making the detective work a breeze. |
| Alerts and Notifications | Basic alert features come standard, though you’ll want to upgrade your subscription if you need the fancier, more advanced alerts. | Offers flexible, customizable alerts that keep you updated in real time—perfect for those who want to stay one step ahead. |
| User Experience | A friendly and intuitive interface that welcomes both rookies and seasoned pros alike—it’s easy to feel at home here. | Generally user-friendly, though some advanced features might make newcomers pause for a moment before diving in. |
| Community and Collaboration | A lively global community buzzing with idea sharing and social networking—kind of like a virtual trading floor where everyone’s chatting. | Less about the social side, focusing instead on delivering solid tools—so if you’re here for the tech, it’s got your back. |
| Backtesting Capability | Backtesting options are a bit scarce or not built-in, so don’t expect to run full strategy tests without extra tools. | Includes solid backtesting features that let you assess your strategies against historical data—a real plus for thorough traders. |
| Go to TradingView Website | Go to TrendSpider Website |
Teaming up TrendSpider’s automated trade patterns alerts with TradingView’s manual chart notes and lively community signals hands traders a pretty solid toolkit. This combo usually bumps up your pattern recognition game, while also letting you soak in both hard data and the wisdom of the crowd.

Struggling to improve your trading performance? Edgewonk's advanced analytics tools are designed to give you the edge you need.
With detailed trade journaling, robust strategy analysis, and psychological insights, you'll gain a comprehensive understanding of your strengths and weaknesses. Don't miss out on this game-changing opportunity.

17 posts written
Unlock expert supply and demand trading tips proven to improve your market timing, entry strategies,...
Master trend trading strategies to harness powerful market moves. Learn from basics to advanced tact...

Unlock the power of the head and shoulders pattern with this complete guide. Learn to spot, trade, a...

Discover what IOUs mean in finance, their role as informal debt acknowledgments, and how understandi...