


Trading Strategies
Trade Patterns to Watch When Using TrendSpider Tools
Master trade patterns with TrendSpider’s AI-powered tools. Learn expert tips to spot key formations,...


This guide breaks down how to seize opportunities from steady market moves using battle-tested trend trading techniques. No fluff just practical steps that you can rely on.
Trend trading is all about spotting market waves and riding them while they last. In this guide you get a friendly introduction to the nuts and bolts of trend trading as a powerful trading strategy. You dive into the key indicators that really matter, learn how to craft your own strategies and pick up advanced tips to help you squeeze the most out of big market moves.
Trend trading is a strategy centered on riding the wave of the current market direction whether it’s climbing or dipping with the aim of squeezing out the biggest profits possible.
Building a solid trend trading strategy is all about getting sharp at spotting those trends and laying down clear-cut rules for when to jump in and when to step back. It also means sticking to strict risk management like your trading life depends on it and hunting for confirmation from several tools.
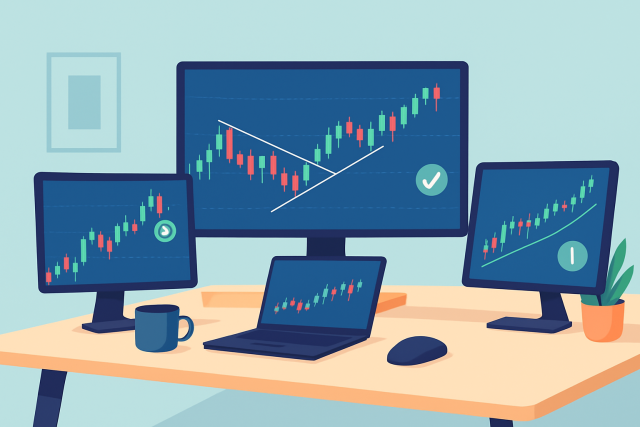
When it comes to catching a trend, a few trusty technical indicators tend to steal the spotlight. These tools are like seasoned guides, helping traders navigate the often choppy waters of market movements. Whether you’re just dipping your toes in or you’ve been around the block a few times, understanding these indicators can really up your game.
Certain technical indicators play a key role in trend trading by helping confirm the trend direction and gauge momentum strength. They also provide signals for when to enter or exit trades.
| Indicator Name | Purpose | How to Use in Trend Trading | Pros | Cons |
|---|---|---|---|---|
| Moving Averages (SMA/EMA) | Smooths out price data to reveal the underlying trend direction, cutting through the noise | Use them to spot the trend and keep an eye on crossover signals to time your entries and exits like a pro | Simple to understand and almost everyone uses them, which makes them a reliable go-to tool | Since they rely on past data, they’re a bit behind the curve and can sometimes send signals a tad too late |
| Average Directional Index (ADX) | Measures just how strong a trend really is—no guesswork needed | Use this to figure out if a trend has enough muscle to trade, so you don’t jump in when the market is just twiddling its thumbs | Helps you steer clear of trading in weak or sideways markets, saving you from frustrating whipsaws | It won’t tell you the direction, so you’ll need another tool to figure out if it’s up or down |
| MACD (Moving Average Convergence Divergence) | Detects shifts in momentum and flags potential trend reversals | Watch for crossover and divergence signals to catch momentum swings and decide when to buy or sell | Gives you a peek into both trend strength and momentum, which is like having two indicators in one | Can throw out false alarms if the market is choppy, so be ready for some noise every now and then |
| Volume | Confirms whether price moves have some real backing behind them | Rising volume often supports a trend’s strength, while fading volume might be whispering that a reversal is on the horizon | Adds an extra layer of confidence to your trend analysis, making your trades feel that much safer | Volume data isn’t always rock solid and can sometimes be a bit flaky depending on the market you’re in |
| Support & Resistance | Highlights key price levels where the market tends to stall or bounce | Use these to pinpoint likely spots where trends might keep rolling or suddenly reverse course | Simple, essential, and gives you a solid handle on managing trades and setting stops | Can be a bit of a guessing game since different traders might draw these levels in slightly different places |
Moving averages like simple (SMA) and exponential (EMA) are great for smoothing out wild price swings. They help uncover the underlying trend beneath. Traders watch whether prices cling above or dip below certain moving averages. They get especially interested when the 50-day line crosses the 200-day.
The ADX gauges just how strong a trend is regardless of its direction. Once the ADX rises above 20 or 25, it is often a sign that a solid trend is taking shape. This makes it quite handy for avoiding those frustrating, choppy sideways markets we all love to hate.
The MACD indicator is a handy tool traders often use to spot momentum shifts by watching how two moving averages typically the 12-day and 26-day EMAs draw closer or drift apart. When the MACD line nudges above the signal line it usually hints at a bullish trend, while slipping below can flag potential short-selling opportunities.
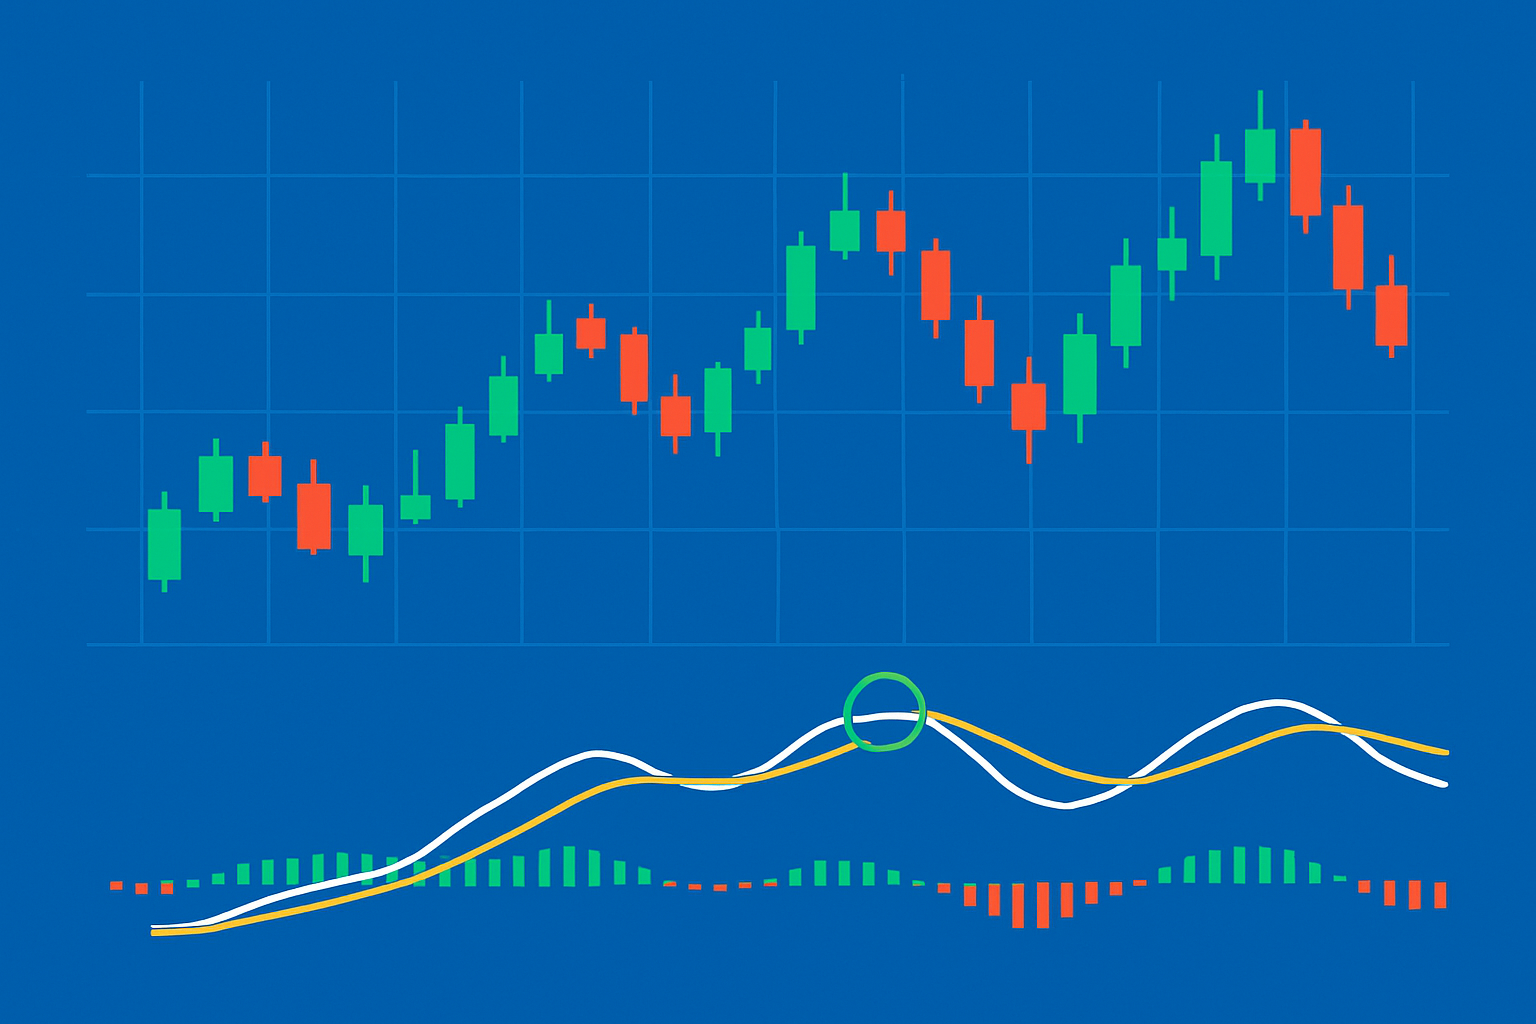
Example of a trading chart illustrating MACD crossovers signaling potential buy and sell points.
Kick things off by picking the market and timeframe that jive with your lifestyle and trading style.
Keep an eye out for trends by mixing technical indicators with price action patterns because this combo gives a clearer picture of which way the wind is blowing.
Lay down solid ground rules for jumping into trades like having concrete signals and confirmation steps.
Figure out your stop loss and take profit points by factoring in volatility, your comfort with risk and important support or resistance zones. This step can save you serious heartache.
Stay glued to your open trades by monitoring momentum, volume and price moves.
Every so often take a moment to review how your trades have fared and don’t be shy about tweaking your strategy to improve consistency and overall performance. It makes a world of difference.
Following these steps carefully gives traders a clear and steady approach to trend trading that strikes a balance between chasing potential gains and keeping risk in check.
Successful trend trading really boils down to mastering risk management so you can shield your capital and keep profits coming in steadily over the long haul. Key ingredients to nail here are how you size up your positions and where you smartly drop your stop losses. You also need to juggle trades to cut losses short while giving your winners plenty of breathing room to run.
"When it comes to trend trading, managing losses usually takes the spotlight rather than chasing those elusive big wins. Protecting your capital isn’t just smart—it’s what keeps you in the game long enough to see what happens next." – Trading Strategy Expert
Trend trading definitely has a few hurdles to clear. Traders often find themselves tossed around by whipsaw price swings or chasing false breakouts. Sometimes they jump in a tad too late while wrestling to keep their emotions in check.
Taking a close look at real trend trades shows how strategy and decision-making play out in the trenches. The annotated charts walk you through how traders spotted entry points and wrestled with their open positions before smartly executing their exits.
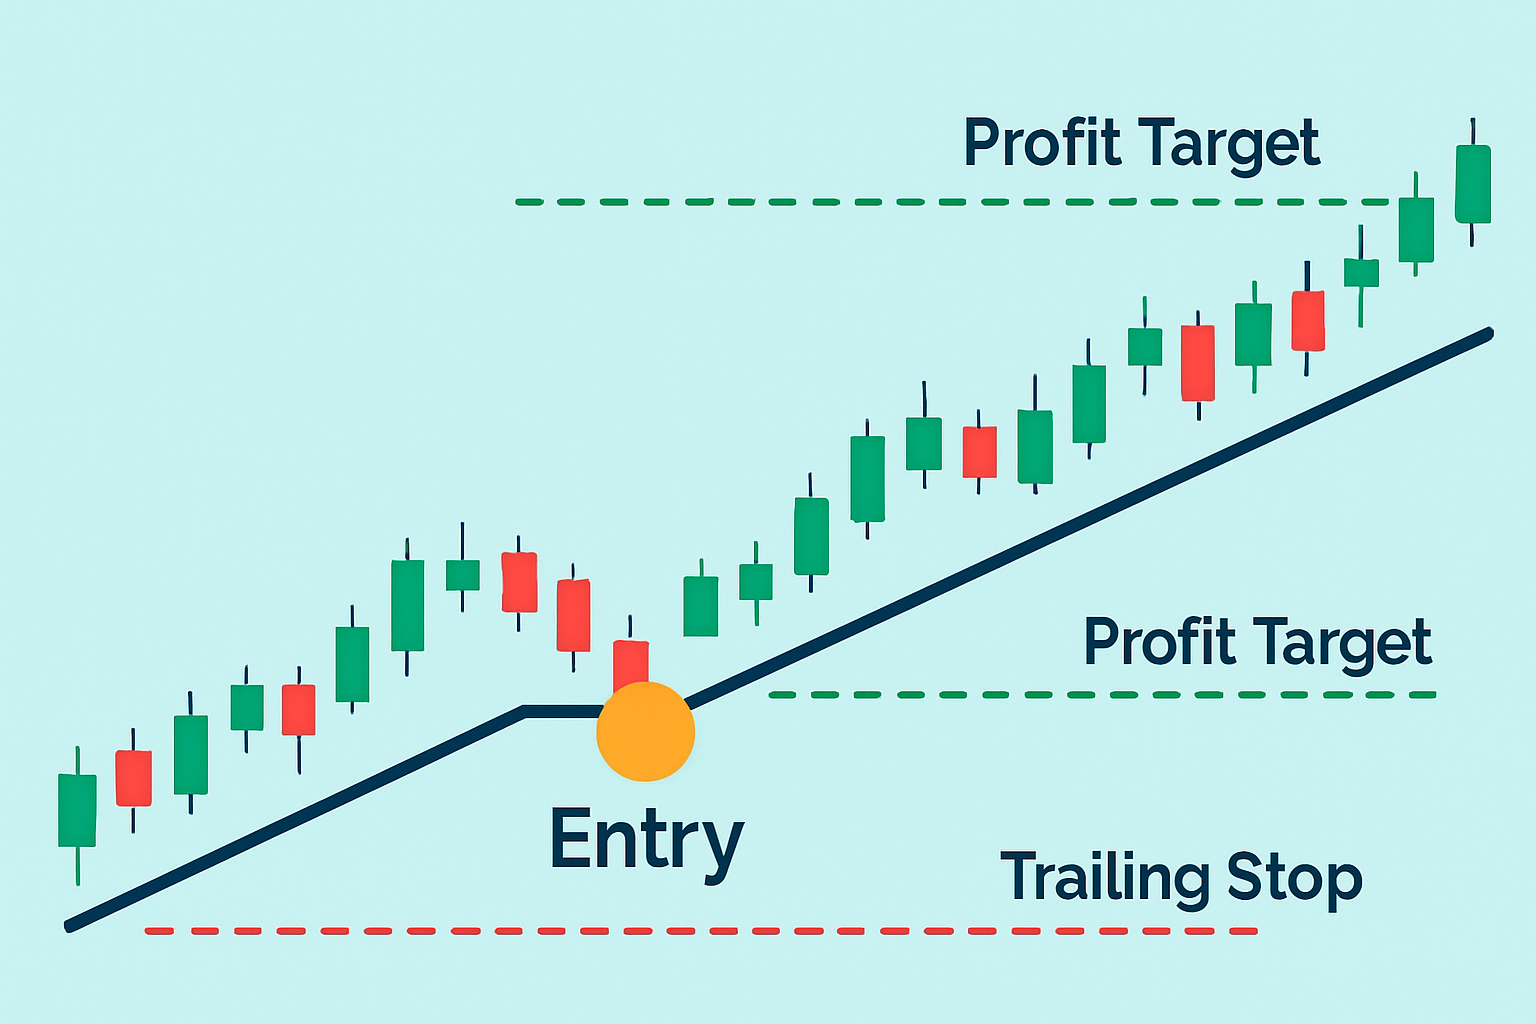
Annotated chart illustrating a successful trend trade highlighting entry, stop loss adjustments, and exit points.
Experienced traders often sharpen their trend trading game by using advanced techniques like analyzing multiple timeframes and mixing trend and breakout strategies while incorporating volume profile data.
Traders who are just getting their feet wet with trends should develop a solid trading strategy by starting with careful risk management and picking liquid markets that won’t leave them hanging. They should also make good use of demo accounts to get some practice under their belt. Keeping a thorough trading journal is also a game changer.

Struggling to improve your trading performance? Edgewonk's advanced analytics tools are designed to give you the edge you need.
With detailed trade journaling, robust strategy analysis, and psychological insights, you'll gain a comprehensive understanding of your strengths and weaknesses. Don't miss out on this game-changing opportunity.

19 posts written
Master trade patterns with TrendSpider’s AI-powered tools. Learn expert tips to spot key formations,...
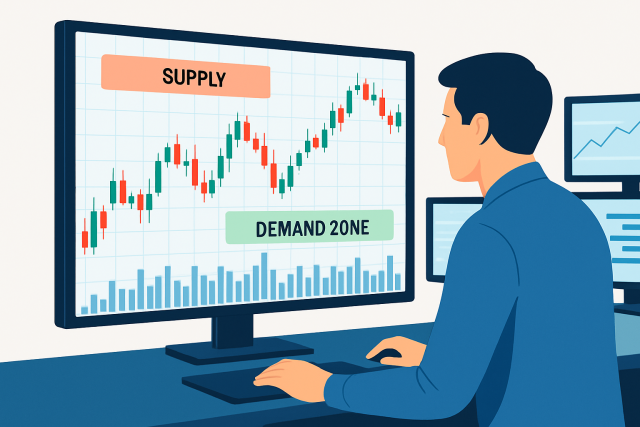
Unlock expert supply and demand trading tips proven to improve your market timing, entry strategies,...

El Salvador's adoption of Bitcoin as legal tender marks a groundbreaking experiment in national curr...

Unlock the power of the head and shoulders pattern with this complete guide. Learn to spot, trade, a...