


Technical Analysis
Understanding the Bullish Harami Candlestick Pattern
Discover the bullish harami candlestick pattern—a key technical signal that can hint at trend revers...

This guide breaks down how to trade the head and shoulders pattern effectively across various markets making it easier than ever to spot and act on these setups.
The head and shoulders pattern is a classic staple in the world of technical analysis, often waving a red flag for a potential trend reversal. You’ll find this formation popping up across a variety of markets, acting like a trusty signal for traders looking to catch those pivotal price moves.
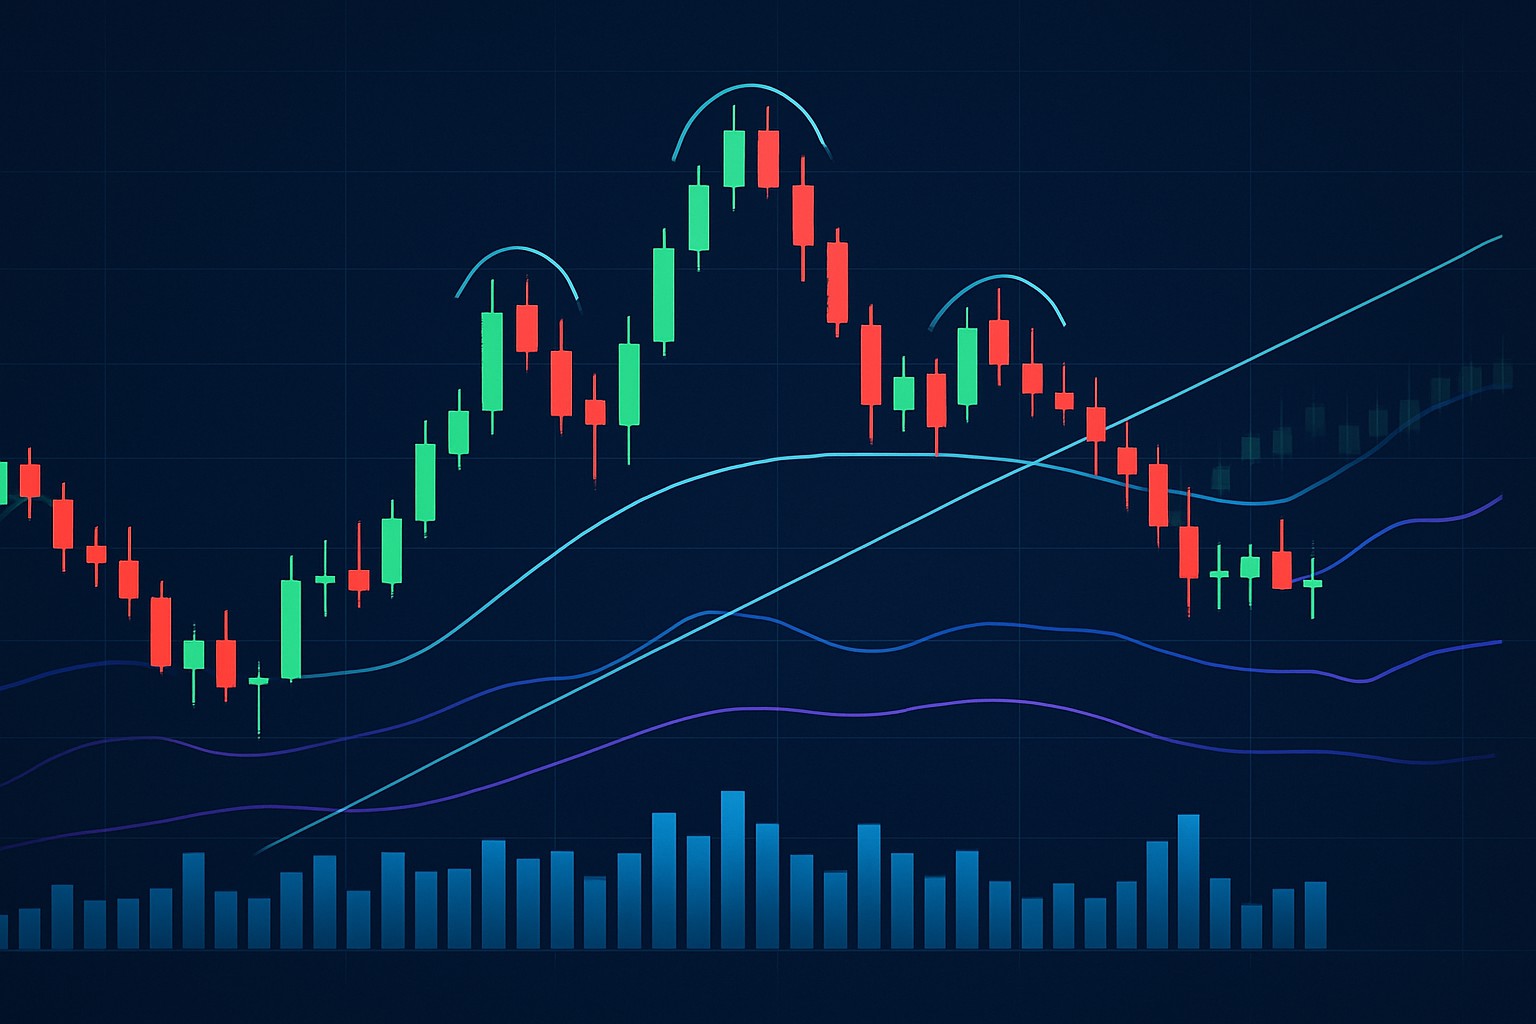
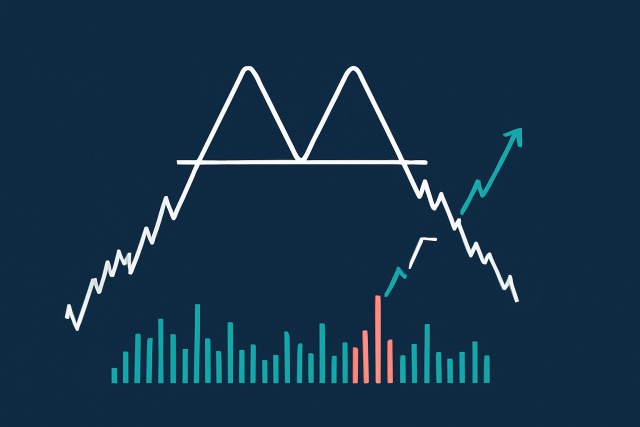
The head and shoulders pattern features three peaks: two smaller shoulders flanking a taller middle peak called the head. There’s a neckline connecting the lows of the shoulders that acts as a vital support or resistance level. Typically, you’ll notice the volume tapering off as the pattern forms and surging when the breakout happens.
There are basically two main flavors of this pattern. The standard head and shoulders typically signals a bearish reversal after an uptrend, kind of like the market’s way of telling you it’s time to step back. On the flip side the inverse head and shoulders usually hints at a bullish reversal following a downtrend and gives traders a hopeful nudge that things might be turning around.
When it comes to trading, spotting a head and shoulders pattern can feel like finding a secret handshake among charts. This classic formation often gives traders a subtle nudge—hinting at potential trend reversals before they fully unfold. While it is not a crystal ball, I have found that keeping an eye on this pattern can really save you from unwelcome surprises. It’s like the market is whispering a warning, if you know how to listen closely.
The head and shoulders pattern has earned its stripes as a reliable indicator of trend reversals. It shines a light on weakening momentum, offering traders a valuable heads-up to tweak their positions ahead of some potentially significant price swings.
"The head and shoulders pattern isn’t foolproof by any means, but it usually shines a light on critical reversal points. That’s why it’s still a favorite in the toolbox of many seasoned technical traders. Of course, it demands a fair bit of patience and solid confirmation to avoid getting tripped up by those pesky false signals." — Jane Morgan, Senior Technical Analyst
The head and shoulders pattern appears in stocks, forex, cryptocurrencies and commodities but it shows slightly different faces due to unique forces in each market. Stocks tend to offer clearer volume signals which makes things more straightforward. Meanwhile, forex markets often follow broader economic trends. Cryptocurrencies have wild swings that keep even seasoned traders on their toes. Commodities respond to supply and demand shifts in ways that can keep you guessing.
| Market | Pattern Characteristics | Volume Behavior | Volatility Level | Common Influencing Factors |
|---|---|---|---|---|
| Stocks | Head and shoulders usually stand out with pretty clear peaks and valleys that you can’t miss | Volume tends to dip during the shoulders and then leaps at the breakout, like it just can’t wait to show up | Moderate | Company earnings, news, overall market sentiment — the usual suspects steering the ship |
| Forex | Patterns often pop up on shorter timeframes and can sometimes feel a bit fuzzy around the edges | Volume is less of a trusty sidekick here, so traders keep their eyes glued to price action instead | Low to Moderate | Economic data, central bank decisions — the heavyweight champs in this ring |
| Cryptocurrencies | Patterns can flash by in no time and may look a bit wonky thanks to wild volatility | Volume often shoots up dramatically but also loves to keep us guessing with sudden swings | High | Market sentiment, tech developments, regulations — a rollercoaster combo |
| Commodities | Patterns get their shape from geopolitical drama and inventory report releases | Volume shifts frequently, often dancing to the tune of seasonal trends | Moderate | Supply and demand, geopolitical influences — the driving forces behind the scenes |
Mastering the head and shoulders pattern calls for a careful and steady approach. It is all about catching the pattern early and double-checking that breakout with solid volume. You also need to set clear price targets and stay sharp on risk management.
Take a good, careful look at the chart and pick out the classic pattern of two shoulders with a head right in the middle.
Be patient and wait for a clear breakout below the neckline (or above it if you’re dealing with an inverse pattern), preferably when the volume decides to make some noise.
Measure the vertical distance from the head down to the neckline and use that as a realistic and handy profit target.
Jump into the trade only after the breakout candle has confidently closed beyond the neckline.
Place a stop-loss just above the right shoulder (or below it for an inverse) to keep your risk in check.
Tweak your position size based on your personal risk tolerance and how wild the market mood feels.
Entry triggers tend to work best when they are given a thumbs-up by price action and volume, which really helps to separate the wheat from the chaff when it comes to breakouts. Throwing in a couple of trusty indicators like the Relative Strength Index (RSI) and Moving Average Convergence Divergence (MACD) can sharpen your timing quite a bit by spotlighting shifts in momentum.
Placing stop-loss orders just beyond the point where the pattern breaks down is a smart move to shield your capital from sudden reversals. Meanwhile, take-profit levels usually get pegged by measuring the height of the pattern. This gives you a solid target to aim for. Setting exit points that reflect what the pattern suggests can help lock in your gains and keep you from biting off more risk than you can chew.
Boosting profitability with head and shoulders patterns often involves teaming them up with other analysis tools like trendlines to double-check the pattern. Moving averages help get a sense of where the trend is heading and volume analysis ensures that breakout really means business.
While the head and shoulders pattern often does its job nicely, it can occasionally throw a curveball. This tends to happen when the price creeps back above the neckline after a breakout, or slips below it in the inverse pattern—especially if the volume isn’t backing up the move. Catching these early warning signs can save you from some pretty painful mistakes. It’s best for traders to hold their horses and avoid jumping into trades before the pattern is crystal clear and fully formed.
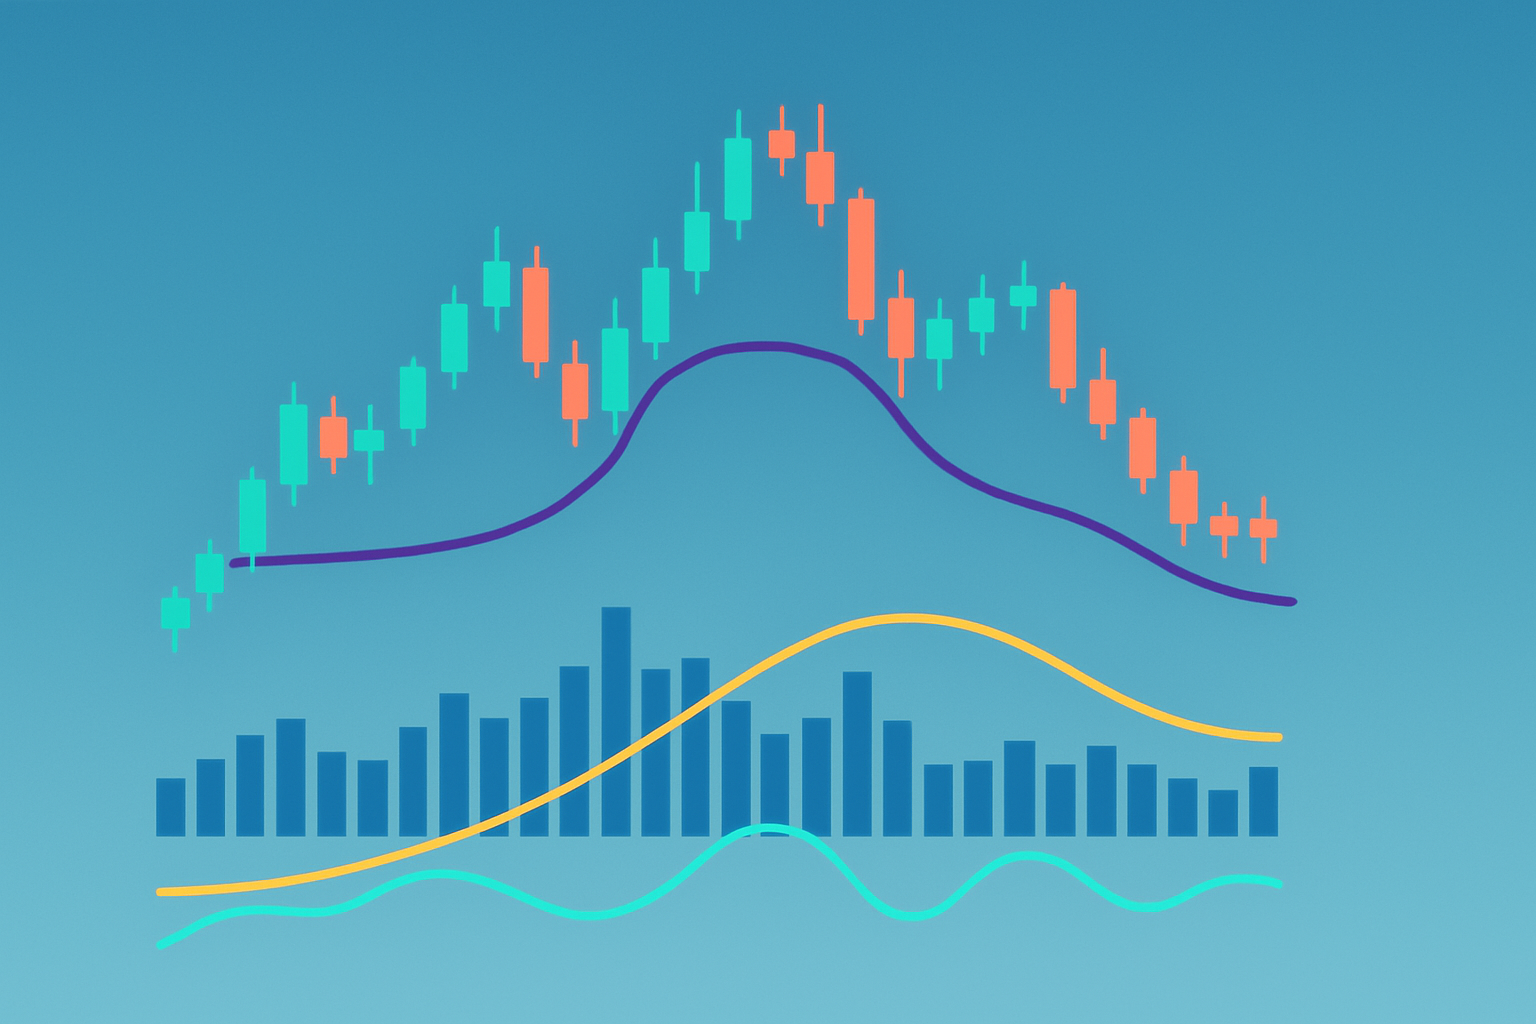
Example of a classic head and shoulders pattern with volume trend confirming the breakout.
Traders often get tripped up by misreading the pattern, especially when their analysis is a bit off or emotions sneak into the decision-making process. Losses tend to pile up from shaky risk management—think stop-losses that are set way too loosely or completely ignoring volume confirmation, which is like skipping the fine print.
Discipline and emotional control truly go hand in hand when dealing with head and shoulders patterns. I have found that sticking to the pattern rules and patiently waiting for clear confirmation is key—jumping in too quickly, especially when fear or greed are waving their flags, usually leads to trouble. — Michael Tran, Veteran Technical Trader
Real trades really show how head and shoulders patterns can play out differently depending on the market context. For instance, a head and shoulders pattern on a Nasdaq stock led to a sharp sell-off once the neckline breakout got the thumbs-up from volume. On the flip side, in the wild world of cryptocurrency markets a misread inverse pattern sparked a false breakout.
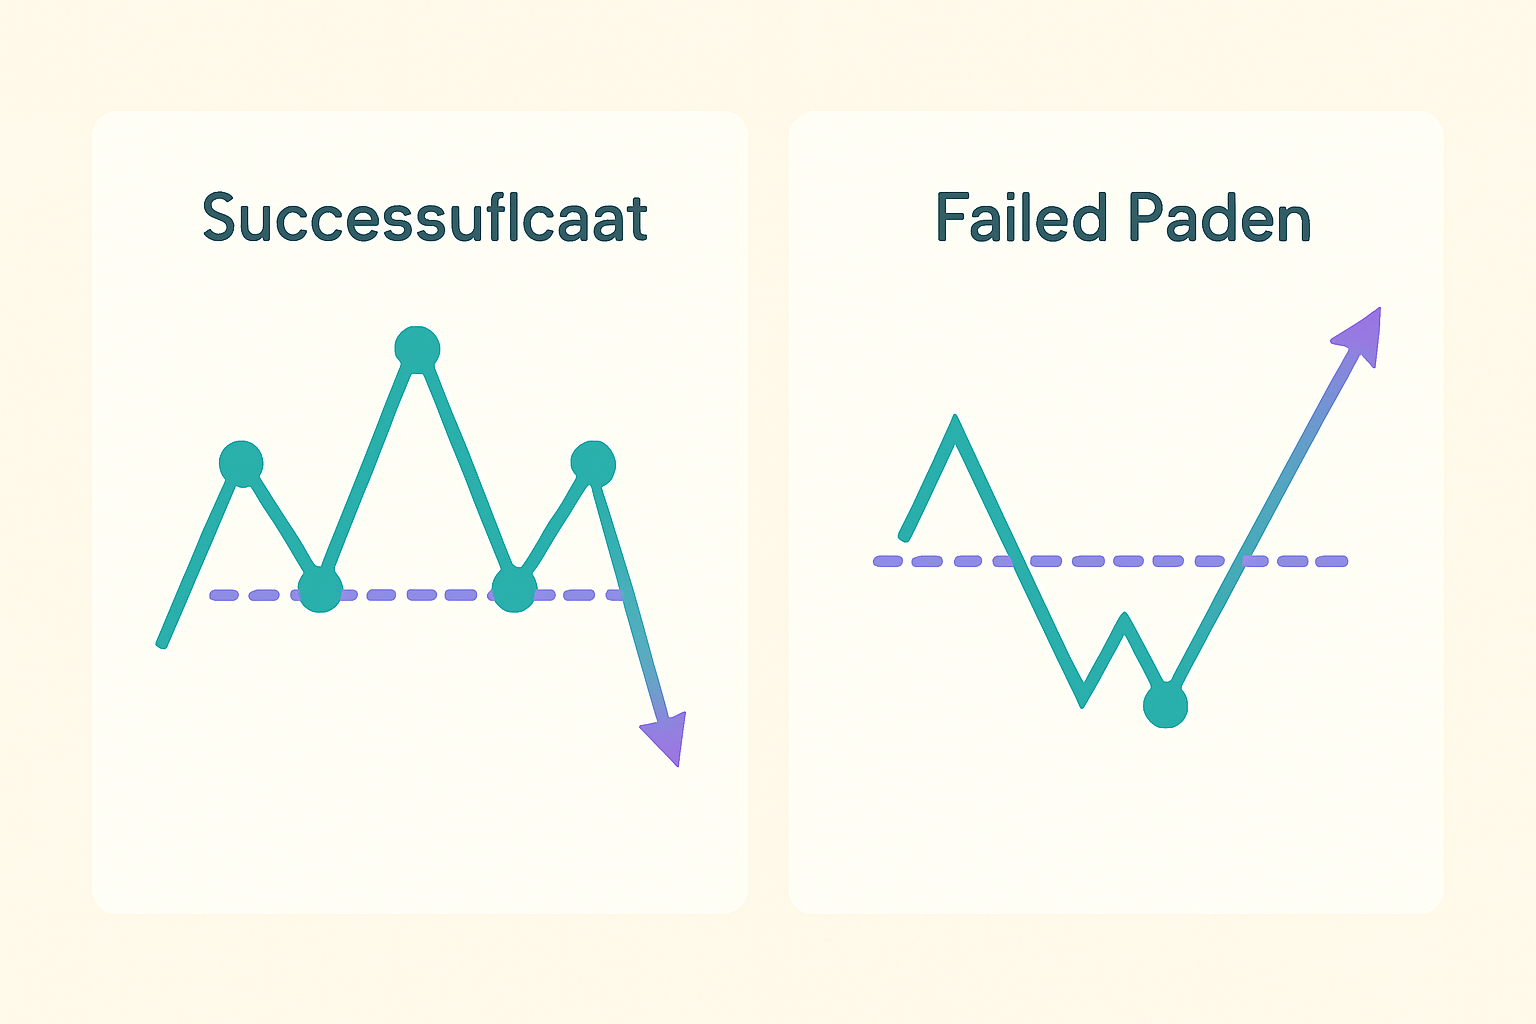
Comparison illustrating successful and failed head and shoulders trade setups in different market environments.
Taking a closer look you will often find that the winning trades showed clearly defined shoulders and head with volume ramping up around the breakout moments. Traders typically jumped in only after the neckline was broken with conviction and placed their stop-loss orders with care because no one likes surprises in the market. On the flip side the trades that didn’t pan out tended to have muddled patterns and lacked vital volume backing which usually ended in frustrating whipsaws.
Trading head and shoulders patterns usually plays out a bit smoother when you lean on advanced charting tools like TradingView, or AI-driven platforms such as TrendSpider. These handy tools bring powerful analytical features to the table, along with custom alerts and the ability to peek across multiple timeframes.

Are you tired of juggling multiple tools for your trading needs? TradingView is the all-in-one platform that streamlines your analysis and decision-making.
With its powerful charting capabilities, real-time data, and vibrant community, TradingView empowers traders like you to stay ahead of the market. Join thousands who trust TradingView for their trading success.

19 posts written
Discover the bullish harami candlestick pattern—a key technical signal that can hint at trend revers...
Discover how the double top pattern signals potential trend reversals in trading. Learn to identify,...

Master the hammer candlestick pattern—a key indicator for market reversals. This beginner-friendly g...

Discover what IOUs mean in finance, their role as informal debt acknowledgments, and how understandi...