


Technical Analysis
How to Spot a Hammer Candlestick in Trading Charts
Master the hammer candlestick pattern—a key indicator for market reversals. This beginner-friendly g...

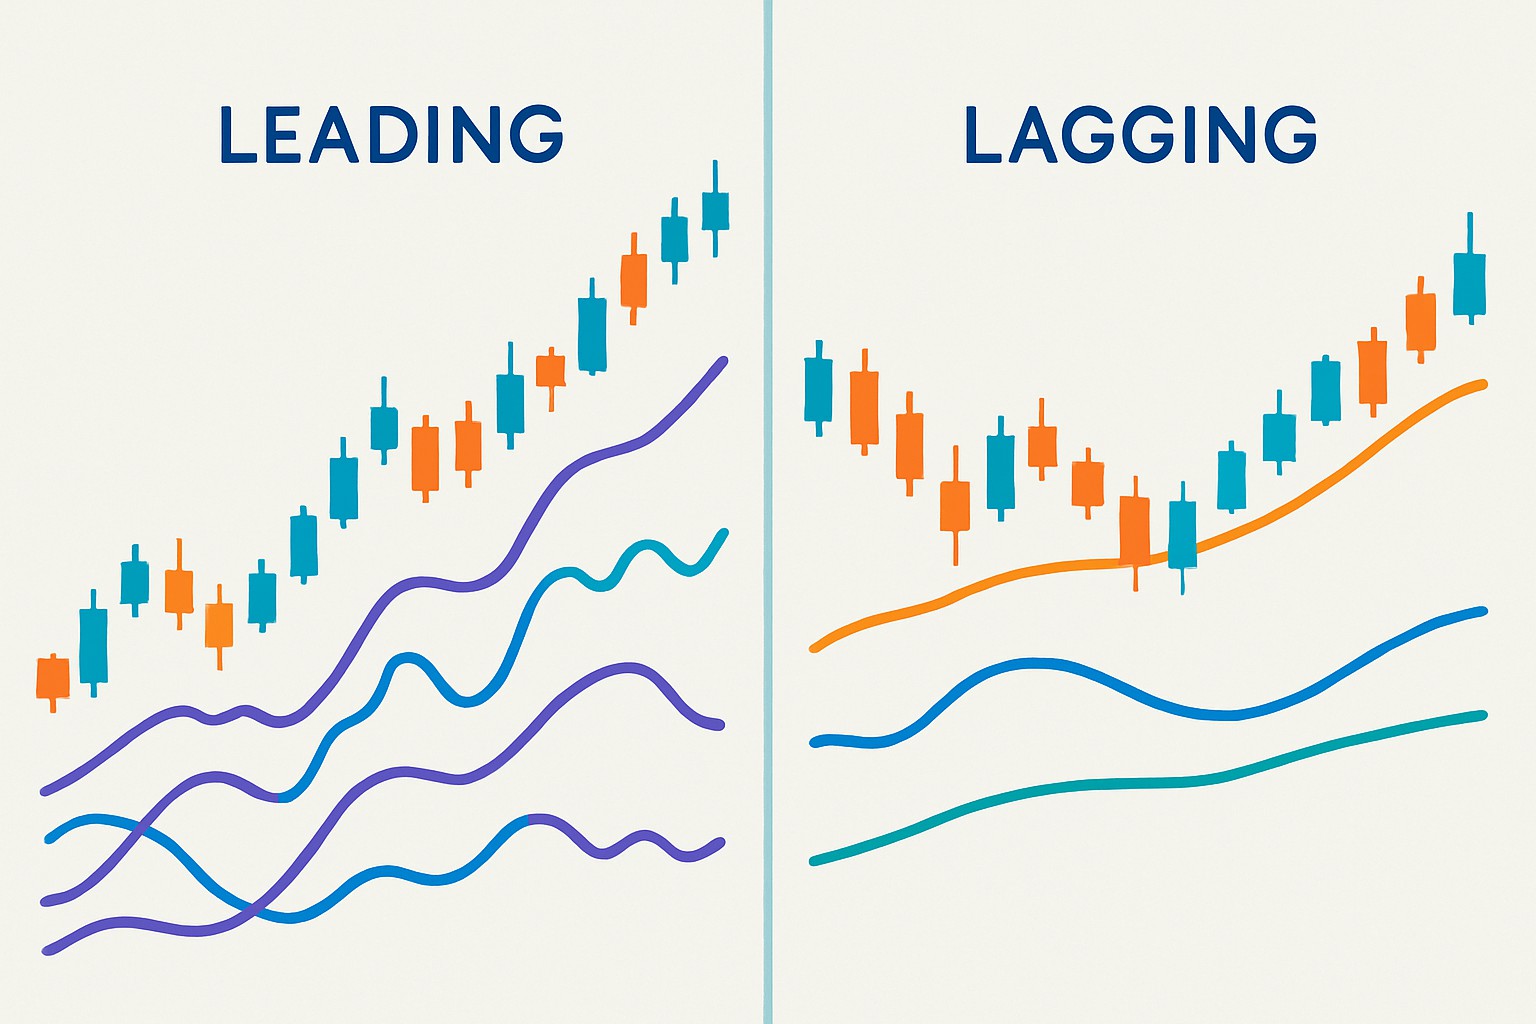
Knowing when to lean on leading or lagging indicators can be a real game-changer for traders and analysts who swear by technical analysis to nail their entries and exits just right.
Leading and lagging indicators are handy tools in technical analysis that offer trading signals based on price data and market activity. Leading indicators attempt to predict future price movements by giving early heads-ups. Lagging indicators play the role of the cautious friend who only chimes in once trends have already begun.
Leading indicators often give you a heads-up on new trends or reversals before they happen. This can be a double-edged sword because it offers the chance for bigger rewards but also increases the odds of false alarms. Lagging indicators tend to play it safe by confirming a trend only after it’s well underway. This makes them more reliable but a bit slower on the draw.
| Attribute | Leading Indicators | Lagging Indicators |
|---|---|---|
| Signal Timing | Tend to give you a heads-up before the price actually moves | Typically show signals after the price trend has already taken shape |
| Typical Use Cases | Great for spotting possible reversals and getting in early | Best for confirming trends and figuring out when it’s time to exit |
| Risk of False Signals | Usually higher since they try to predict moves before they happen—kind of like jumping the gun | Generally lower and a bit more reliable, but the signals do lag behind |
| Common Examples | RSI, Stochastic Oscillator, MACD Signal Line | Moving Averages (SMA, EMA), Bollinger Bands, MACD Line |
| Interpretation | Used to anticipate market moves, often calling for a careful eye and some prudence | Used to confirm trends, helping you avoid jumping the gun too soon |
Leading indicators can be a real lifesaver for traders trying to catch trend changes before they unfold. Among the usual suspects, the Relative Strength Index (RSI) stands out by flagging when assets might be overbought or oversold. It acts like a helpful nudge from the market saying "Hey, maybe slow down or pick up the pace." The Stochastic Oscillator tracks shifts in momentum as if reading the market's mood swings. The MACD signal line often steps up as a leading player by hinting at potential crossovers that could mark reversals.
Lagging indicators really shine when you are looking to confirm trends that have already settled in and help traders avoid the classic pitfall of jumping the gun during choppy unpredictable market swings. Take Moving Averages for example—they smooth out wild price ups and downs so the big picture trend pops into focus clearly. Then there are Bollinger Bands which keep an eye on volatility and give you a nudge about whether a trend is still holding strong or might be losing steam.
Leading indicators can be a real lifesaver in markets where jumping in or out early gives you a leg up. This is especially true in volatile markets or when prices move sideways within ranges. They help traders catch potential turning points before the crowd blinks. However, their early signals sometimes turn out to be false alarms.
Use leading indicators in volatile or range-bound markets because having a heads-up on potential reversals can really give you an edge when it comes to timing your moves.
Lean on them especially if your trading style revolves around jumping in or out early, as this can seriously bump up your chances of locking in profits.
Never forget to pair them with solid risk controls like stop losses. These indicators tend to throw off false signals more often than you would like, so it’s best to keep a safety net in place.
Lagging indicators tend to shine brightest in trending markets, where they quietly confirm momentum that’s already built up steam and help you avoid the rookie mistake of jumping aboard too soon. They do a great job cutting down on false alarms by waiting patiently for trends to really get their act together
Use lagging indicators in strong trending markets to help confirm that the price movement is reliable before making a trade—think of them as a second opinion you can usually trust before diving in.
These indicators tend to work well for traders who want to protect their capital and avoid the all-too-common pitfall of jumping in or out a bit too early.
Lagging indicators can also be a handy tool for managing trades by spotlighting smart exit points and backing up your ongoing trend analysis, making the whole process feel a little less like guesswork.
Many traders have found that blending leading and lagging indicators often leads to better results. You catch potential entry points early while leaning on trend-following tools to back up your hunches. This approach strikes a nice balance between jumping in quickly and keeping things dependable.
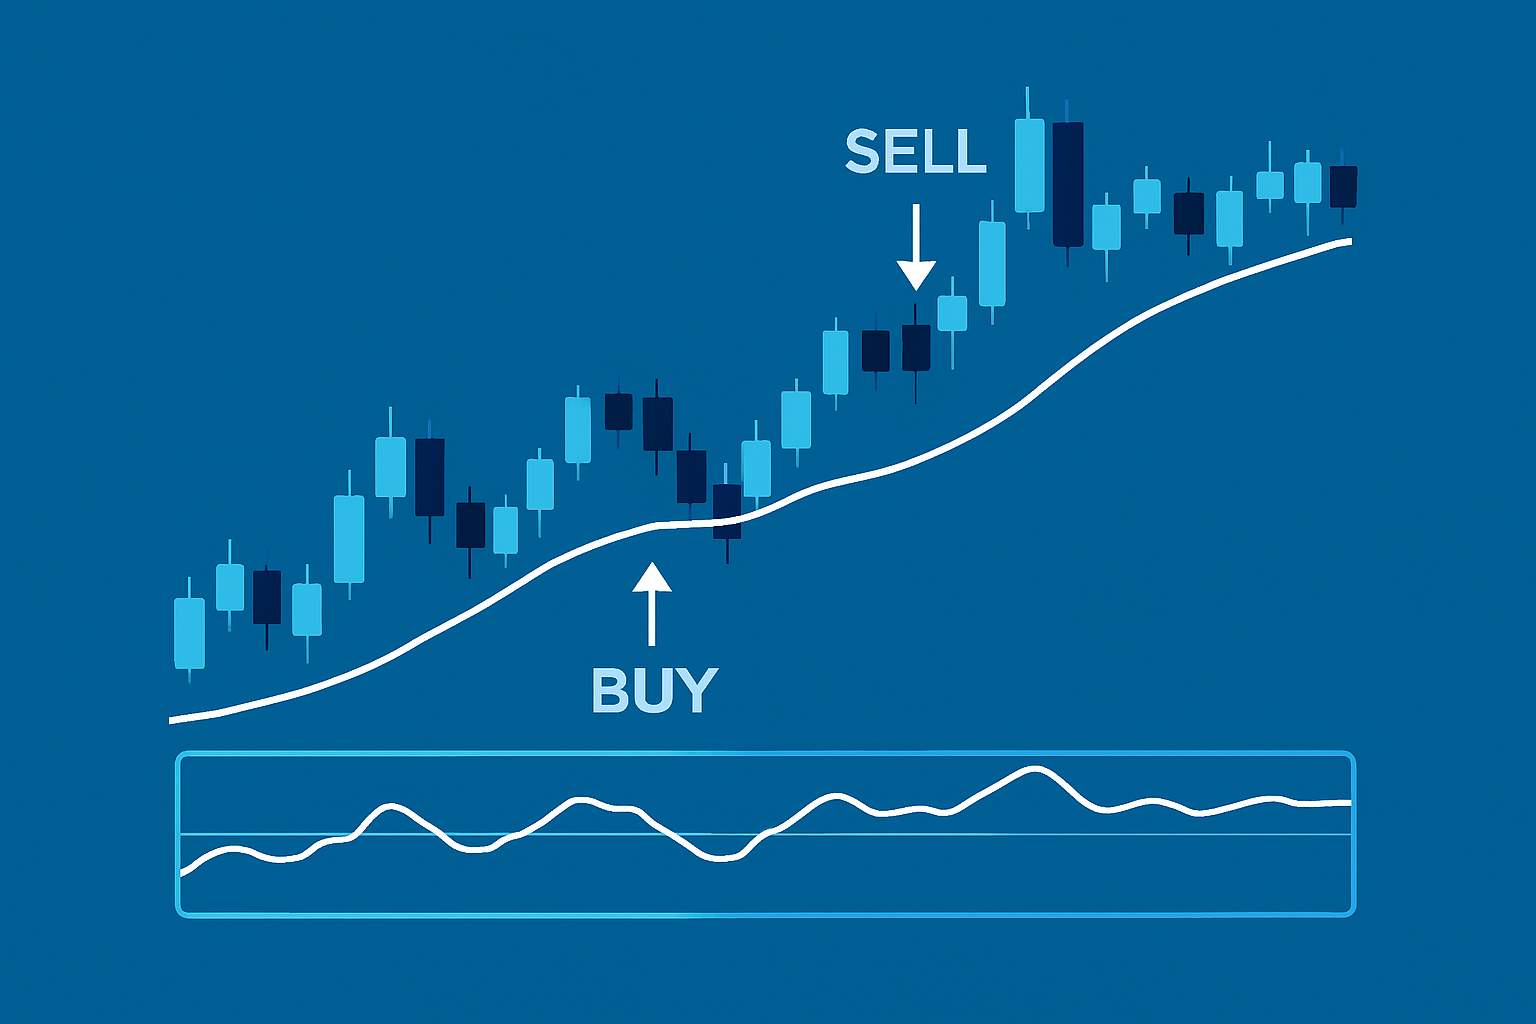
Visual example illustrating the combined use of leading and lagging indicators during a trading decision
Picking the right indicators really boils down to understanding leading vs lagging indicators, your trading style, and the market you are navigating. It also depends on how much risk you’re willing to stomach. I’ve found that trying different indicators on past data while mixing in some fundamental insights can really sharpen your decision-making.

Struggling to improve your trading performance? Edgewonk's advanced analytics tools are designed to give you the edge you need.
With detailed trade journaling, robust strategy analysis, and psychological insights, you'll gain a comprehensive understanding of your strengths and weaknesses. Don't miss out on this game-changing opportunity.

20 posts written
Master the hammer candlestick pattern—a key indicator for market reversals. This beginner-friendly g...

Learn how the harami candlestick pattern signals potential market reversals. This guide breaks down...

Unlock the power of the head and shoulders pattern with this complete guide. Learn to spot, trade, a...

Unlock the power of candle patterns to decode market psychology and improve your trading precision....