


Technical Analysis
Master the Bear Flag Setup
Unlock the power of the bear flag pattern with our practical, step-by-step guide. Understand market...

Order blocks hold a pretty important spot in technical analysis, helping traders pinpoint those key price levels where the big financial players usually drop their hefty buy or sell orders.
An order block highlights a specific spot on a price chart where big institutional players have dropped some serious buy or sell orders. It’s not your run-of-the-mill support or resistance—order blocks reveal where the heavy hitters have made their presence known, often steering the price action that follows.
People often mix up order blocks with usual support or resistance levels or with supply and demand zones. But here’s the thing: order blocks stand apart because they highlight areas where big players and institutions are actually buying or selling—not just the usual ebb and flow caused by retail traders. Grasping this important difference lets traders zero in on zones that truly steer the market’s direction.
Order blocks form through a series of deliberate moves by institutional traders aiming to slip in or out of hefty positions without causing a big fuss in the price. Typically this means collecting orders at prices that favor them and quietly building up liquidity. They then nudge the price in the direction they want to seal the deal and lock in gains.
They feel comfortable ramping up or dialing down hefty positions.
They tend to gather orders in these zones, which usually results in the price dancing sideways or getting stuck in a range for a bit.
A quick price pullback to weed out the weaker hands and test how much liquidity is really out there.
Once the price finally breaks free from this zone, it’s usually a crystal-clear sign that institutions are actively flexing their muscles and making their intentions known.
An order block often feels like a clever buyer quietly sneaking in and building a big position at just the right prices, all while keeping a low profile. Then, once they have locked it in, they slowly nudge the price upward, almost like they’re coaxing it along rather than forcing it.
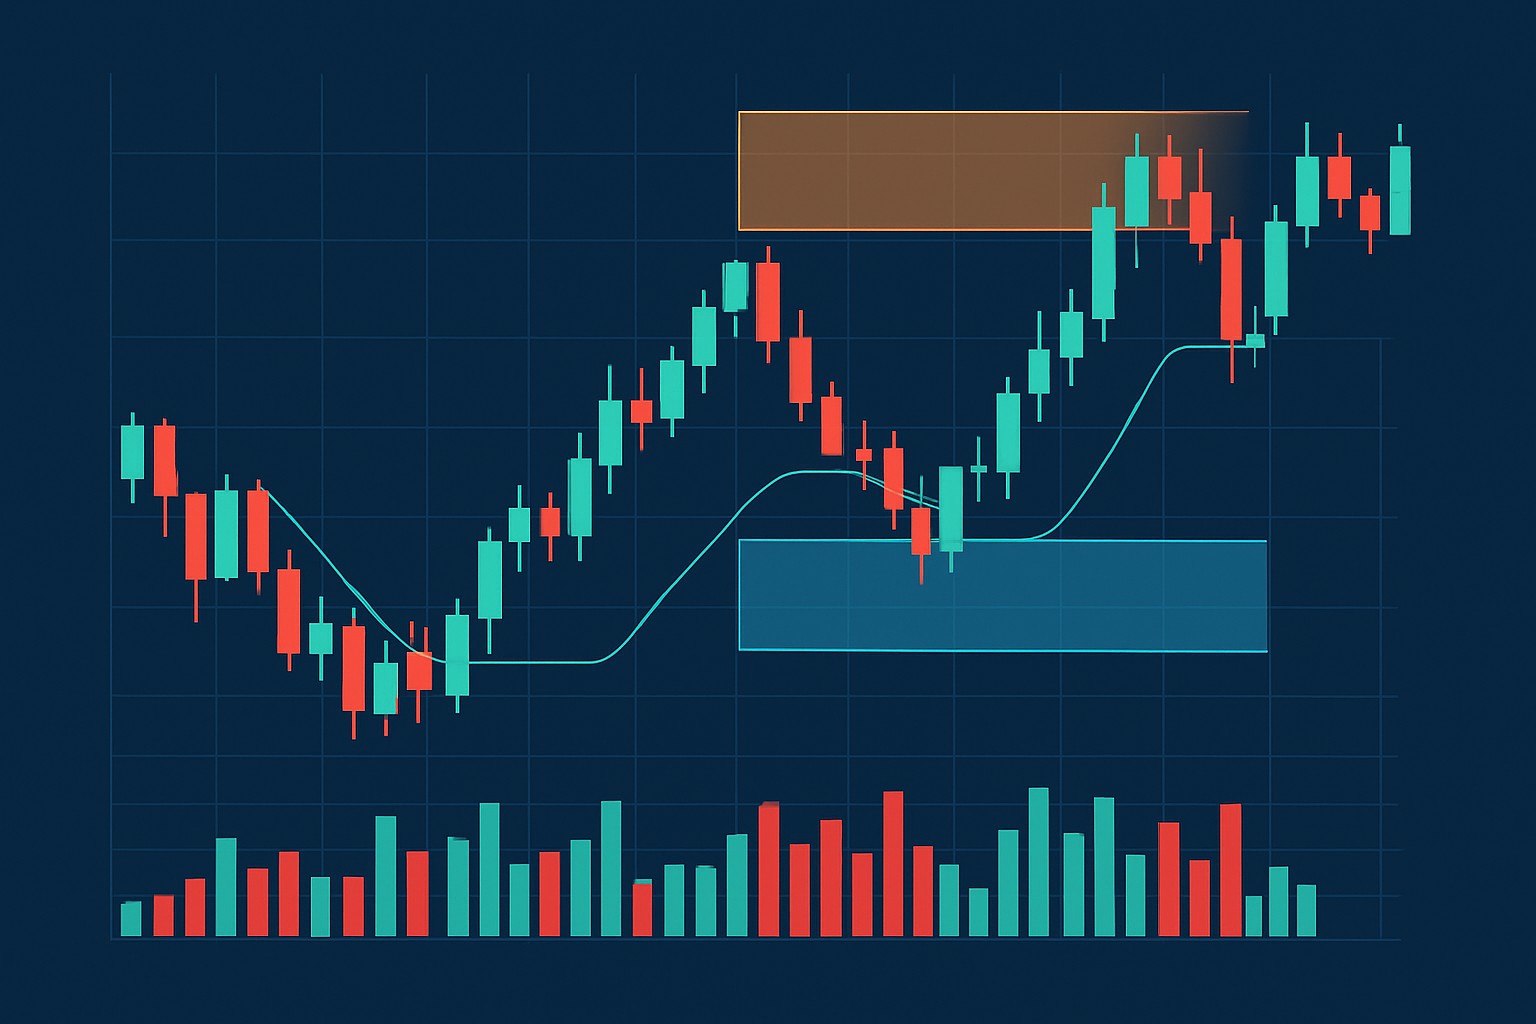
Spotting order blocks involves traders keeping an eye out for clusters of consolidation candles where the price takes a breather, often marked by long rejection wicks and noticeable surges in trading volume.
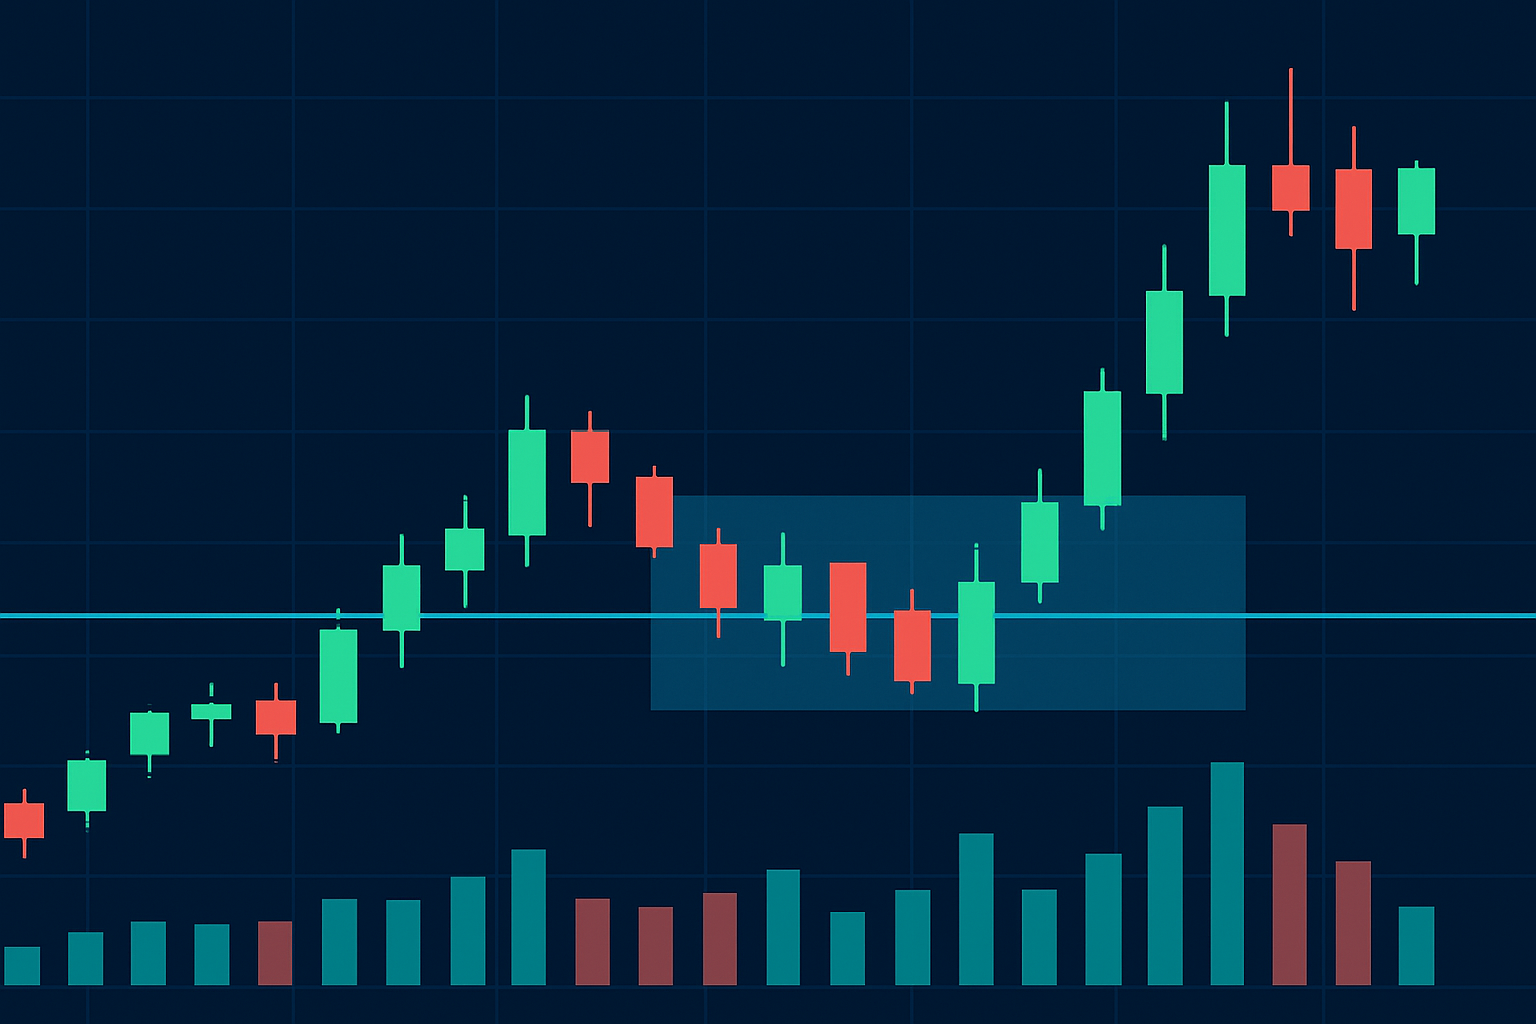
Example of an order block formation on a candlestick chart with key volume and price action indicators marked.
Telling real order blocks apart from false signals often requires a good deal of patience and a careful double-check or two. Traders should avoid confusing short-term consolidations with genuine order blocks by holding their horses until there is a clear breakout supported by robust volume. Tools like TradingView come in handy here, boasting advanced charting features with customizable indicators and volume overlays that make these patterns a bit easier to spot.
Order blocks reveal the behind-the-scenes moves of major market players giving traders a leg up when it comes to spotting potential trend reversals or powerful breakouts before they actually happen. By tuning into these patterns, traders can uncover smarter opportunities to jump in or out of trades with a bit more confidence and sharper timing.
Using order block analysis brings a fresh, thoughtful layer to the whole trading psychology game. Knowing where the big players make their moves can really help traders keep their cool and hang tight, smoothing out those pesky emotional reactions to wild price swings. When it comes to strategy, it nudges you toward disciplined trading with clear plans and controlled risk—aiming to squeeze the most out of potential rewards.
| Pattern Type | Purpose | Origin | Key Features | Best Use Case |
|---|---|---|---|---|
| Order Blocks | Pinpoint spots where the big players are buying and selling | Large institutional orders | Noticeable price clusters paired with volume spikes and footprints from institutions | Nail down entries and exits with a high degree of confidence |
| Supply & Demand Zones | Find those juicy imbalance areas where buyers and sellers clash | Market liquidity gaps | Areas where price tends to sharply reverse or suddenly zoom | Perfect for catching short-term reversals and breakout moves |
| Support & Resistance Levels | Key price points where the market tends to take a breather or push back | Past price movements | Horizontal or diagonal lines that act as psychological speed bumps | Great for getting the bigger picture of market structure |
| Candlestick Patterns | Get ahead of short-term price moves with classic shapes | Price action and trader behavior | Easily recognizable shapes like pin bars and engulfing candles | Handy for timely signals on entries and reversals |
Order blocks give a fascinating peek behind the curtain of institutional moves, though they really shine when paired with other techniques like supply and demand zones or candlestick patterns. Blending these methods can seriously boost trading accuracy
Traders often lean on order block analysis across different trading styles like day trading, swing trading or position trading. They tweak their entry and exit points based on how clear those order blocks appear and the timeframe they’re working with.
Spot order blocks on a higher timeframe chart where you’ll often find those big institutional players making their moves.
Dial down to a lower timeframe and look for confirmation through price action and volume to help you zero in on those precise entry points like a pro.
Place your entry orders right near the edge of the identified order block to catch the momentum just as it’s about to kick in.
Set your stop-loss orders just outside the opposite side of the order block. Think of it as a safety net to keep potential losses from spiraling.
Pick your take-profit targets based on previous support or resistance levels or lean on Fibonacci levels as a solid way to lock in your gains without second-guessing yourself.
Managing risk is absolutely important when you are trading around those order blocks. Even if you’ve got solid institutional signals in your corner, it’s a smart move to always set stop-losses—think of them as your safety net against those pesky false breakouts or unexpected market swings.
Traders usually like to double-check order block signals with a handful of indicators, and they never forget to verify them in the correct timeframe.
Advanced charting platforms like TradingView and TrendSpider come packed with a handy suite of tools that make order block analysis a bit less daunting. You’ll find everything from versatile drawing options to volume filters and even pattern recognition baked right in. These platforms let traders easily spot and track order blocks across various timeframes.
Beyond relying on software traders often broaden their horizons by diving into specialized books and online courses. They also join vibrant trading communities focused on institutional trading concepts and order block strategies.

Are you tired of juggling multiple tools for your trading needs? TradingView is the all-in-one platform that streamlines your analysis and decision-making.
With its powerful charting capabilities, real-time data, and vibrant community, TradingView empowers traders like you to stay ahead of the market. Join thousands who trust TradingView for their trading success.

17 posts written
Unlock the power of the bear flag pattern with our practical, step-by-step guide. Understand market...

Master the hammer candlestick pattern—a key indicator for market reversals. This beginner-friendly g...

Unlock the power of the head and shoulders pattern with this complete guide. Learn to spot, trade, a...

Discover the bullish harami candlestick pattern—a key technical signal that can hint at trend revers...