


Technical Analysis
What is a Harami Pattern? Breaking It Down
Learn how the harami candlestick pattern signals potential market reversals. This guide breaks down...

Candlestick charting is a cornerstone technique in technical analysis, and having a candlestick cheat sheet can help traders decode detailed visual clues that reveal what the market is really up to.
This article serves up a straightforward candlestick cheat sheet, brimming with handy tips and expert techniques that traders can jump on right away to sharpen their decision-making and trade with noticeably better accuracy.
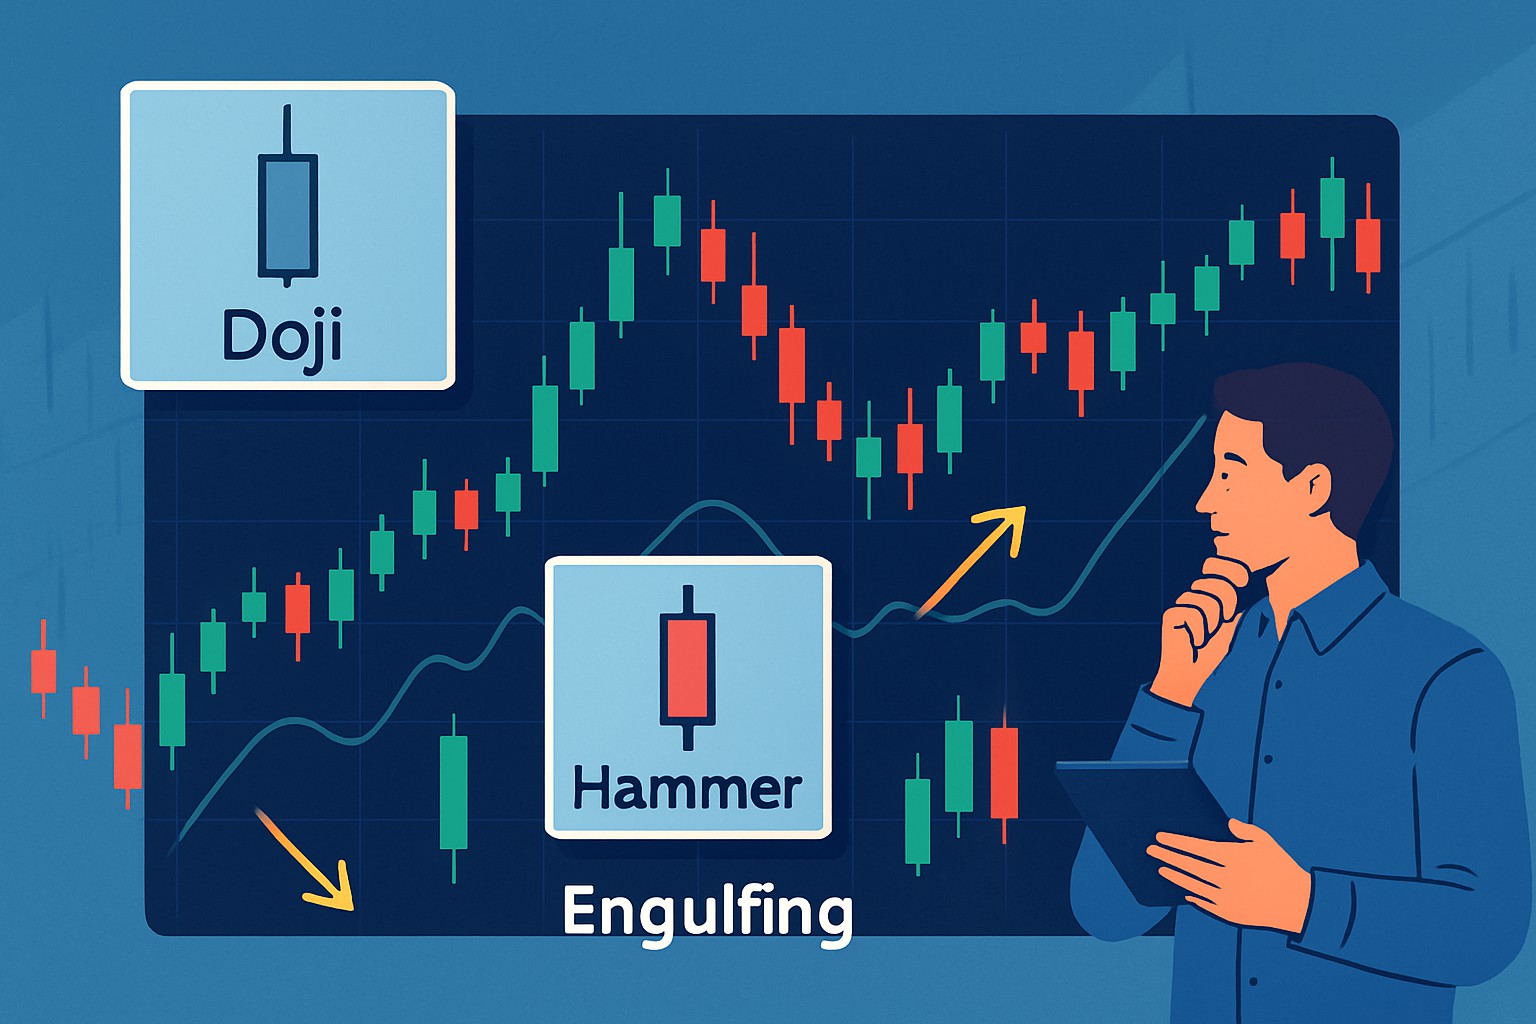
A candlestick lays out four key bits of information: open, high, low and close. The 'body' captures the price range between the open and close while those thin lines above and below—known as 'wicks' or 'shadows'—show the intraday price swings at their wildest. Usually the color green for bullish or red for bearish combined with the body's size offers handy hints about the market's mood and momentum.
Quickly spot these patterns by focusing on the candle's shape and size as well as where it appears in recent price action. For example, a hammer appearing after a steady downtrend often signals a bullish bounce. On the flip side, an inverted hammer or shooting star near the peak of an uptrend usually warns of a possible pullback. It’s worth paying close attention to the candle’s wicks because they offer subtle hints about whether price levels are being pushed away or accepted. That said, context matters a lot. The overall trend direction and volume really affect how trustworthy these signals might be.
Multi-candle patterns really up the ante when it comes to predictive power by weaving together clues from several consecutive candlesticks. Catching these patterns can give traders a leg up, helping them anticipate stronger reversals or trend continuations.
Confirming these patterns usually means zeroing in on volume spikes that pop up while the pattern is forming, since a surge in volume often signals stronger conviction behind the move. It is also a smart move to keep an eye on the bigger trend because patterns that run counter to it often end up indicating short-term pullbacks rather than full-blown reversals.
Avoiding common pitfalls like false breakouts or just eyeballing candlesticks in isolation is important if you want to improve your accuracy. Candlestick signals can be useful but sometimes throw a curveball during low-volume spells.
It’s usually a smart move to double-check candlestick patterns on higher timeframes to see if the signal really holds water.
Pair those candlestick signals with well-known support and resistance levels to get a clearer and more honest picture.
Throwing volume indicators into the mix can be a lifesaver because they help you filter out the false alarms that candlestick patterns sometimes cause.
Keep an eye out for divergences using oscillators like RSI or MACD since they provide solid backup to the pattern’s reliability.
Avoid putting all your eggs in a single candle basket. Instead, look for clusters and consider the bigger picture to boost your confidence.
Using candlestick analysis with other technical tools like moving averages and oscillators usually improves trading accuracy and boosts your confidence.
Put together a cheat sheet that fits your trading style like a glove by selecting a handful of high-probability patterns. Be sure to spotlight their key signals, the ideal contexts where they shine—think trends or reversals—and jot down your own trade triggers or exit cues.
| Pattern Name | Visual Summary | Key Signals to Watch | Best Trading Context | Suggested Confirmation Indicators | Actionable Trade Tip |
|---|---|---|---|---|---|
| Hammer | Small body, long lower wick | Usually pops up after a downtrend and hints at a rejection of those lower prices — like the market saying "not today" | Reversal | A noticeable spike in volume, ideally near a support zone | Jump in once the candle closes above the hammer’s high for some added peace of mind |
| Engulfing Pattern | Larger candle completely covers the previous one | Signals a bullish or bearish reversal with a solid shift in momentum that’s hard to ignore | Reversal or trend continuation | Rising volume, RSI divergence | Set your stop-loss just beyond the engulfed candle’s body to keep risk in check |
| Doji | Open and close prices are nearly equal | Shows the market’s indecision and hints that the current trend might be losing steam | Reversal or consolidation | Volume confirmation paired with a careful trend analysis | Best to wait for the next candle to confirm which way the wind’s blowing |
| Three White Soldiers | Three consecutive candles closing bullishly | Often a strong sign of bullish continuation — think of it as the market marching confidently forward | Uptrend continuation | Increasing volume, bullish MACD crossover | Consider scaling in right after that third candle closes to catch the momentum |
| Shooting Star | Small body with long upper wick | Indicates rejection of higher prices and often points toward a bearish reversal | Typically appears after an uptrend | Resistance level identified, declining volume | Might be a good time to lock in profits or tighten those stops |
| Morning Star | Three-candle setup: bearish candle, small indecision candle, bullish candle | A classic signal of bullish reversal — the market’s way of turning a page | Reversal | Volume surge near support level | Enter once the bullish candle confirms the reversal pattern, don’t rush it |
| Marubozu | No wicks; a fully bullish or bearish body | Shows strong conviction in price direction — like the market putting its foot down | Confirming the trend | Volume confirmation | Ride the wave by trading in line with the prevailing trend |
Keep your cheat sheet fresh and up to date as you gain more experience, jotting down which patterns tend to shine under certain market conditions or timeframes. Giving it a regular once-over based on your trade results and those ever-changing market trends will definitely help sharpen your edge. Tools like Edgewonk can be a real lifesaver, offering detailed trade tracking and performance analysis.
Picture yourself scanning charts with your trusty custom cheat sheet in hand during live sessions, catching those early whispers of reversals or breakout setups.
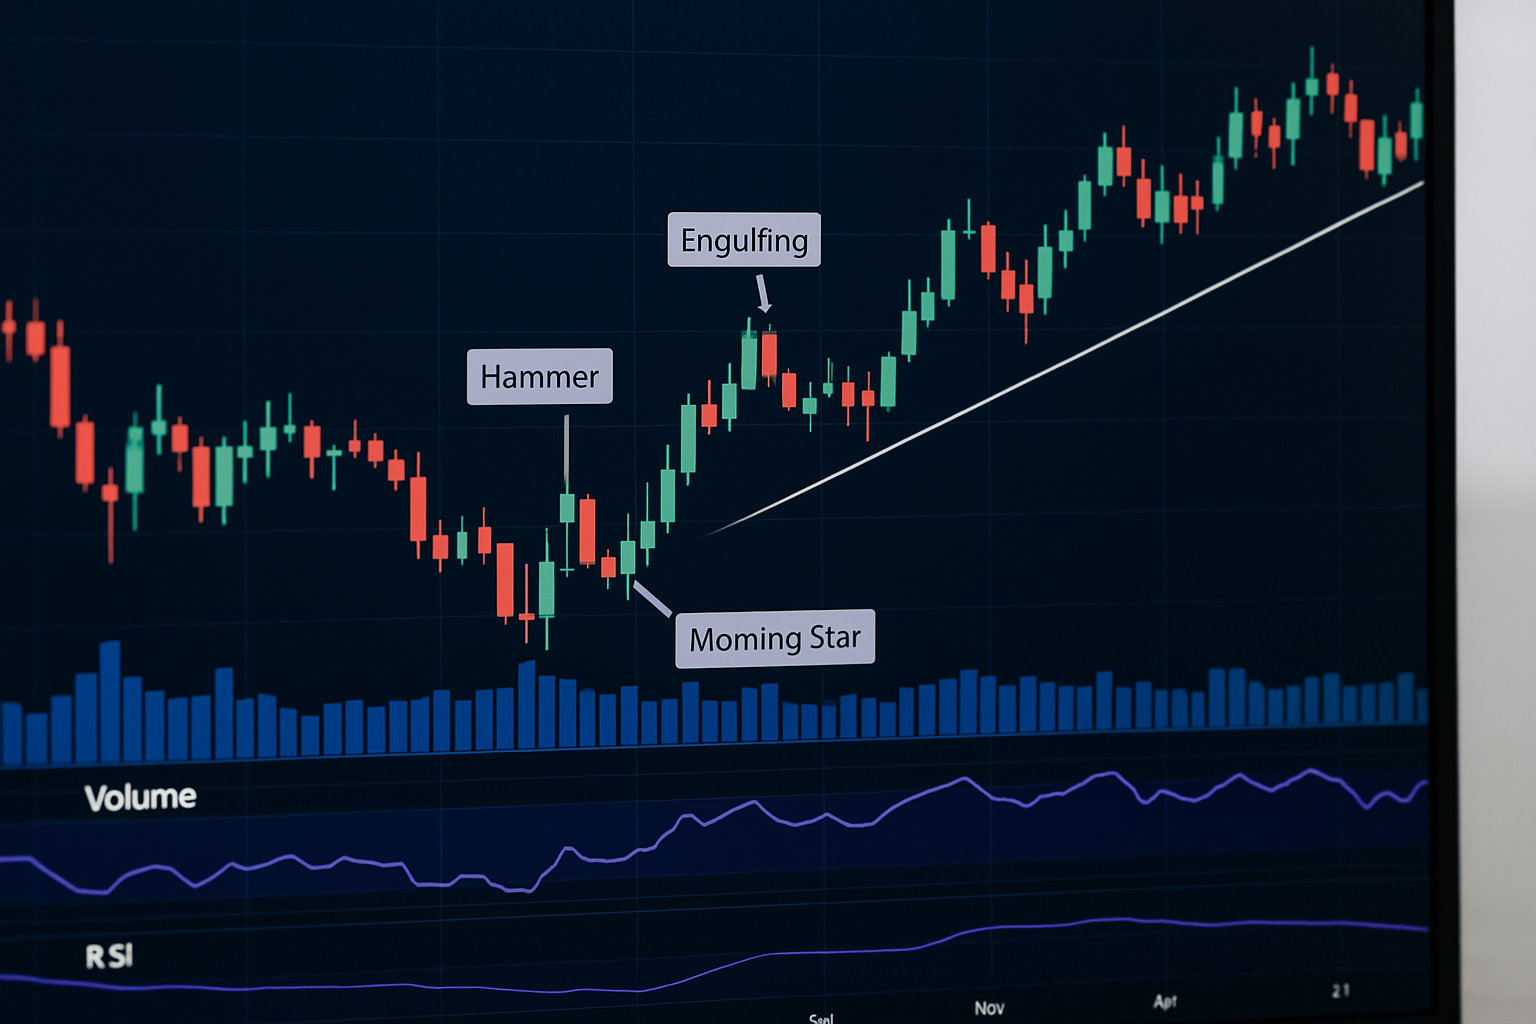
Example of a candlestick chart with annotated patterns and volume indicators for practical trading insights.
Many traders fall into the trap of eyeballing candlestick signals without stepping back to see the bigger market picture. Those patterns might catch your eye but leaning on them alone without weighing volume or broader trends is a recipe for costly slip-ups.
Before you dive in headfirst, a few last nuggets of wisdom to make sure you’re squeezing every bit of value from your candlestick cheat sheet. Think of it as the trusty sidekick that’s there to save the day—if you treat it right. Keep things handy, review patterns regularly, and don’t shy away from revisiting your notes now and then. After all, even the best tools need a little lovin’ to shine bright. Remember, mastering these patterns isn’t about memorizing every detail overnight; it’s more like learning to read a good book—chunk by chunk, with a bit of patience and practice along the way.
Mastering candlestick analysis calls for a disciplined approach—think of it as regularly practicing with a candlestick cheat sheet, journaling your trades, and staying in the loop with the latest research.
Make it a regular habit to cross-check your trades against your trusty cheat sheet. It’s a simple way to catch what’s clicking and figure out where there’s room to level up.
Keep your cheat sheet fresh by updating it as the market shifts and your trading style grows.
Never stop soaking up knowledge about new candlestick patterns and market insights because staying sharp is half the battle won.
Lean on mental discipline tools like focused study sessions and keeping your emotions in check to really fine-tune how you execute trades.
Always pair candlestick patterns with broader technical analysis to keep yourself grounded and balanced in the bigger picture.

Struggling to improve your trading performance? Edgewonk's advanced analytics tools are designed to give you the edge you need.
With detailed trade journaling, robust strategy analysis, and psychological insights, you'll gain a comprehensive understanding of your strengths and weaknesses. Don't miss out on this game-changing opportunity.

17 posts written
Learn how the harami candlestick pattern signals potential market reversals. This guide breaks down...

Discover the bullish harami candlestick pattern—a key technical signal that can hint at trend revers...

Unlock the power of the head and shoulders pattern with this complete guide. Learn to spot, trade, a...

Discover what IOUs mean in finance, their role as informal debt acknowledgments, and how understandi...