


Technical Analysis
Profiting from Head and Shoulders Patterns in Any Market
Unlock the power of the head and shoulders pattern with this complete guide. Learn to spot, trade, a...

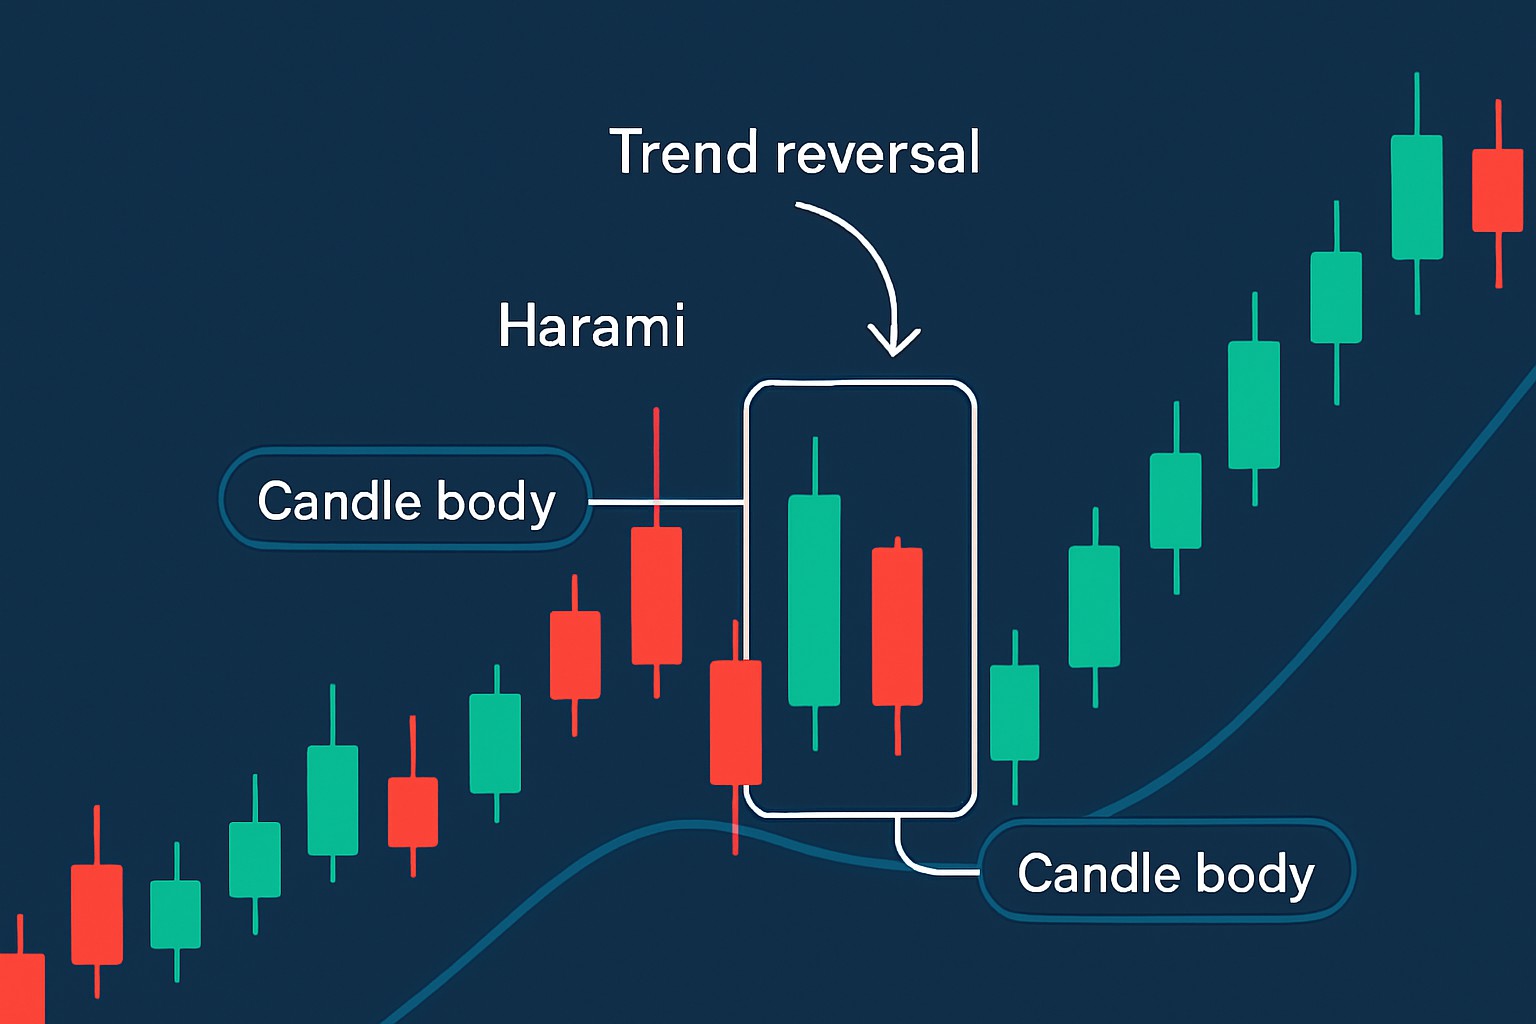
The harami pattern is a pretty well-known candlestick chart formation that traders and investors alike often turn to when trying to spot potential reversals in market trends. It involves just two candles but manages to capture those moments of market hesitation that often sneak in before a shift in direction.
Jumping headfirst into the harami pattern, it’s worth taking a moment to get cozy with the basics of candlestick charts. These handy charts track price movements over a set period, using quirky shapes and colors that really bring trader sentiment to life.
A harami pattern consists of two candles where the second is noticeably smaller and fits within the body of the first larger candle. This setup usually signals market uncertainty.
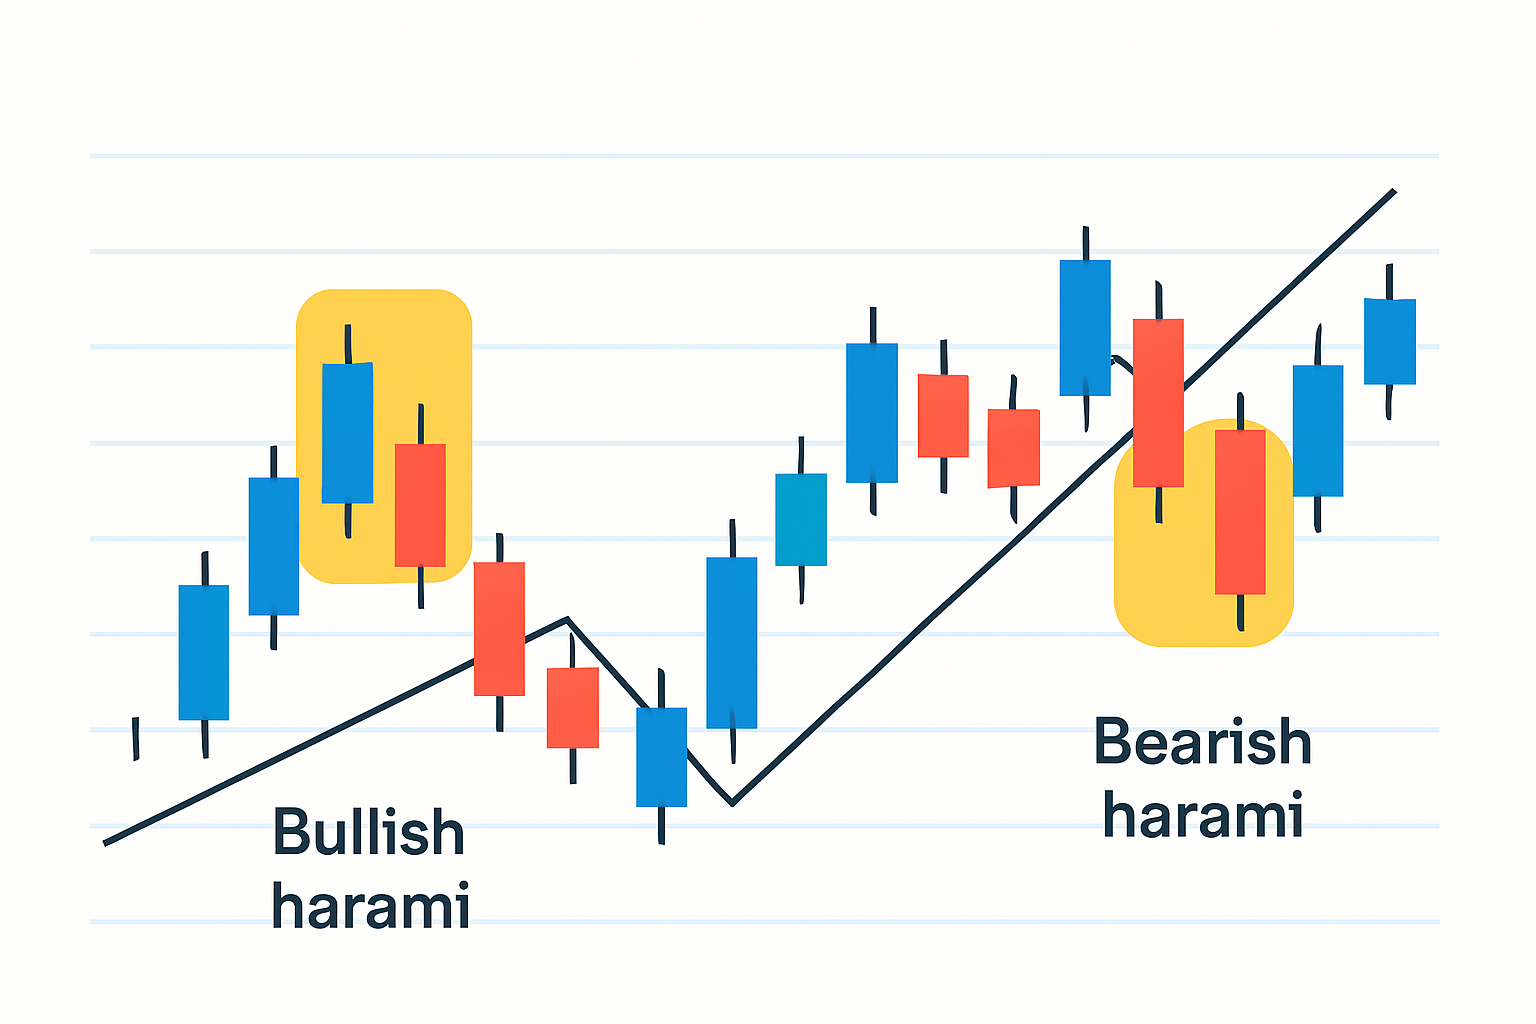
Visual representation of bullish and bearish harami patterns highlighting the smaller candle within the larger candle body.
The word "arami" is Japanese and translates to "pregnant." It fits the pattern quite nicely since the smaller candle snugly nests inside the larger one, forming a shape that’s strikingly reminiscent of a pregnant belly.
Harami patterns come in two main flavors: Bullish Harami and Bearish Harami. Each one tends to show up in its own unique market situation and usually hints at a potential reversal, whether the market’s been falling or climbing.
| Feature | Bullish Harami | Bearish Harami |
|---|---|---|
| Trend Context | Pops up after a downtrend, hinting at a possible turnaround | Shows up following an uptrend, often waving a caution flag |
| Candle Colors | Starts with a big bearish candle, then slips into a smaller bullish one | Begins with a hefty bullish candle, then shrinks down to a smaller bearish candle |
| Pattern Meaning | Could be the market’s way of saying bullish vibes are on the horizon | Might suggest that the bears are gearing up to take control |
| Implications for Traders | Keep an eye out for confirmation before jumping in to buy | Might be a good time to consider locking in gains or exploring short positions |
Recognizing a harami pattern tends to be more effective when you follow a straightforward method. By paying close attention to the size of the candles and where they land on the chart as well as the trend that’s been unfolding, traders can often catch this pattern just in time. It’s a handy tool that can give you a heads-up on potential shifts.
Get a feel for the dominant trend before the pattern starts to take shape. Haramis usually sneak in toward the tail end of a trend, so keep your eyes peeled.
Spot a big candle that really flexes a strong move in the current direction—no wishy-washy stuff here.
Check that the following candle’s body fits snugly within the previous candle’s body, like it’s trying to stay under the radar.
Pay attention to the color of that smaller candle to read bullish or bearish vibes, and don’t forget to glance at the trading volume for a little extra confirmation—it rarely lies.
It is pretty important not to mix up similar patterns or partial overlaps with true haramis—they can be sneaky like that. Getting the hang of spotting them usually gets easier the more you practice, and leaning on trusted charting tools like TradingView or TrendSpider really helps.
The harami pattern is pretty important since it signals those moments when the market feels a bit wobbly and whispers hints of possible reversals.
A harami pattern often signals a brief pause in the market’s momentum, as if it’s catching its breath and mulling over which way to head next—kind of like a runner slowing down to take a quick peek at the path ahead before making a move.
The harami resembles other candlestick patterns like engulfing patterns, inside bars and dojis but it’s key to keep them straight.
Traders often keep an eye on harami patterns as part of a broader technical analysis toolkit. When you combine this pattern with volume data and momentum indicators, it can really sharpen your accuracy.
Take a good look at the overall trend and the bigger market picture to make sure that the harami pattern really packs a punch.
Keep an eye on volume indicators to see if the indecision is genuine or just a false signal.
Hold your horses and wait for a follow-up candle after the harami because this will truly confirm if a reversal is coming.
Always tuck in your stop-loss orders just beyond the pattern’s highs or lows as a safety net against nasty surprises.
If the signals are a bit fuzzy or the market is acting like a wild stallion, consider going smaller on your positions or hedging your bets to stay safe.
A trader who spots a bullish harami on Binance's spot trading platform will often hang tight and wait for subsequent candles to show higher volume before jumping in long while keeping a cautious eye on risk with stop losses. Tools like TradingView make these patterns pop out more clearly and let you tweak your settings to nail better trade timing.
Harami patterns can be quite handy but they are far from foolproof. False signals tend to pop up, especially when the market is just meandering sideways or trading volume takes a nosedive.

Are you tired of juggling multiple tools for your trading needs? TradingView is the all-in-one platform that streamlines your analysis and decision-making.
With its powerful charting capabilities, real-time data, and vibrant community, TradingView empowers traders like you to stay ahead of the market. Join thousands who trust TradingView for their trading success.

20 posts written
Unlock the power of the head and shoulders pattern with this complete guide. Learn to spot, trade, a...

Master the hammer candlestick pattern—a key indicator for market reversals. This beginner-friendly g...

Discover the doji candlestick—a powerful price action signal revealing market indecision. This begin...

Unlock the power of the bear flag pattern with our practical, step-by-step guide. Understand market...