
IOU Meaning in Finance
Discover what IOUs mean in finance, their role as informal debt acknowledgments, and how understandi...
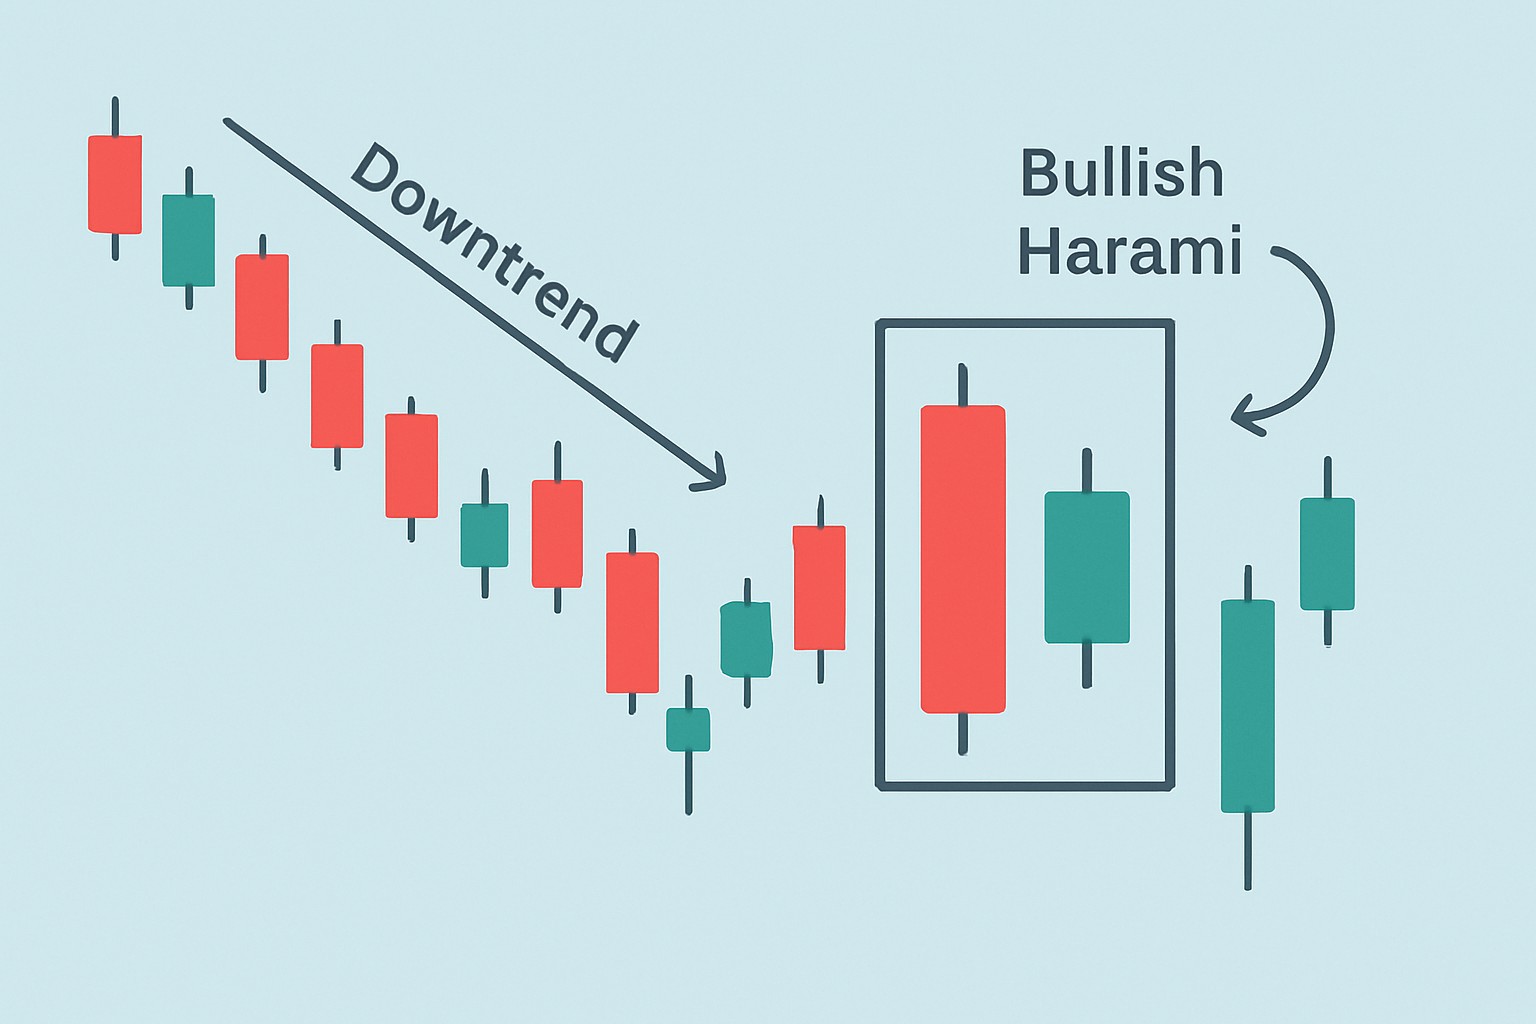
The bullish harami candlestick pattern is a classic signal in technical analysis that often hints at a possible turnaround in a downtrend.
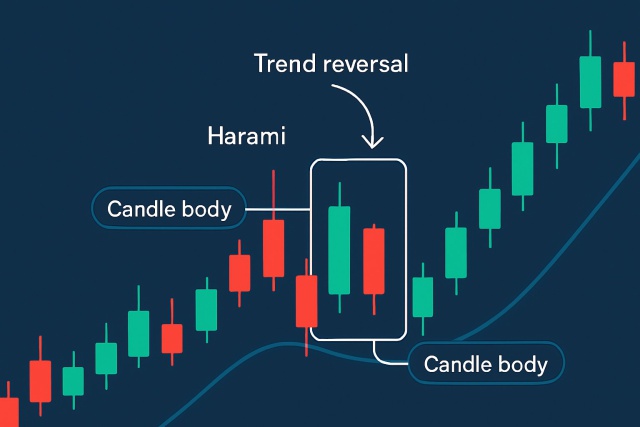
A bullish harami is a candlestick chart pattern that hints at a potential turnaround from bearish to bullish momentum—like a market catching its breath before taking off. The term "harami" comes from Japanese meaning "pregnant" and cleverly refers to how a smaller candle fits inside the body of a larger one. Picture a big bearish candle followed by a smaller bullish candle that stays completely within the range of the previous one.
Candlestick charts track price swings over a specific time frame and give traders a much clearer read on the market’s mood. Each candle lays out four vital prices: open, high, low and close. When a candle closes above its open it’s bullish—think of it as a little victory dance. Conversely, if it closes below it’s bearish and signals a bit of a downer.
Spotting a bullish harami pattern requires keeping a close eye on the price action, especially when the market is on a downtrend. Typically you’ll notice a big bearish candle first followed by a smaller bullish candle that fits inside the body of the previous one. It’s like a little candle tucked away for safety.
Make sure the market is clearly in a downtrend, so you know that bearish momentum isn’t just a passing phase but something that’s been gaining steam.
Keep an eye out for a big bearish candle that really screams strong selling pressure—think of it as the market’s way of taking a deep breath and letting sellers have their moment.
Look for a smaller bullish candle that fits snugly within the body of that prior bearish candle—like a little glimmer of hope tucked inside the bigger picture.
Don’t forget to check how volume is shifting and get a feel for the overall market mood. These clues will help you decide if this pattern might actually be hinting at a potential shift in momentum, or just another blip on the radar.
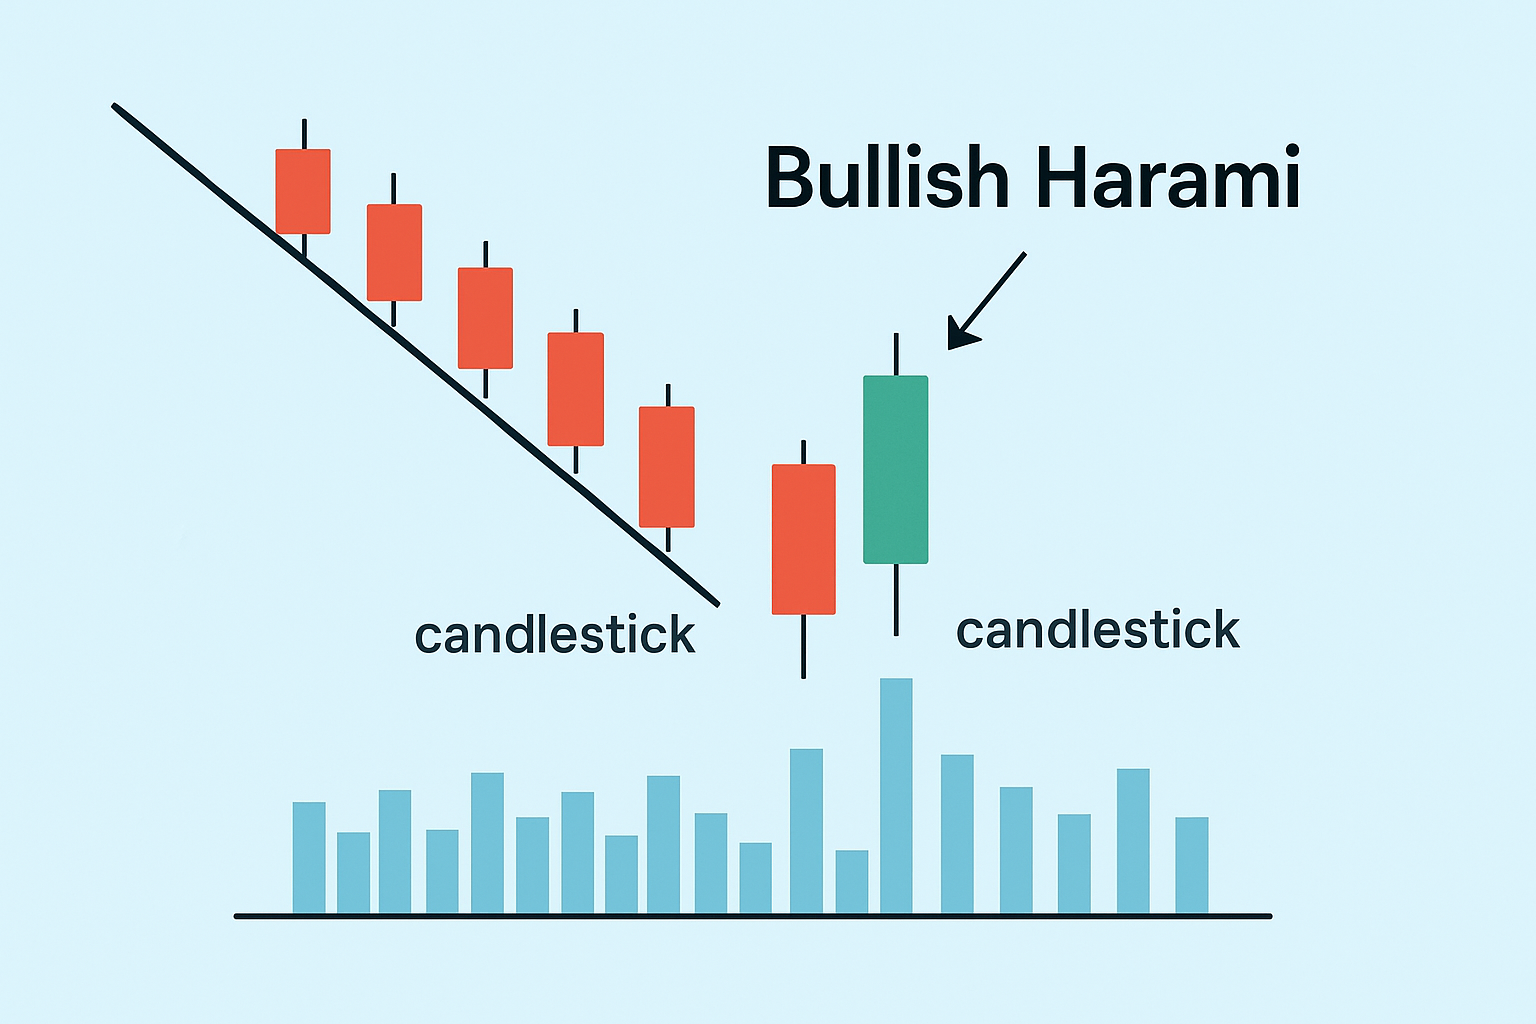
Example of a bullish harami pattern showing a large bearish candle followed by a smaller bullish candle within its body
The bullish harami pattern often hints at a potential change in market sentiment where buyers begin to flex their muscles after a stretch of seller dominance. It usually signals that the selling pressure is cooling off and buyers might be stepping up to the plate.
A bullish harami can be a handy little signal, though it’s far from a sure thing. I’ve found it works best when you pair it up with other analysis tools to really nail down those trend shifts before jumping into a trade.
The bullish harami shares a few traits with other bullish reversal patterns but carries unique twists that set it apart. Take the bullish engulfing pattern for example. It often signals stronger buying momentum since the second candle completely swallows the previous bearish one, no ifs or buts. Then there’s the morning star. It brings three candles to the party and usually points to a much more powerful turnaround. Piercing lines come with their own rulebook, especially about that vital midpoint price.
| Pattern Name | Visual Structure | Usual Market Context | Reliability | Unique Characteristics |
|---|---|---|---|---|
| Bullish Harami | A large bearish candle followed by a smaller bullish candle tucked neatly inside it | After a downtrend | Moderate | That smaller second candle hanging out ‘inside’ the first one hints at some real indecision from the bears |
| Bullish Engulfing | A small bearish candle replaced by a larger bullish candle that completely swallows it | After a downtrend | High | The bigger second candle basically shouting ‘buyers are taking charge’ with some force |
| Morning Star | A trio of candles: bearish, then a tiny-bodied ‘star’ candle, followed by a bullish one | After a prolonged downtrend | High | Seems to say the downtrend’s running out of steam and a stronger reversal is on the horizon |
| Piercing Line | The second bullish candle closes well above the midpoint of the preceding bearish candle | After a downtrend | Moderate to High | Points out that the second candle pushes beyond 50% of the first, making its presence felt |
Traders often weave the bullish harami pattern into their strategies but rarely take it at face value. They look for extra confirmation to back it up. When harami signals show up with noticeable volume spikes or key support or resistance zones and trends on higher timeframes, it often points toward smarter and more confident decisions.
The bullish harami can definitely come in handy, but it’s not without its quirks. It has a habit of throwing out false signals when the market’s stuck in a sideways slog or just can’t seem to find its footing. Leaning on it too heavily without checking the bigger picture like broader trends or volume often leads to pretty weak trade entries.
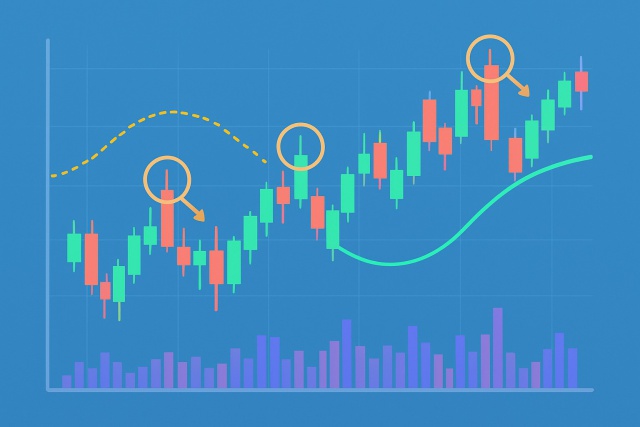
Peering at real charts from the forex and stock markets really brings home how bullish harami patterns often act as early warning signs for trend reversals that traders lean on. Take one instance where a harami popped up after a steady slide in a currency pair, which was then followed by a rally that stretched on for several days.
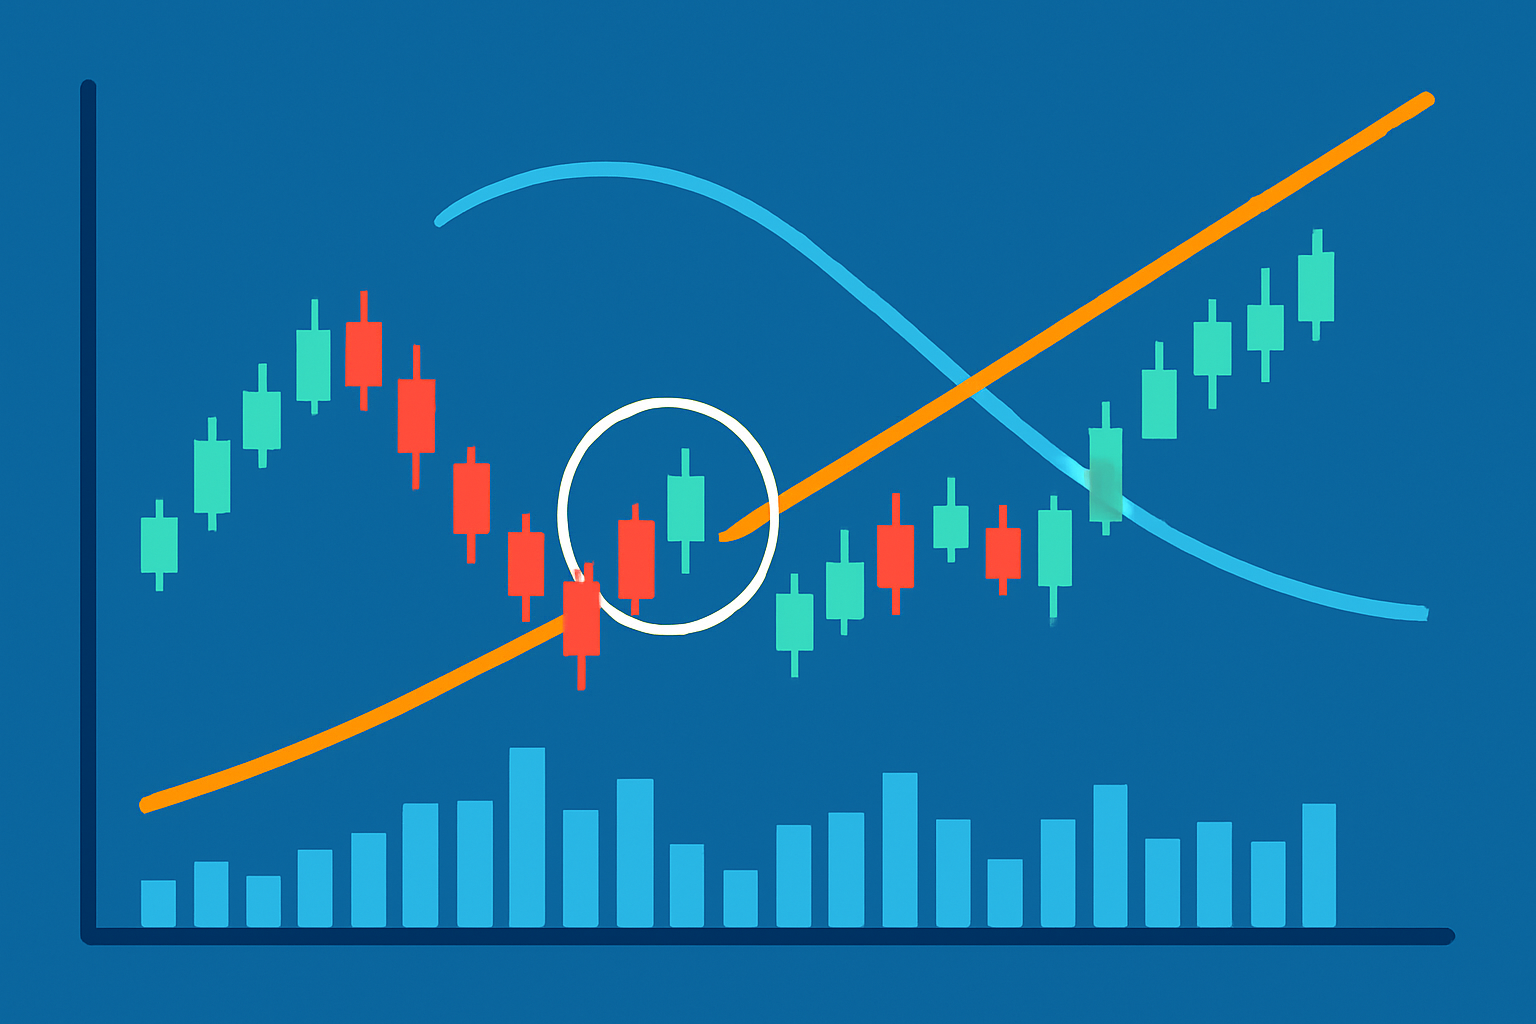
Real-world trading chart example illustrating a bullish harami pattern and subsequent trend change
Clearing up these common misunderstandings can really save traders from costly slip-ups that lead to disappointing results. When you pair the bullish harami with other indicators a bit of careful analysis usually turns it into a far more reliable tool rather than leaning on it solo as the lone predictor
Here's the stuff you really want to remember without sifting through every last detail. Whether you are skimming for the main takeaways or prepping for a quick refresher, these highlights have got you covered.
Tired of missing opportunities and making suboptimal trading decisions? TrendSpider's cutting-edge platform automates complex technical analysis, saving you time and reducing human error.
With multi-timeframe analysis, dynamic alerts, backtesting, and customizable charting, you'll gain a competitive edge in identifying trends and making informed trades across global markets.
As a trader seeking opportunities in the dynamic crypto market, you need a reliable and secure platform to execute your strategies. Coinbase, the leading cryptocurrency exchange, offers a seamless trading experience tailored to your needs, empowering you to navigate the market with confidence.
16 posts written
With over two decades of experience navigating volatile markets, Ludovik Beauchamp provides invaluable guidance on risk management, portfolio optimization, and adaptability in the face of uncertainty.
Read Articles
Discover what IOUs mean in finance, their role as informal debt acknowledgments, and how understandi...
Master the hammer candlestick pattern—a key indicator for market reversals. This beginner-friendly g...
Learn how the harami candlestick pattern signals potential market reversals. This guide breaks down...
Discover the doji candlestick—a powerful price action signal revealing market indecision. This begin...
