


Technical Analysis
What the Doji Candlestick Means in Price Action
Discover the doji candlestick—a powerful price action signal revealing market indecision. This begin...


The EMA, or Exponential Moving Average, is an important technical indicator that countless traders use to understand the ema meaning and get a better read on market trend directions. Understanding what the EMA represents is important because it provides a snappier way to follow price changes and helps users catch trend shifts earlier.
EMA stands for Exponential Moving Average. It is a type of moving average that gives more weight to recent prices. Unlike the Simple Moving Average (SMA) which treats all prices as equally important over a set period, the EMA reacts quicker.
Calculating the EMA kicks off with an initial Simple Moving Average to set the baseline, then it brings in a multiplier that puts more weight on the recent prices because what happened yesterday usually matters more than last month.
Find the initial EMA value by calculating the Simple Moving Average (SMA) of your first batch of data points, say the first 10 days to keep it straightforward.
Figure out the multiplier using this formula: Multiplier = 2 divided by (Number of periods plus 1). For a 10-day EMA that breaks down to 2 divided by (10 plus 1) giving you roughly 0.1818.
Take the most recent closing price and multiply it by the multiplier you just found.
Multiply the previous EMA value by 1 minus the multiplier.
Add those two numbers together to get your current EMA value. Rinse and repeat this process for each new price point and before you know it you’ve got yourself a smooth up-to-date EMA.
Traders often lean towards the EMA since it picks up on recent price moves a bit faster, making it easier to catch trend changes before they fully unfold. That quicker reaction time can be a real game-changer, letting people jump in or bail out of trades sooner.
A common way to use the EMA is to get a feel for whether the market is climbing, falling or just wandering sideways. Keeping an eye on how the price dances around the EMA line and lining up a few different EMAs for comparison often hands traders some clear signals about where the trend is headed.
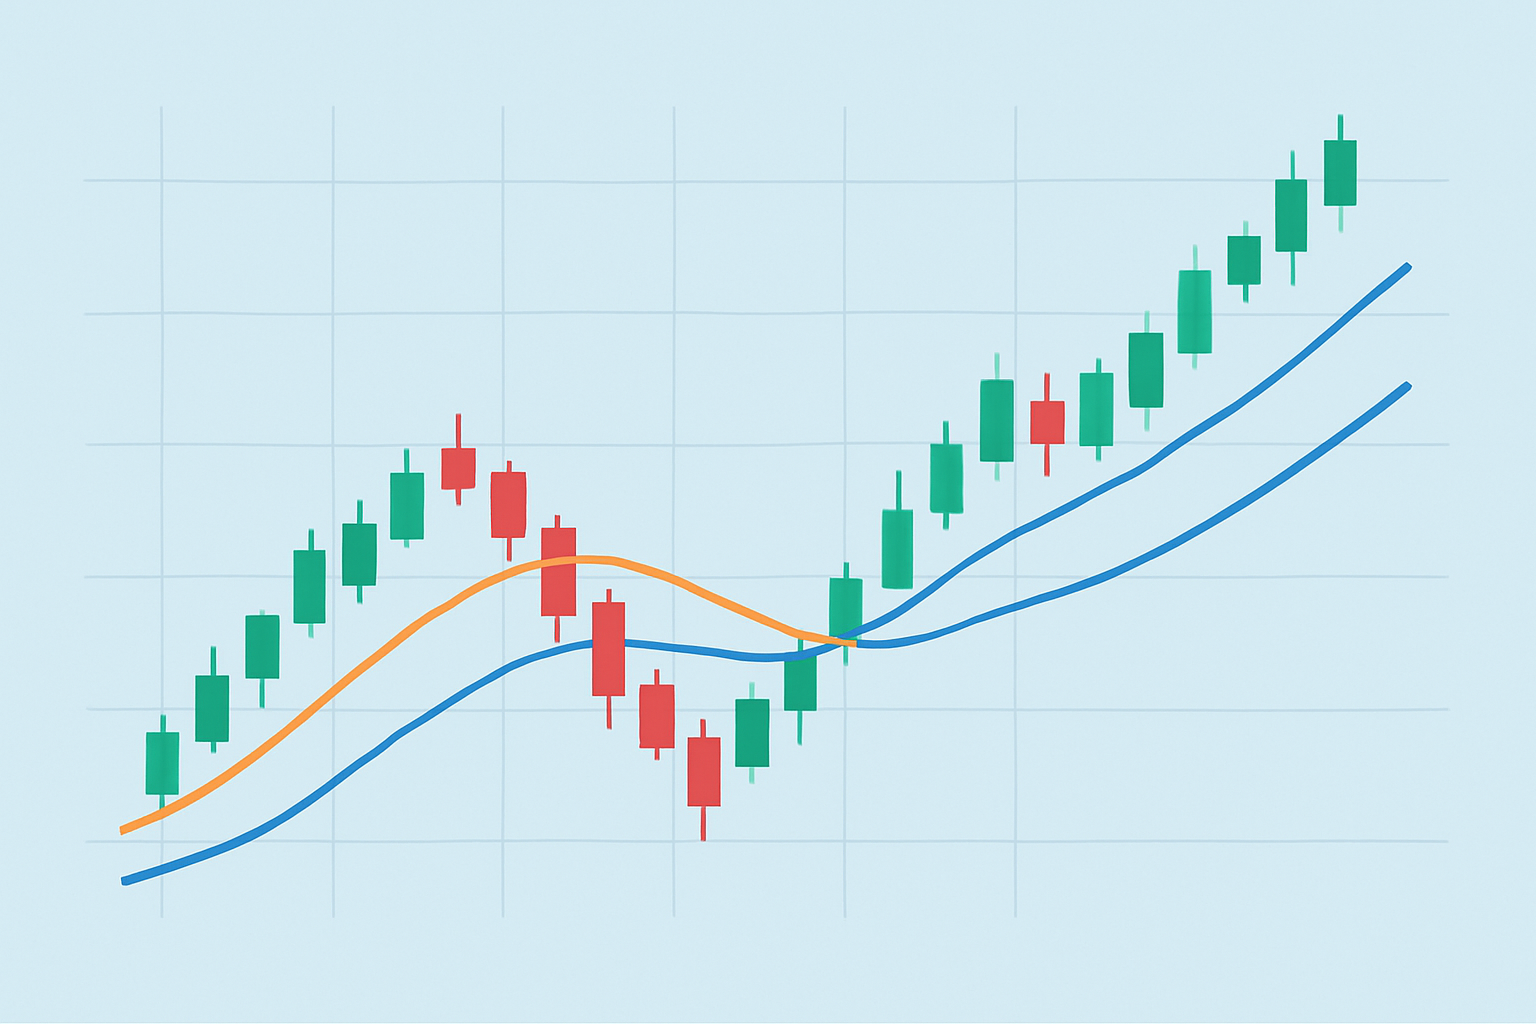
A stock price chart featuring 12-day and 26-day EMA lines, demonstrating crossover signals for trend identification.
Many trading strategies lean heavily on the EMA as a trusty sidekick to confirm or ride broader trends with a bit more confidence. Traders often team up EMA signals with price action or other indicators, aiming to sharpen their accuracy and gain clearer insights.
Using EMA-based strategies usually helps cut down on those pesky false signals, especially when you team them up thoughtfully with other tools. This combo often results in sharper timing for jumping into and out of trades, letting traders hang on to trends a bit longer and trim losses when the market decides to throw a curveball.
The EMA is widely used, but some traders often misunderstand what it really does. It is important to clear up these common misconceptions to get the most out of it. The EMA does not predict future prices. Instead, it offers a smoothed snapshot of past data.
To fully grasp the ema meaning and make the most of this indicator, traders should choose periods that suit their unique trading style and market conditions. Pairing the EMA with other indicators and tweaking it across various timeframes usually helps sharpen decisions and keeps those pesky false signals at bay.

Tired of missing opportunities and making suboptimal trading decisions? TrendSpider's cutting-edge platform automates complex technical analysis, saving you time and reducing human error.
With multi-timeframe analysis, dynamic alerts, backtesting, and customizable charting, you'll gain a competitive edge in identifying trends and making informed trades across global markets.

23 posts written
Discover the doji candlestick—a powerful price action signal revealing market indecision. This begin...

Learn how the harami candlestick pattern signals potential market reversals. This guide breaks down...

Unlock the power of the head and shoulders pattern with this complete guide. Learn to spot, trade, a...

Discover the bullish harami candlestick pattern—a key technical signal that can hint at trend revers...