


Technical Analysis
What the Doji Candlestick Means in Price Action
Discover the doji candlestick—a powerful price action signal revealing market indecision. This begin...

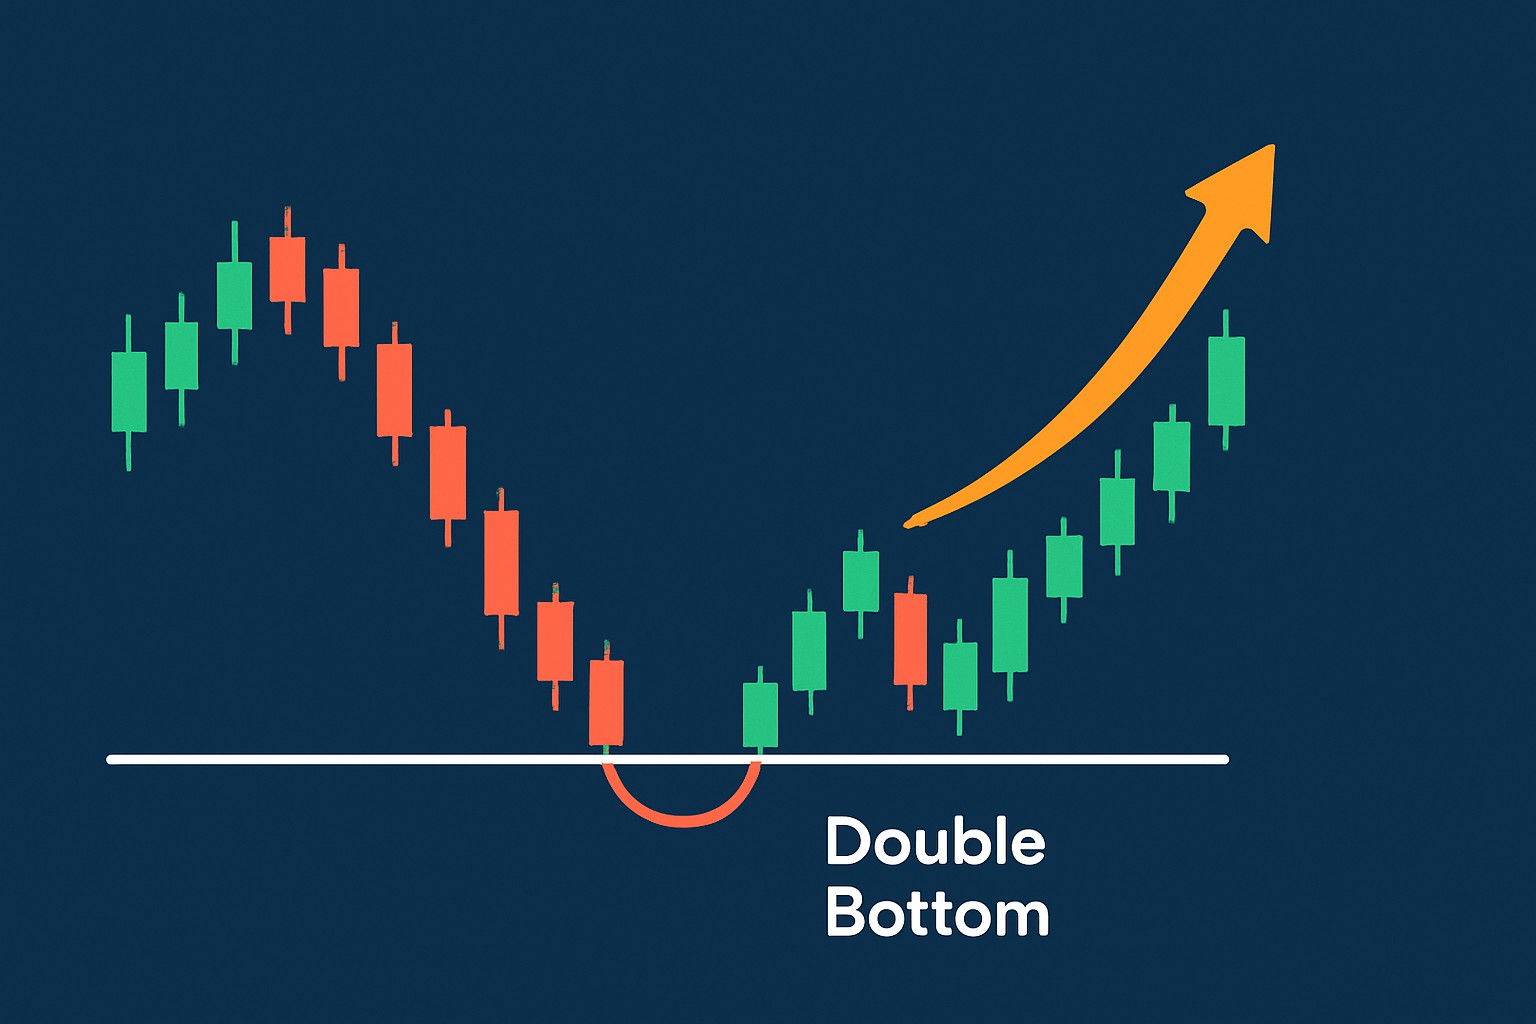
The double bottom pattern is a handy tool in technical analysis that often comes to the rescue when spotting potential trend reversals. It hints that a downtrend might finally be waving goodbye, making room for an upward move to take the stage.
A double bottom is a chart pattern that looks a lot like the letter "W". It shows up when there are two distinct lows roughly at the same price level, with a modest peak tucked in between. Imagine it like a ball bouncing off the floor twice—just before it gathers enough steam to spring upward.
This pattern illustrates the quirky dance of market sentiment: buyers jump in at the first low, then sellers swoop back to push prices down once more.
Recognizing a genuine double bottom takes more than just spotting a 'W' shape on the chart. Traders need to pay attention to volume clues and make sure those price lows line up symmetrically. Then they must patiently wait for a solid breakout above the neckline.
Not all double bottoms play out exactly the same way. Every now and then you will spot variations like a triple bottom, or the two lows just do not line up perfectly in depth—enough to throw even seasoned traders for a loop. False double bottoms tend to pop up thanks to market noise or when there is just not enough clear confirmation.
Patience really pays off when trading the double bottom pattern. I’ve found it’s wise to wait for solid volume confirmation and a clear breakout before jumping in. Also, spotting a decent time gap between the lows goes a long way in boosting the pattern’s reliability—worth holding your horses for, if you ask me.
Volume tends to play a starring role when confirming the double bottom pattern. It dips as the first bottom forms, stays quiet during the middle peak, and then springs to life at the second bottom and breakout.
Trading the double bottom pattern calls for a disciplined approach that involves clear entry points, stop losses and profit targets to keep things tidy.
Spot the double bottom pattern by looking for two distinct lows and a clear neckline. Think of it as the market's way of drawing a little double dip.
Check for a jump in volume at that second low and during recent price moves because it’s often the market's subtle wink that something's happening.
Hold your horses until the price breaks above the neckline resistance and closes a candle up there. Patience pays off.
Once that breakout is confirmed, it is time to enter a long position.
Protect yourself by placing a stop loss just below the lower of the two bottoms since it is better to be safe when managing risk.
Set your profit target by measuring the distance from the lowest bottom up to the neckline, then project that same distance upwards. This is a clever way to estimate how far the market might run.
It’s really key to tweak your trade size and stop levels depending on how wild the market’s acting and the timeframe you’re using. Take cryptocurrency for example—since it’s known for its rollercoaster moves you generally want to give your stops and targets more breathing room. On the flip side, stocks tend to be more predictable and usually fare better with tighter setups. I’ve found tools like TradingView’s charting features to be a real lifesaver for eyeballing and fine-tuning these settings.
| Trade Stage | Criteria | Rationale |
|---|---|---|
| Entry | Price breaks above the neckline with a confirmed close and a noticeable uptick in volume | This step helps seal the deal on the pattern and cuts down on those pesky false alarms |
| Stop Loss | Placed just a hair below the lowest point within the pattern | Designed to keep losses in check if things don’t quite pan out as hoped |
| Profit Target | Calculated by projecting the distance from the lowest point up to the neckline | Gives a sensible price target that lines up neatly with the pattern’s overall size |
Traders often find themselves tripping up when it comes to double bottom patterns, sometimes leading to losses or letting good opportunities slip through their fingers.
The double bottom pattern appears in many markets including stocks, forex, crypto and commodities alike. How reliable it is and the way it takes shape depends on market volatility and the timeframe you’re working with.
Pairing the double bottom pattern with other technical indicators usually sharpens trade accuracy. These tools highlight shifts in momentum, gauge trend strength and flag whether an asset might be overbought or oversold—helping traders avoid weaker signals.

Are you tired of juggling multiple tools for your trading needs? TradingView is the all-in-one platform that streamlines your analysis and decision-making.
With its powerful charting capabilities, real-time data, and vibrant community, TradingView empowers traders like you to stay ahead of the market. Join thousands who trust TradingView for their trading success.

19 posts written
Discover the doji candlestick—a powerful price action signal revealing market indecision. This begin...

Unlock the power of the head and shoulders pattern with this complete guide. Learn to spot, trade, a...

Discover what IOUs mean in finance, their role as informal debt acknowledgments, and how understandi...

Discover the bullish harami candlestick pattern—a key technical signal that can hint at trend revers...