


Technical Analysis
How to Spot a Hammer Candlestick in Trading Charts
Master the hammer candlestick pattern—a key indicator for market reversals. This beginner-friendly g...

If you are new to trading or just dipping your toes into the world of price action, you’ve probably stumbled upon a candlestick called a doji. It stands out a bit from the usual candles and can leave beginners scratching their heads. But don’t sweat it understanding doji candlesticks is actually a handy step toward decoding market signals with a bit more clarity. A doji often signals those moments when buyers and sellers are kind of at a standoff, giving subtle hints about where prices might head next.
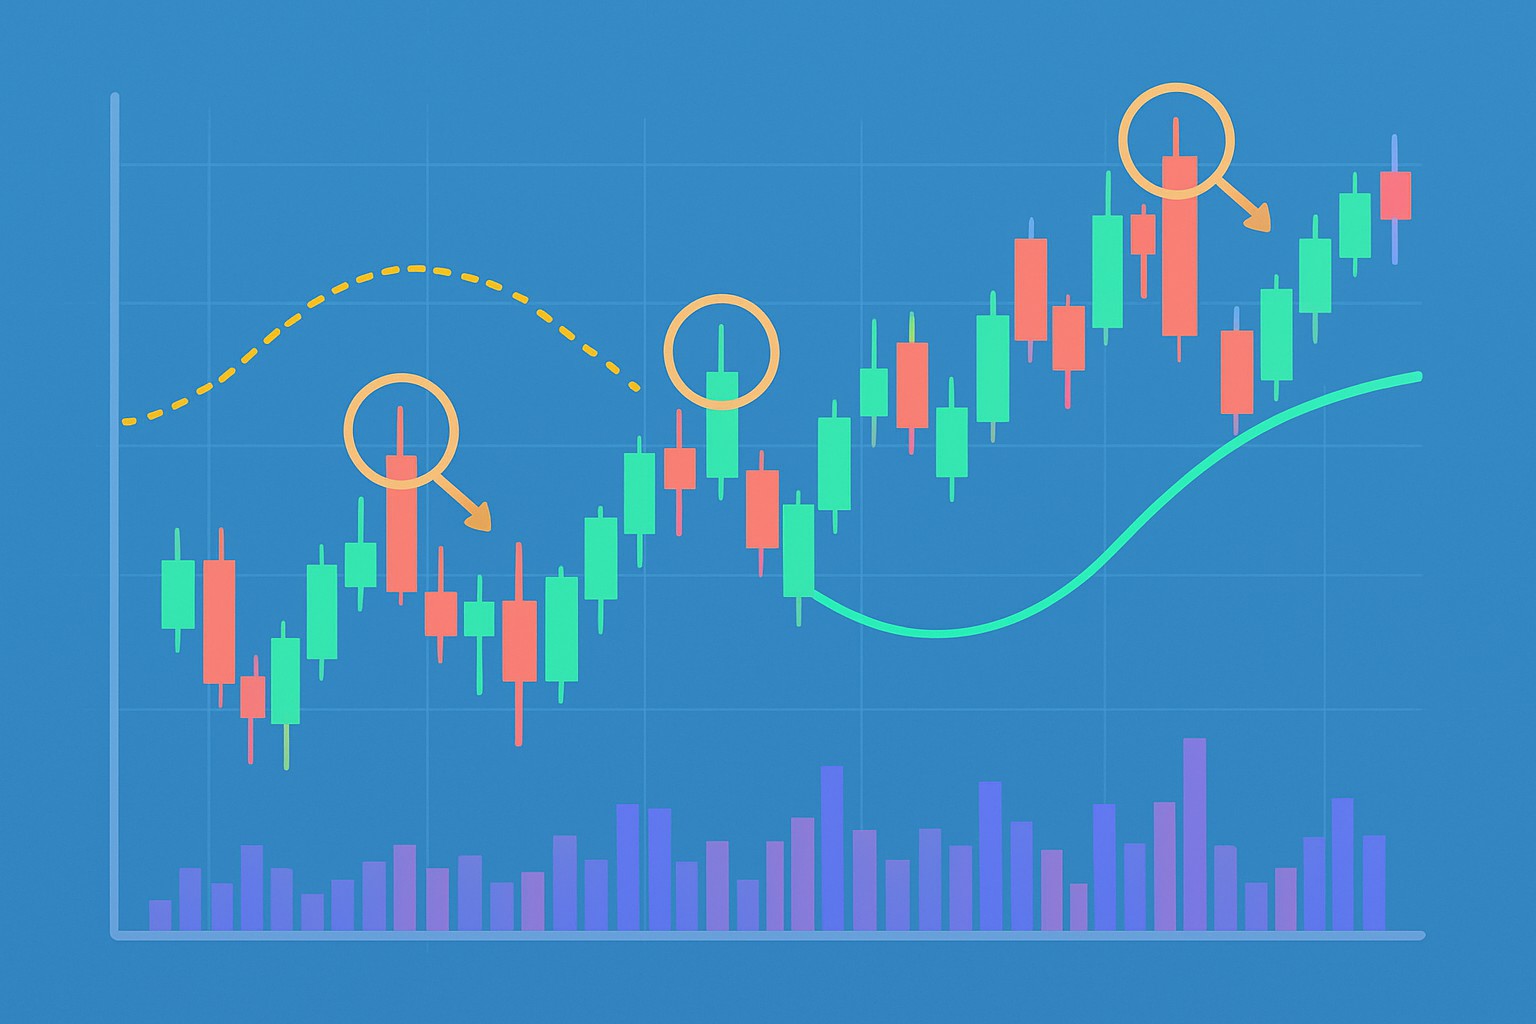
Candlesticks are handy visual nuggets on price charts that show how prices shifted over a specific time frame—could be a minute, an hour or a whole day. Each candlestick tells a mini story about where the price kicked off and wrapped up plus the highest and lowest points it hit along the way.
A doji candlestick pops up when the open and close prices are almost neck and neck during a trading period. It’s a classic sign of a standoff between buyers and sellers—neither camp manages to push the price much in their favor. In the world of price action, a doji usually hints at a bit of uncertainty or some indecision.
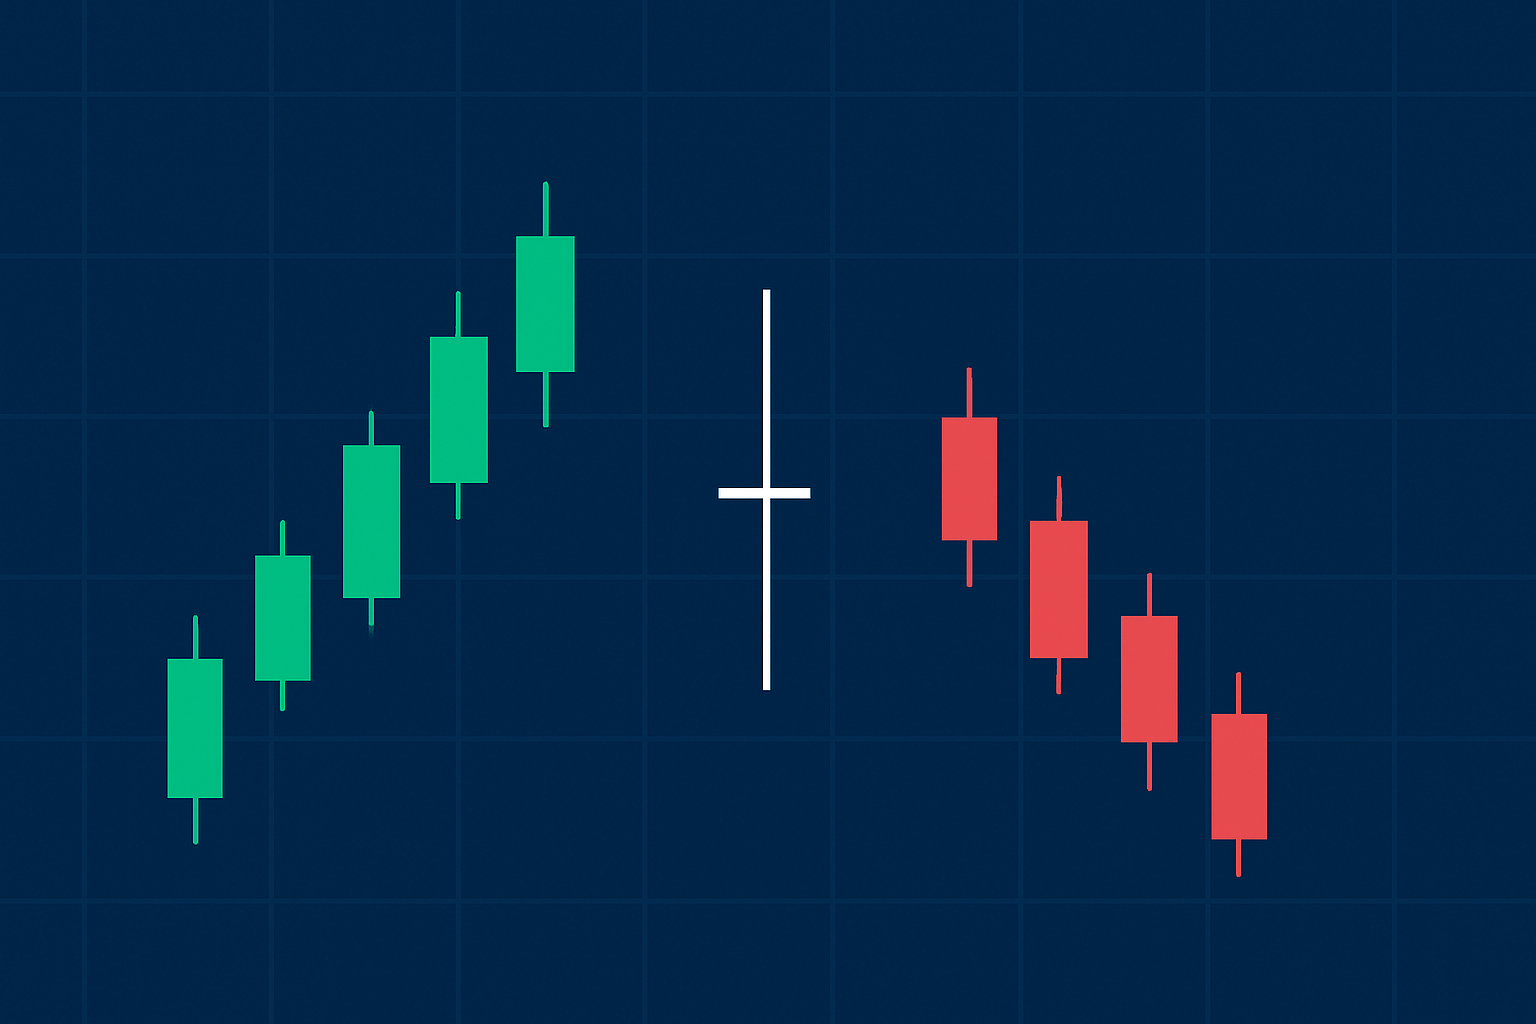
Visual example of a doji candlestick showing nearly equal open and close prices with upper and lower shadows.
Doji candlesticks come in several shapes and sizes, each with its own subtle twist that can give traders a little window into market mood.
| Type of Doji | Description | What it looks like | Typical market interpretation |
|---|---|---|---|
| Standard Doji | The open and close prices are almost neck and neck. | A tiny or barely-there body with short shadows | Often signals the market is hesitating; could mean a reversal or just a brief pause in the action |
| Long-legged Doji | Sports very long upper and lower shadows with a minuscule body. | Long wicks framing a small body | Suggests the market is on a rollercoaster ride of uncertainty and wild price swings |
| Dragonfly Doji | The open, close, and high prices huddle close together; it flaunts a long lower shadow. | Looks like the letter 'T' on its head | Usually hints at a bullish turnaround after a downtrend, giving bulls a glimmer of hope |
| Gravestone Doji | The open, close, and low prices sit tight; it shows off a long upper shadow. | Resembles an upside-down 'T' | Often warns of a bearish reversal if it pops up after an uptrend, like a stubborn warning sign |
Doji candlesticks pop up during moments of real indecision when neither buyers nor sellers are calling the shots with any certainty. This kind of hesitation usually hints that the current trend might be losing steam and could be gearing up to either take a breather or flip direction altogether.
A doji by itself doesn’t shout a clear signal. Most traders tend to hold their horses and wait for the next candle or other indicators to chime in before making a call on where the market might be headed.
Recognizing a doji on your chart is actually simpler than you might expect, even if you are new to this whole trading game. I’d suggest starting out with popular charting tools like TradingView or Binance—they offer pretty straightforward candlestick charts that won’t make your head spin. Pick a time frame that suits how you trade—daily or hourly charts tend to be the sweet spot for beginners wanting to get their feet wet.
Start firing up your favorite chart for the asset you are curious about—think cryptocurrencies on Binance or whichever platform you trust.
Choose a time frame that suits your trading vibe, whether that’s quick 1-hour candles, a laid-back 4-hour view or the good old daily ones.
Hunt for candlesticks with a tiny body which means the open and close prices are practically twins.
Take a closer peek at the shadows above and below the body to get the scoop on what kind of doji you’re dealing with.
Lastly, give the chart’s data window a thorough once-over to double-check the open and close prices are almost carbon copies.
Sometimes called the "indecision candles," Doji candlesticks can feel like that blinking cursor on a blank page—full of potential but leaving you wondering what is next. When trading, spotting a Doji is like catching a subtle signal whispering that the market might just be at a crossroads. But, as with any tool in your trading kit, there’s more than meets the eye. These tips will hopefully give you a clearer sense of when and how to put Doji candlesticks to work in your strategies without falling into common traps.
When you first dive into trading with doji signals, it’s usually a good idea to keep your strategy nice and simple to keep those risks in check. I’ve found that pairing doji patterns with other technical indicators or a bit of trend analysis can really up your accuracy game. Never forget to use stop-loss orders—they’re like your safety net in a circus act.
Learning to trade with candlesticks usually takes time, patience and plenty of practice. Mistakes happen—they're just part of the journey, really.
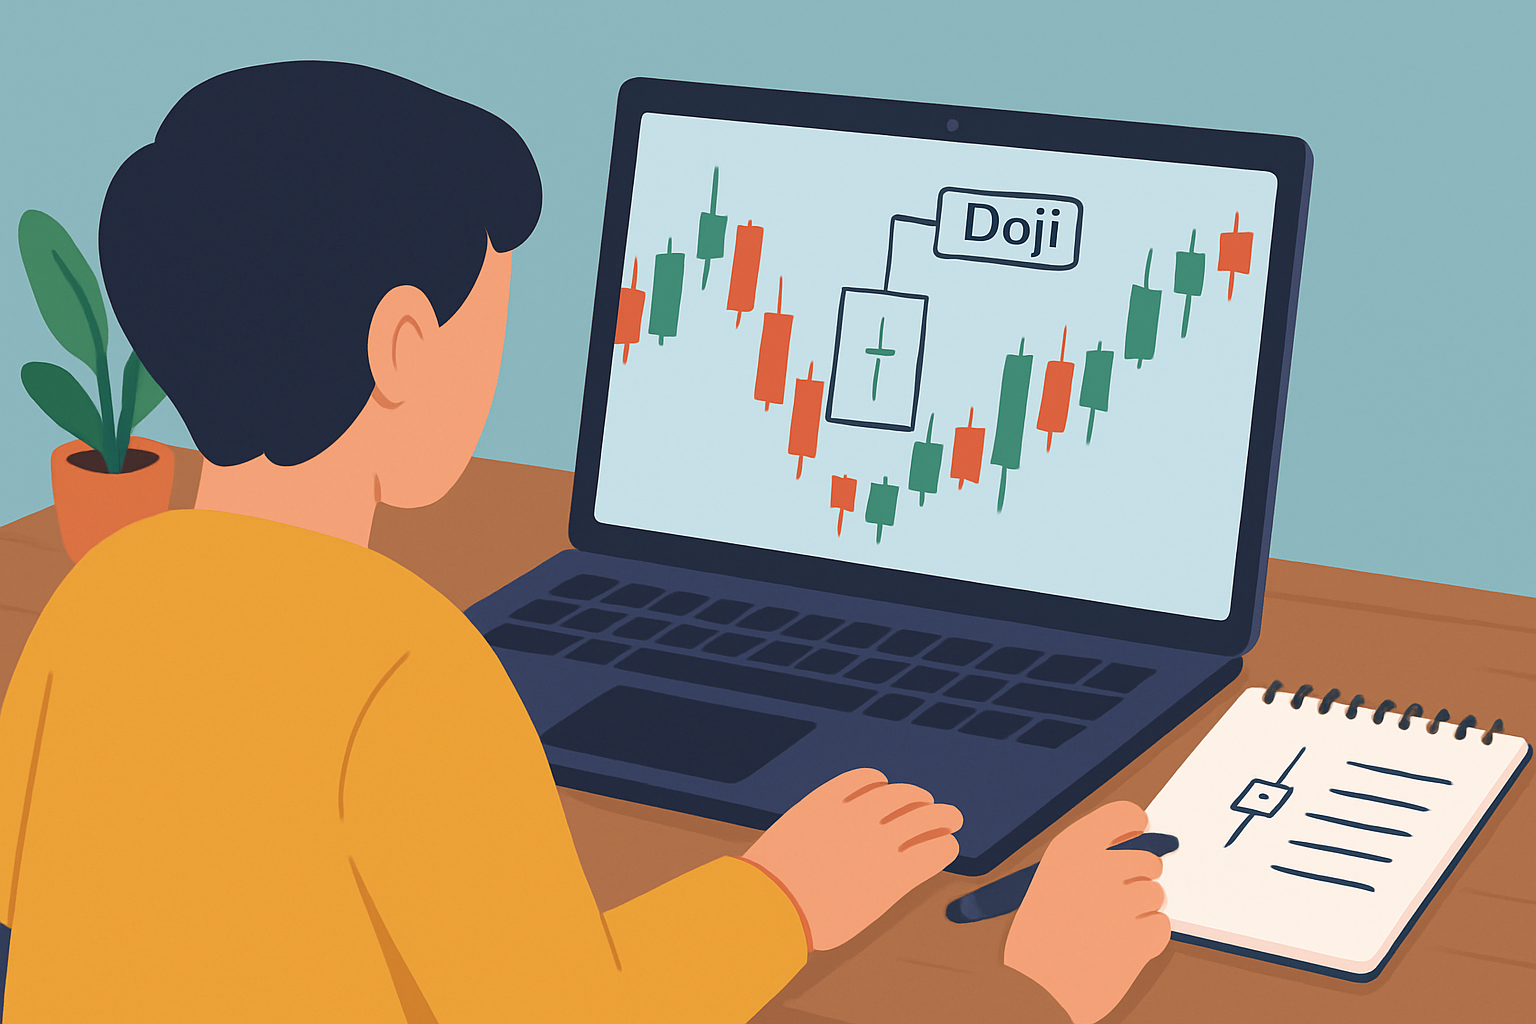
An image showcasing a beginner patiently studying candlestick charts with highlighted doji candles and learning materials.
Once you’ve wrapped your head around doji candlesticks it’s a smart move to jump into other candlestick patterns and really get a feel for how price action plays out. Platforms like TradingView are a goldmine, offering not just slick charting tools but also a global community where you can soak up insights from seasoned traders’ analyses. It’s a good idea to get your hands dirty by practicing with real market data on beginner-friendly exchanges like Binance or Coinbase—start small, and watch your confidence build bit by bit. Picking up a few books on technical analysis and tuning into free online courses can also sharpen your skills nicely.

Are you tired of juggling multiple tools for your trading needs? TradingView is the all-in-one platform that streamlines your analysis and decision-making.
With its powerful charting capabilities, real-time data, and vibrant community, TradingView empowers traders like you to stay ahead of the market. Join thousands who trust TradingView for their trading success.

20 posts written
Master the hammer candlestick pattern—a key indicator for market reversals. This beginner-friendly g...

Unlock the power of candle patterns to decode market psychology and improve your trading precision....
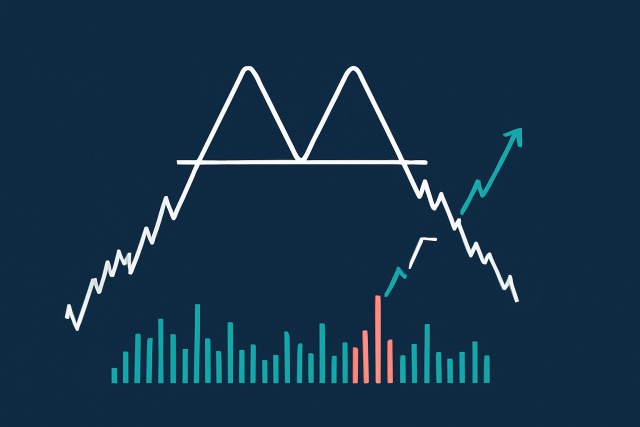
Discover how the double top pattern signals potential trend reversals in trading. Learn to identify,...

Discover what IOUs mean in finance, their role as informal debt acknowledgments, and how understandi...