


Technical Analysis
Understanding the Bullish Harami Candlestick Pattern
Discover the bullish harami candlestick pattern—a key technical signal that can hint at trend revers...

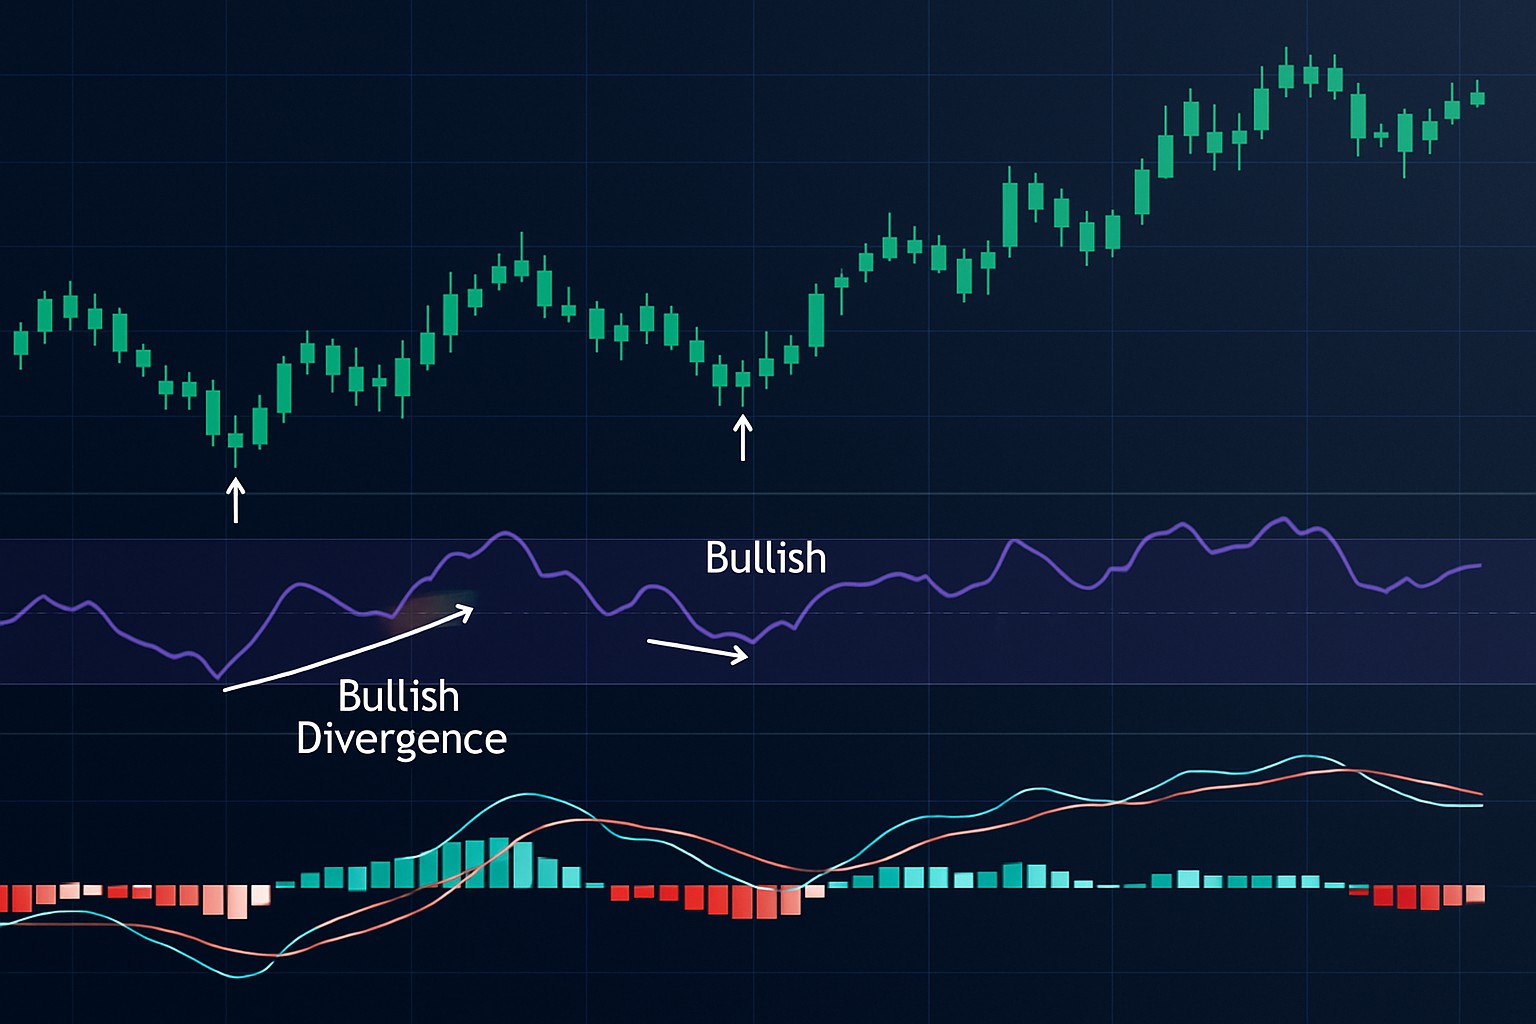
Bullish divergences throw out some pretty solid technical hints that usually shine a light on potential price reversals and sweet entry points right before the trend decides to take a turn.
Bullish divergence shows up when the price digs down to lower lows, but a momentum indicator like RSI or MACD starts painting higher lows instead—kind of like a subtle hint that selling pressure might be taking a breather. This little mismatch often flags a possible bounce or reversal, making bullish divergence a way more reliable signal than just eyeballing the price alone. Hidden bullish divergence is a bit trickier and quite fascinating: it happens when the price is sliding up with higher lows while the indicator dips down to lower lows, suggesting the trend isn’t giving up just yet and throwing a neat trading opportunity into the mix.
Spotting bullish divergence across different timeframes, whether you are darting in and out on minute charts or taking a relaxed approach with daily or weekly swings, requires a careful eye. Lower timeframes can be a wild ride filled with noise and false alarms. It’s wise to back up indicators like RSI and MACD with volume to avoid getting caught flat-footed. On the flip side, higher timeframes tend to sing a clearer tune but often demand patience. Think of it as waiting for the curtain to rise.
Pick the right oscillator or momentum indicator like RSI or MACD that truly jives with your chosen timeframe.
Take a good look at recent price lows and line them up with matching lows on your indicator—that’s where divergence patterns usually show their hand clearly.
Double-check those divergence signals by glancing at nearby higher or lower timeframes to get a better feel for their strength.
Confirm signals with volume spikes or shifts in momentum that tag along with the divergence to keep things legit.
Signal reliability isn’t one-size-fits-all. It tends to do better on longer timeframes where volatility calms down and you get stronger, more dependable divergences.
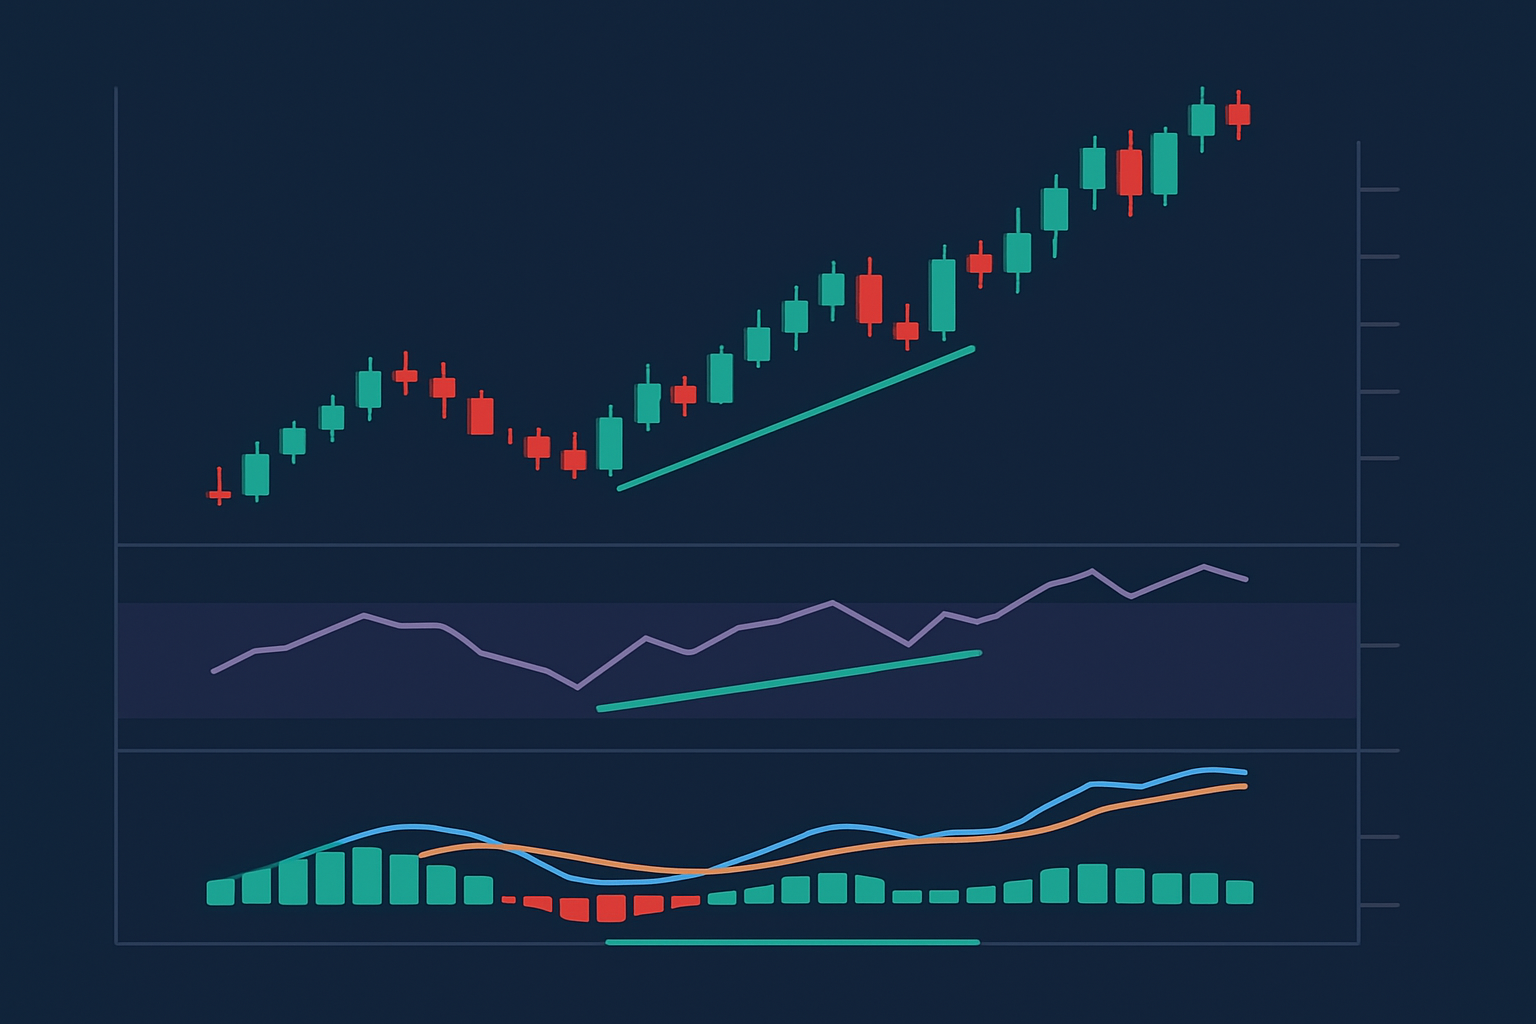
Example of bullish divergence visually identified on both daily and 1-hour charts using RSI and MACD indicators
Timing your entry when a bullish divergence pops up can really give your gains a nice nudge while helping you keep risk in check. Seasoned traders usually like to back up those divergence signals with other clues—think support levels, bullish candlestick patterns like hammers or engulfing bars and noticeable spikes in volume—to make their confirmation more bulletproof. It often pays off to wait for a slight pullback in price and set tight stop losses close to swing lows.
Bullish divergence often signals promising setups but keeping a firm grip on disciplined risk management is absolutely key. Tweaking your position size to match your personal risk tolerance and placing stop-loss orders just below divergence swing lows goes a long way in safeguarding your hard-earned capital. Trailing stops can be a real lifesaver for locking in profits as momentum picks up steam.
Figure out your position size so you only risk a modest slice of your trading capital on each trade. There is no need to bet the farm every time.
Set your stop-loss just below the confirmed bullish divergence swing low to avoid getting kicked out of the trade too soon. This gives yourself a little breathing room.
Use trailing stops to ride the price momentum and lock in profits as the trade moves in your favor. Think of it as letting your winners run, but not too far.
Plan where to take profits by pinpointing logical resistance levels or applying measured moves based on recent price swings. Having a game plan really makes a difference.
Resist the urge to chase every divergence signal. It is wiser to focus on a handful of well-confirmed setups rather than spreading yourself too thin with uncertain ones.
Traders often run into pitfalls with bullish divergence, such as mistaking false signals for the genuine article or losing sight of the broader market trends. Without that vital confirmation from volume or momentum, trades have a knack for falling flat. Setting stop-losses too tight or too loose can often trigger premature exits.
Boost the accuracy of bullish divergence trades by combining them with Fibonacci retracements, moving averages and trendlines. These tools act like your trading squad and work together to confirm signals and help you find clear entry points, gauge the trend's strength and spot possible reversals. A bullish divergence alongside a 61.8% Fibonacci retracement near a rising moving average is like getting a double thumbs-up to trust the trade.
| Indicator Combination | How It Enhances Divergence Signal | Example Trade Setup | Timeframe Preference |
|---|---|---|---|
| RSI + Fibonacci Retracement | Pinpoints those sweet spots where signals align for a much clearer entry | Look to buy near the 61.8% retracement level when the RSI hints at bullish divergence — it’s like catching the wave just as it starts to swell | Daily to Weekly |
| MACD Divergence + Moving Average | Helps double-check momentum shifts and trend direction by watching for that trusty MA crossover | Jump in when MACD bullish divergence gets the green light from an MA crossover, giving extra peace of mind | 1 Hour to Daily |
| Stochastic + Trendline Support | Gives extra muscle to divergence signals by using a trendline as a flexible support zone | A solid play is buying when stochastic points to bullish divergence right at a trendline bounce — timing is everything here | 4H to Daily |
| Volume + Divergence Signals | Volume spikes act like a shout-out confirming genuine momentum behind divergence moves | Consider entering trades once divergence signals sync up nicely with volume surges — it’s like having a buddy vouch for the trade | All timeframes |
| Bollinger Bands + Divergence | Pairing band breakouts with divergence often lights up clues for strong price moves | The sweet spot is entering on bullish divergence near support at the lower band — kind of like catching a spring at just the right stretch | Short to Medium term |
Pairing RSI with Fibonacci retracements often lights up those sweet entry points at key pullback zones. Similarly, when MACD divergence gets a thumbs-up from a moving average crossover it usually adds solid confirmation to the trend. Stochastic divergence that coincides with trendline support can really hone in on timing—especially for swing traders who like to play the medium timeframes.
Pick the timeframe and financial market that fit your trading style and goals.
Watch for bullish divergence using your favorite momentum indicators such as RSI or MACD. Pay close attention to swing lows that reveal subtle signals.
Don’t rely on just one signal. Cross-check with other trusted technical tools like support zones, volume spikes, classic candlestick patterns or important moving averages.
Create a solid plan that clearly defines your entry point, a stop-loss just below the divergence low and profit targets that are ambitious yet attainable.
Follow your plan closely and keep a detailed trading log. Make it a habit to review what worked and what didn’t. This is how you improve over time.
Sticking to this systematic trading plan keeps you from falling into common traps of emotional bias and guesswork. By blending careful analysis with solid risk management and honest trade reviews, you build a repeatable edge that capitalizes on bullish divergences across any timeframe.

Are you tired of juggling multiple tools for your trading needs? TradingView is the all-in-one platform that streamlines your analysis and decision-making.
With its powerful charting capabilities, real-time data, and vibrant community, TradingView empowers traders like you to stay ahead of the market. Join thousands who trust TradingView for their trading success.

10 posts written
Discover the bullish harami candlestick pattern—a key technical signal that can hint at trend revers...

Discover what IOUs mean in finance, their role as informal debt acknowledgments, and how understandi...

Unlock the power of the head and shoulders pattern with this complete guide. Learn to spot, trade, a...

Unlock the power of the bear flag pattern with our practical, step-by-step guide. Understand market...