


Technical Analysis
Understanding the Bullish Harami Candlestick Pattern
Discover the bullish harami candlestick pattern—a key technical signal that can hint at trend revers...

The bear flag pattern is a handy little tool in technical analysis that helps traders get a heads-up on when a downtrend is likely to keep going. Mastering this setup can really pay off, letting traders spot prime opportunities for short selling and keep risk in check
A bear flag pattern pops up as a short-lived bullish pause right after a sharp drop in price. Think of it as a small, upward-sloping channel or rectangle that sticks out amid the ongoing downtrend.
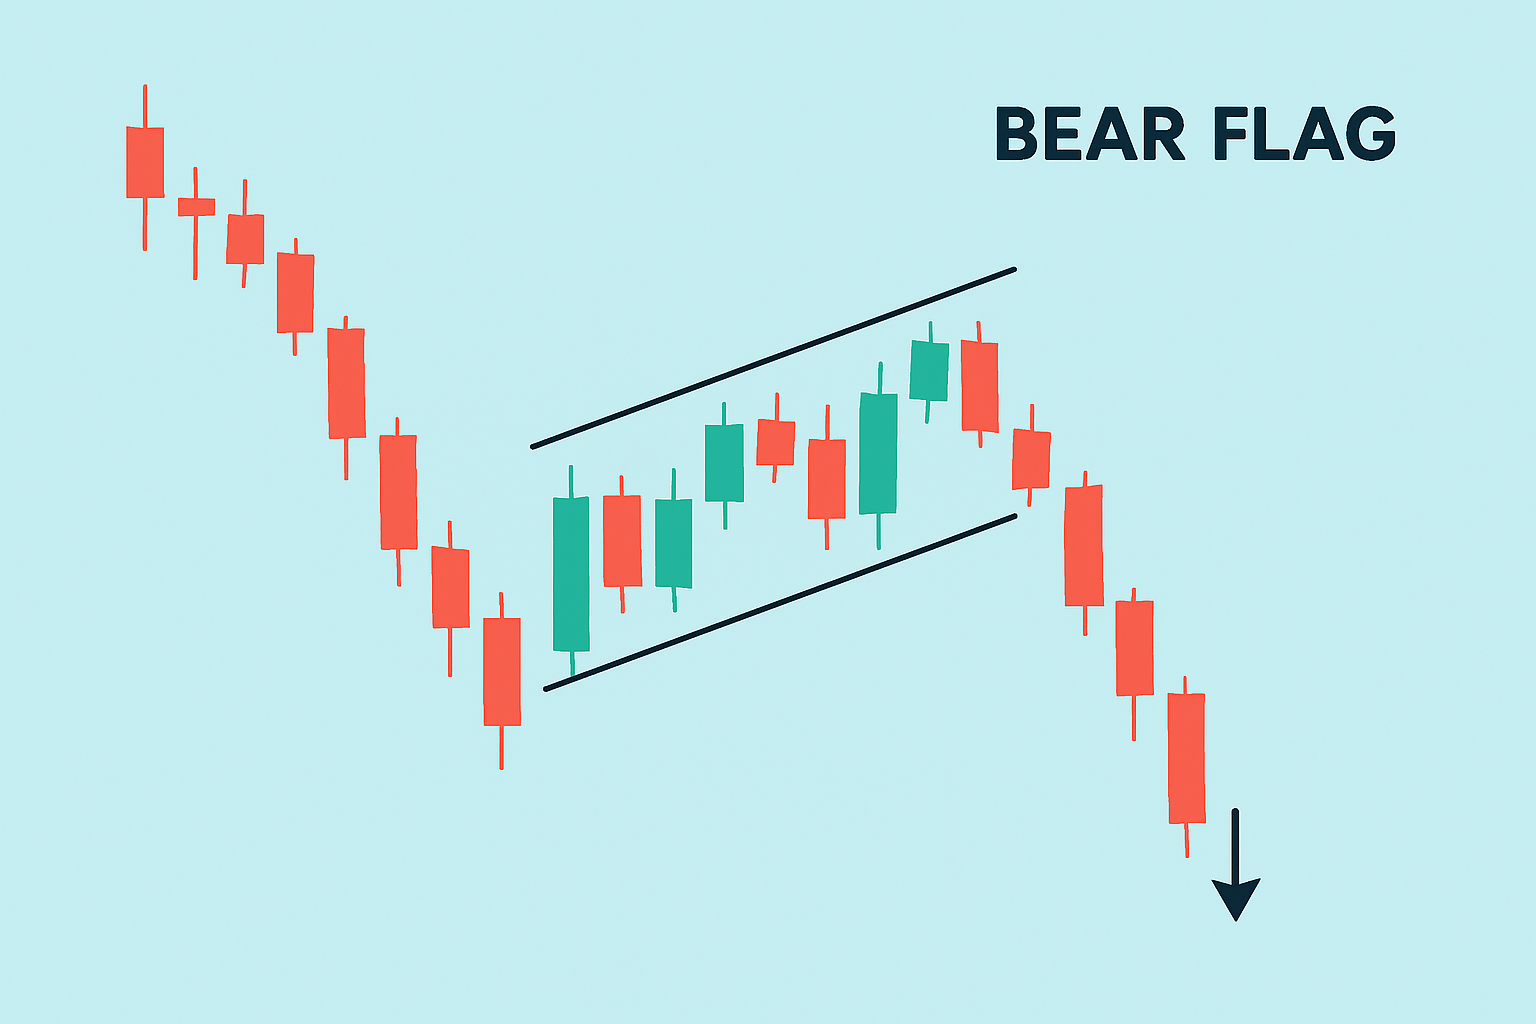
Visual illustration of a bear flag pattern showing the flagpole, consolidation flag, and breakout point.
Identify a clear and strong downtrend leading up to the pattern that traders call the flagpole. This shows bearish momentum remains dominant.
Observe the flag: a brief period of upward or sideways movement often slightly sloping upward with prices confined within parallel trendlines.
Confirm that volume decreases during the flag's formation as this typically signifies temporary profit-taking without a complete reversal.
Watch for a breakout below the flag's lower trendline, preferably with an increase in volume. This usually signals the downtrend will continue.
A common pitfall I have noticed is mistaking sideways price movement or those uneven pullbacks for a bear flag. True bear flags usually show a clear consolidation channel, defined by parallel trendlines and a noticeable drop in volume.
In a bear flag setup sellers grab the reins early and push prices sharply downward—that's the flagpole in action. After that traders who got in short early often take a breather by locking in profits while some hopeful buyers step in thinking there might be a quick bounce. This leads to a slight upward channel or a bit of sideways shuffle. But more often than not it is just a pause, not a full-on reversal. Meanwhile sellers quietly regroup behind the scenes. Once the flag's support finally gives way selling pressure ramps up again with renewed gusto.
"> Getting a handle on those subtle shifts in market sentiment can really turn what looks like just another technical pattern—like the bear flag—into a genuinely useful signal, rather than leaving you staring at chart details wondering what to make of them." — Financial Market Analyst
Set alerts just below the flag's lower boundary to catch the breakout right as it happens. Timing is everything here so don’t miss the boat.
Place entry orders a bit below the flag’s support line to make sure the downtrend is actually continuing before jumping in because patience pays off in spades.
Use a stop loss just above the flag’s upper trendline to keep your risk in check in case the breakout fizzles and the price decides to backtrack.
Figure out your price target by measuring the flagpole’s length and then projecting that distance downward from the breakout point. It’s like having a roadmap for where the price might head next.
Manage your risk like a pro by sizing your position wisely and avoiding over-leveraging. Protecting your capital during those wild swings can make all the difference in the long run.
Timing your entry really matters more than you might think. Waiting for a confirmed breakout candle to close tends to lead to better trades—at least, that’s what I’ve noticed over time. Slapping a stop-loss just above the flag's resistance can be a smart move to keep losses in check if the pattern decides to fall apart.
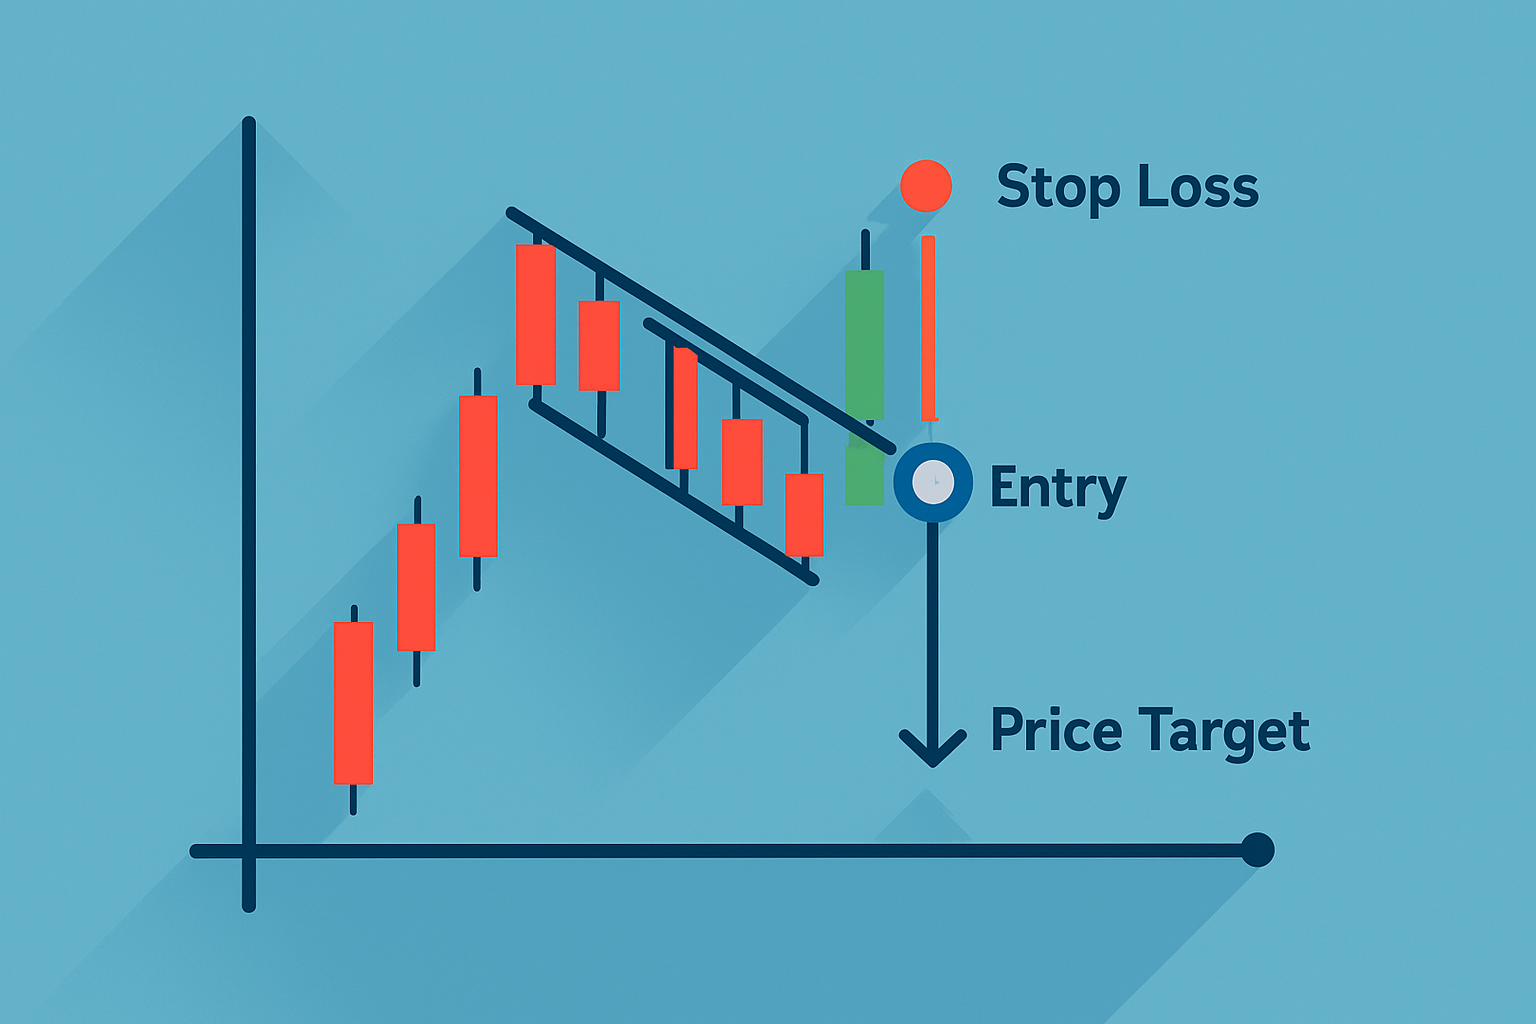
Example trade setup for a bear flag pattern including entry point, stop loss, and price target.
Grasping these challenges can help you fine-tune your strategy for bear flag trading. Be sure the consolidation is real. Lean on volume as your trusty sidekick for confirmation and always keep the bigger market picture in your rearview mirror to improve consistency.
Give your bear flag analysis a boost by using technical tools like volume-based indicators, moving averages and momentum oscillators such as RSI. These handy tools often come through in the clutch by confirming the flag’s strength and sharpening your trade timing.
You can easily weave these tools into your routine by tweaking your charting platform settings to spot a bear flag pattern and setting up some automated alerts to catch those sneaky moves. Always double-check signals before diving into a trade.

Tired of missing opportunities and making suboptimal trading decisions? TrendSpider's cutting-edge platform automates complex technical analysis, saving you time and reducing human error.
With multi-timeframe analysis, dynamic alerts, backtesting, and customizable charting, you'll gain a competitive edge in identifying trends and making informed trades across global markets.

20 posts written
Discover the bullish harami candlestick pattern—a key technical signal that can hint at trend revers...

Unlock the power of the head and shoulders pattern with this complete guide. Learn to spot, trade, a...
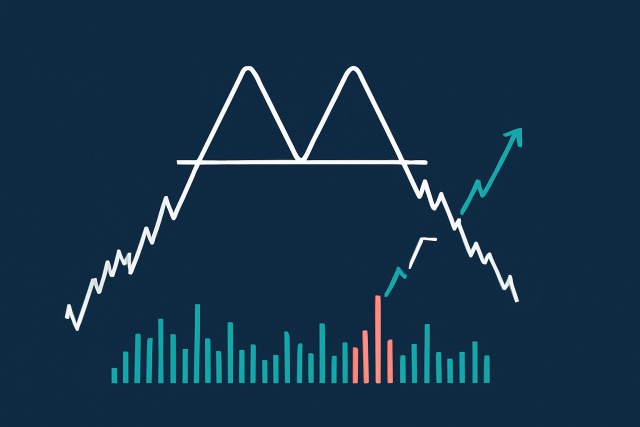
Discover how the double top pattern signals potential trend reversals in trading. Learn to identify,...

Master the hammer candlestick pattern—a key indicator for market reversals. This beginner-friendly g...