


Technical Analysis
Understanding the Bullish Harami Candlestick Pattern
Discover the bullish harami candlestick pattern—a key technical signal that can hint at trend revers...

The pennant pattern holds a pretty key spot in technical analysis often serving as a handy signal for traders on the lookout for potential breakout opportunities. In this article, we’ll unravel the pennant pattern by diving into its structure and key characteristics and we’ll walk you through how to read it like a pro to spot those clear continuation breakouts across a variety of financial markets.
A pennant pattern is a short-term continuation formation on price charts, characterized by converging trendlines that form a neat little symmetrical triangle. It usually pops up right after a strong price move, acting like a brief timeout or a quick breather before the trend decides to hit the gas again.
Pennant patterns are pretty important because they signal a brief breather in a strong price trend before things get back on track in the same direction. Catching these patterns early can give traders a nice little heads-up for breakout trades, letting them hop on the momentum bandwagon just in time. Since pennants usually hint at continuation rather than a reversal, they provide clean and simple setups for trend-following strategies.
Spotting pennant patterns is about watching price movement and volume across different timeframes. Typically you’ll notice a strong push before two trendlines squeeze together and form a neat symmetrical triangle.
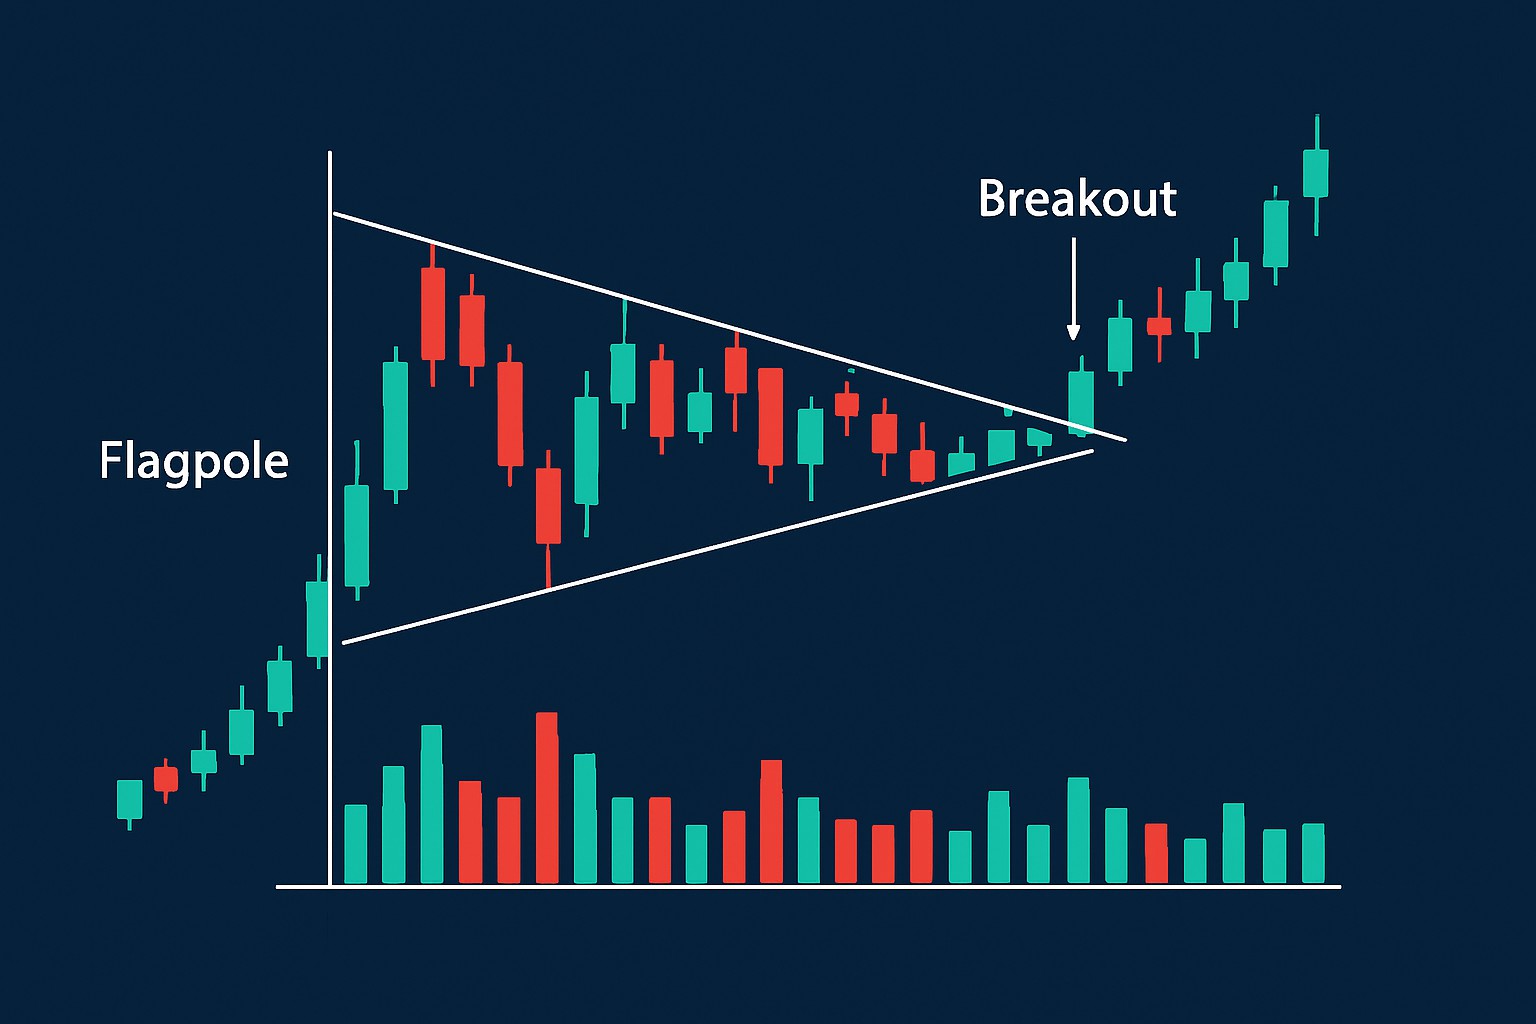
Spot a strong and distinct price move leading into the pattern often called the flagpole that shows solid momentum at play.
Keep an eye out as the price settles into two converging trendlines crafting a neat symmetrical triangle.
Notice how the volume tends to drop off during this consolidation phase like the market catching its breath.
Be ready to pounce when the price breaks out above or below the pennant edges, usually accompanied by a volume surge that gives you a better-than-good feeling the trend is set to keep rolling.
Parallel trendlines rather than the converging kind you see in pennants. Without a clear, sharp move leading up to them. Overlooking how volume contracts and expands can really trip you up, since those subtle shifts are vital for confirming pennants.
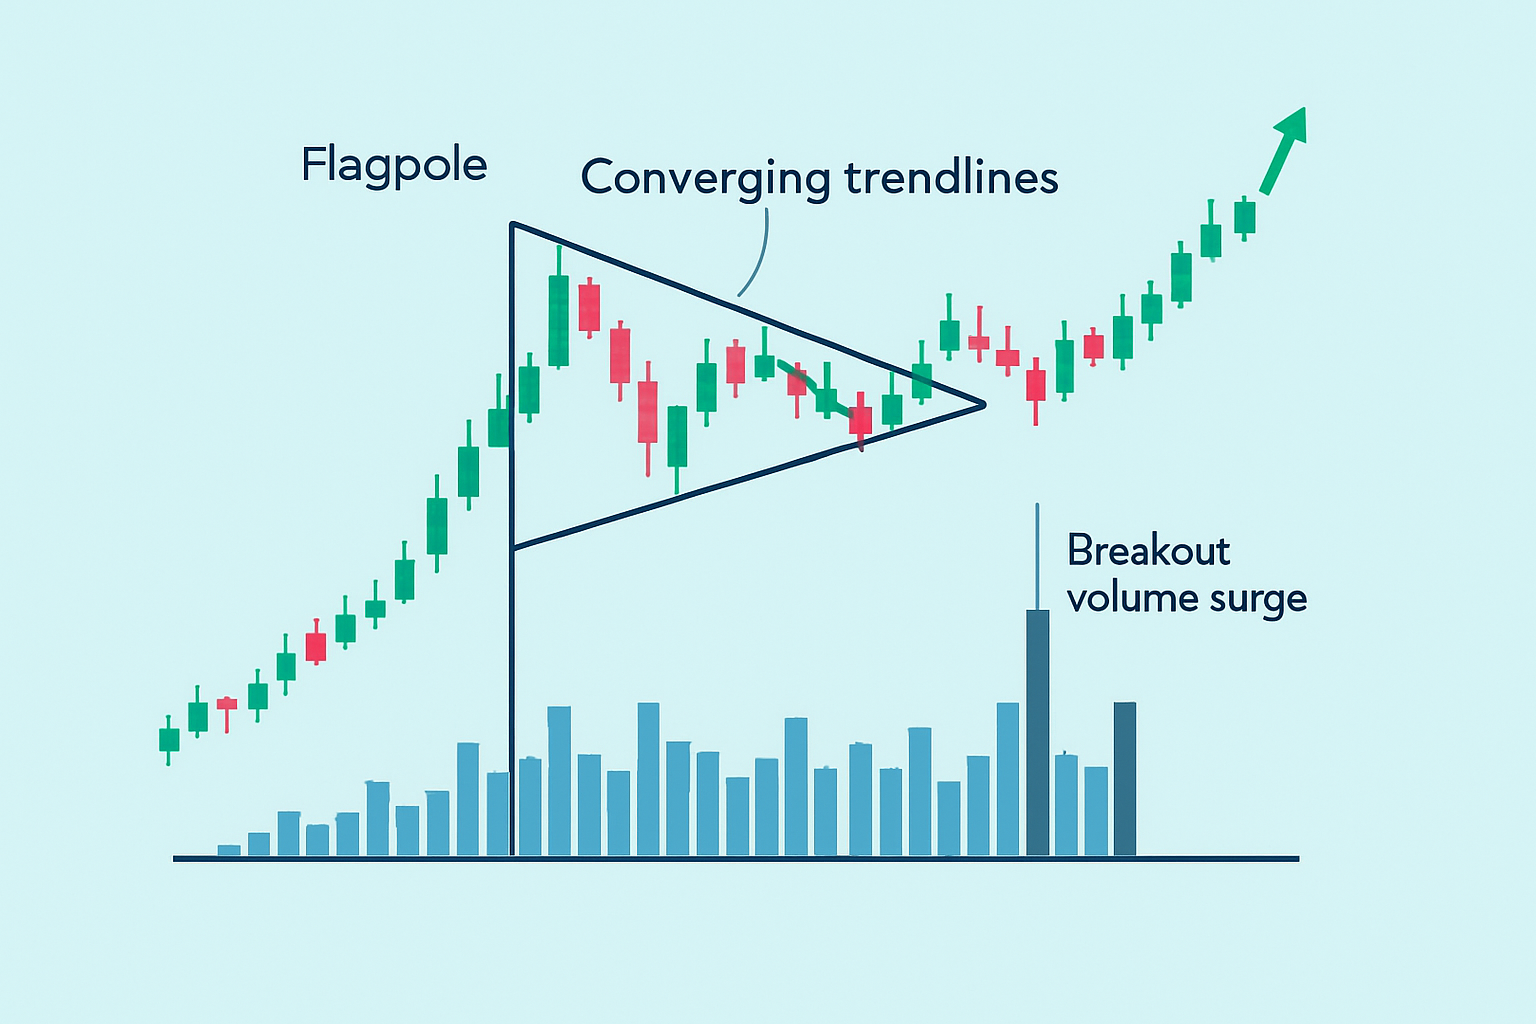
Price chart showing a pennant pattern with labeled flagpole, converging trendlines, and volume contraction followed by breakout volume spike
Pennants often get mixed up with flags and symmetrical triangles but there are some clear differences to keep in mind. Flags usually show parallel trendlines that hint at sideways consolidation. Pennants have trendlines that converge and form a small triangle shape you can spot in a blink. Symmetrical triangles tend to develop over longer stretches without a strong lead-up move and feature wider price swings—like the market taking a leisurely stroll before deciding where to go next.
| Pattern Type | Shape Characteristics | Duration | Volume Patterns | Typical Breakout Behavior |
|---|---|---|---|---|
| Pennant | A small, neat symmetrical triangle created by converging trendlines | Short-term (1-3 weeks) | Volume tends to quietly shrink during consolidation, then suddenly jumps at breakout, catching many off guard | Usually breaks out swinging in the direction of the prior trend, with a sharp and decisive move |
| Flag | A rectangle or parallelogram framed by parallel trendlines, looking like a little flag waving in the market breeze | Short-term (few days to weeks) | Volume often takes a bit of a nap during consolidation before picking up speed on breakout | Breakout typically picks up where the prior trend left off, often moving steadily and without fuss |
| Symmetrical Triangle | A larger triangle formed by converging trendlines, stretching over a longer timeframe, requiring a bit more patience | Medium-term (weeks to months) | Volume usually tapers off gradually, with fewer obvious spikes to get excited about | Breakout direction can be a bit of a wild card, making it less predictable than the straightforward pennants |
Which pattern to trade often boils down to the market context and the timeframe you are juggling. Pennants usually shine in fast-moving trend continuation scenarios, offering tighter trade setups and clearer breakout signals that almost feel like a wink from the market. Flags tend to be the go-to for traders craving a bit more stability during those consolidation phases, while symmetrical triangles demand a keen eye on volume and breakout nuances.
A breakout from a pennant pattern is confirmed when the price pushes beyond the converging trendlines with a noticeable uptick in volume. This gives a solid hint that the prior trend is likely to keep on truckin'. Typically the breakout follows the initial move of the flagpole, whether that is a climb or a drop. Traders usually keep a keen eye out for bursts in volume and momentum indicators to back up the signal.
False breakouts catch traders off guard, especially when the price briefly sneaks past trendlines but then quickly pulls back without gaining any real steam. To dodge the pitfall of jumping in too early, it’s usually wiser to wait for the candle to close and keep an eye out for a solid volume spike backing the move.
When you weave pennant patterns into your trading strategies, it’s key to first make sure the pattern is legit and then patiently wait for a crystal-clear breakout. Managing risk with stop-loss orders and setting profit targets is absolutely essential—think of it as your safety net. Using the height of the flagpole often comes in handy to nail down realistic take profit points.
Make sure you can clearly pick out the flagpole and those converging trendlines without any guesswork.
Be patient and wait for a breakout that’s supported by a decent uptick in volume because it’s like the market’s way of waving a green flag.
You’ve got two solid options here: jump in right at the breakout or play it a bit safer and enter after a successful retest of that breakout level.
Place your stop loss just below the pennant’s base if you’re going bullish or just above it for bearish trades. That’s your safety net to keep risk comfortable.
Use the height of the flagpole as your guiding light for setting profit targets. Don’t be shy about locking in some gains or tweaking your stops as the trade develops.
Good risk management and smart position sizing can genuinely give your trades based on pennant breakouts a much-needed boost in reliability. By keeping your exposure in check and tweaking positions with care, traders have a better shot at protecting their capital from those pesky false signals that sneak in. Meanwhile, leaning on trustworthy technical tools like TradingView’s user-friendly charts and TrendSpider’s automated pattern detection usually makes the whole decision-making process feel a lot less like guesswork.
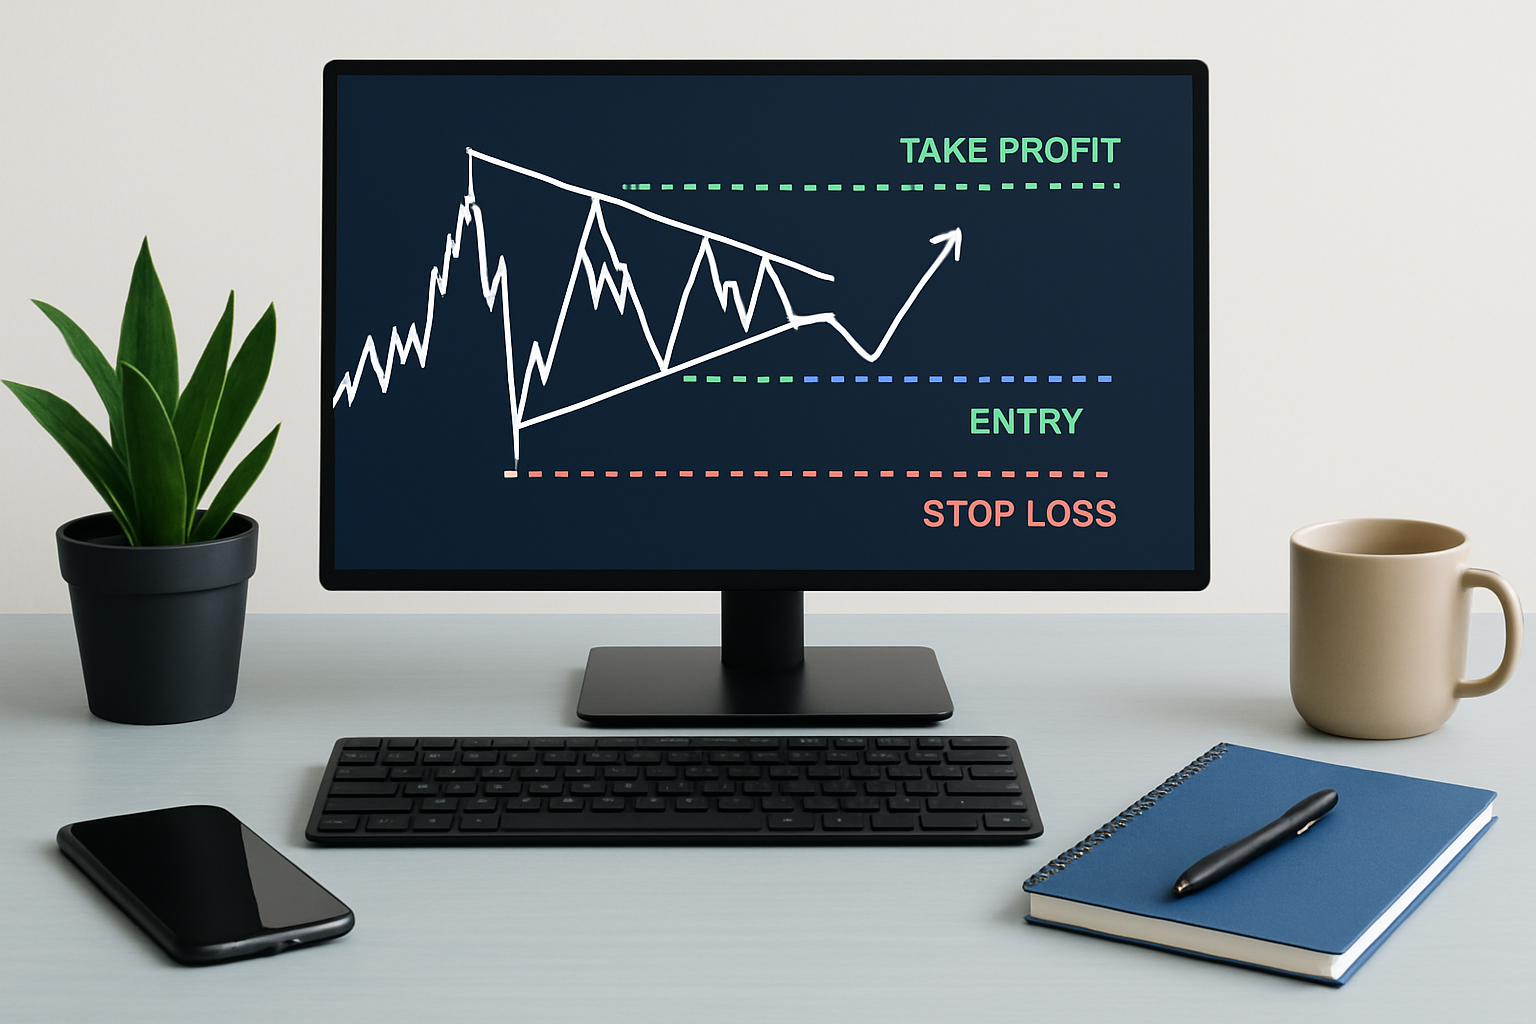
Chart displaying a pennant pattern with clear trade entry, stop loss, and profit target annotations
Many traders tend to fall into the trap of thinking pennant patterns always lead to breakouts or behave the same way regardless of the market environment. It’s easy to overlook important details like volume or to expect a breakout the moment consolidation wraps up. Trust me, it doesn’t always work that neatly.
Getting a solid grip on these clarifications really helps traders dodge common pitfalls and fine-tune the way they work with pennant patterns. By mixing in volume analysis and patiently holding for a breakout to confirm itself while staying flexible with changing market vibes, traders can put together setups that aren’t just hit or miss but genuinely dependable.

Are you tired of juggling multiple tools for your trading needs? TradingView is the all-in-one platform that streamlines your analysis and decision-making.
With its powerful charting capabilities, real-time data, and vibrant community, TradingView empowers traders like you to stay ahead of the market. Join thousands who trust TradingView for their trading success.

23 posts written
Discover the bullish harami candlestick pattern—a key technical signal that can hint at trend revers...

Unlock the power of the head and shoulders pattern with this complete guide. Learn to spot, trade, a...

Unlock the power of the bear flag pattern with our practical, step-by-step guide. Understand market...

Learn how the harami candlestick pattern signals potential market reversals. This guide breaks down...