


Technical Analysis
Most Important Candle Patterns Every Trader Should Know
Unlock the power of candle patterns to decode market psychology and improve your trading precision....

The double top pattern is often viewed as a pretty reliable red flag that an uptrend might be winding down and a downtrend could be right around the corner. But just spotting this pattern on its own doesn’t always give you the full confidence you need to pull the trigger on a trade. That’s where volume data steps in—it’s like the secret sauce that reveals the real muscle or the hidden weakness behind those price moves.
A double top pattern is a classic bearish reversal sign that usually pops up after a solid run-up in price. It’s marked by two distinct peaks hitting roughly the same price level, hinting that the market keeps running into a stubborn wall of resistance it just can’t push past.
Volume tells you how many shares or contracts are changing hands over a given period, and it’s a handy little indicator for confirming price patterns. When you pair volume with price action, it’s like having a backstage pass to the strength behind market moves. Take the double top, for example—checking out volume patterns there can really help you figure out if those price peaks have genuine buying and selling muscle behind them.
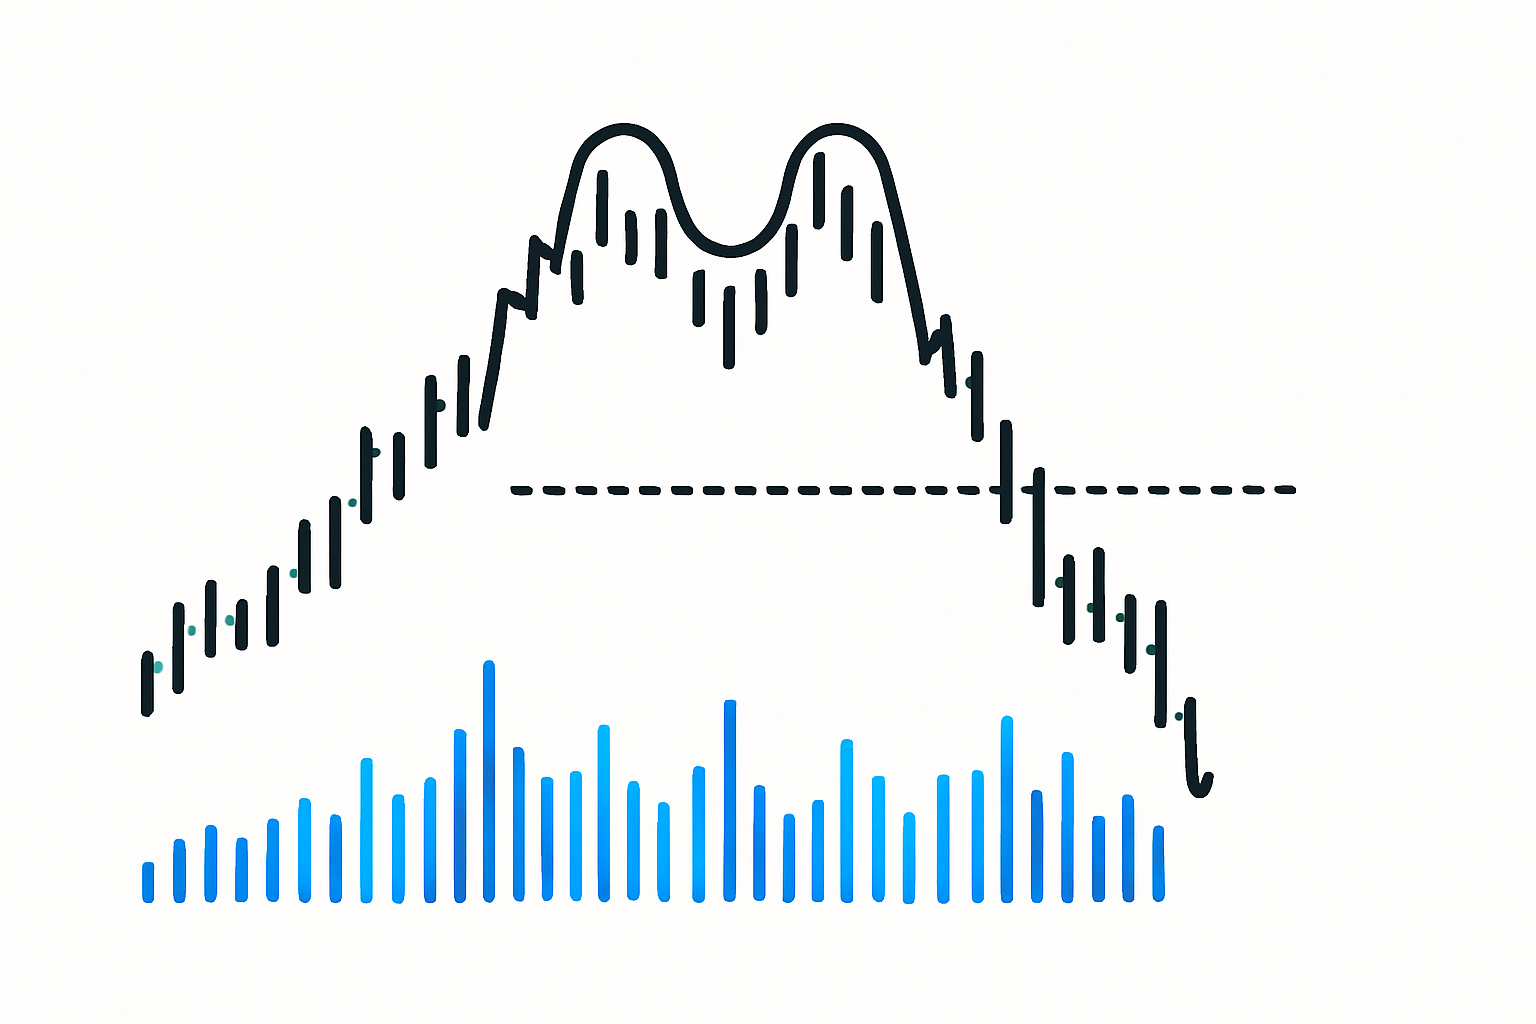
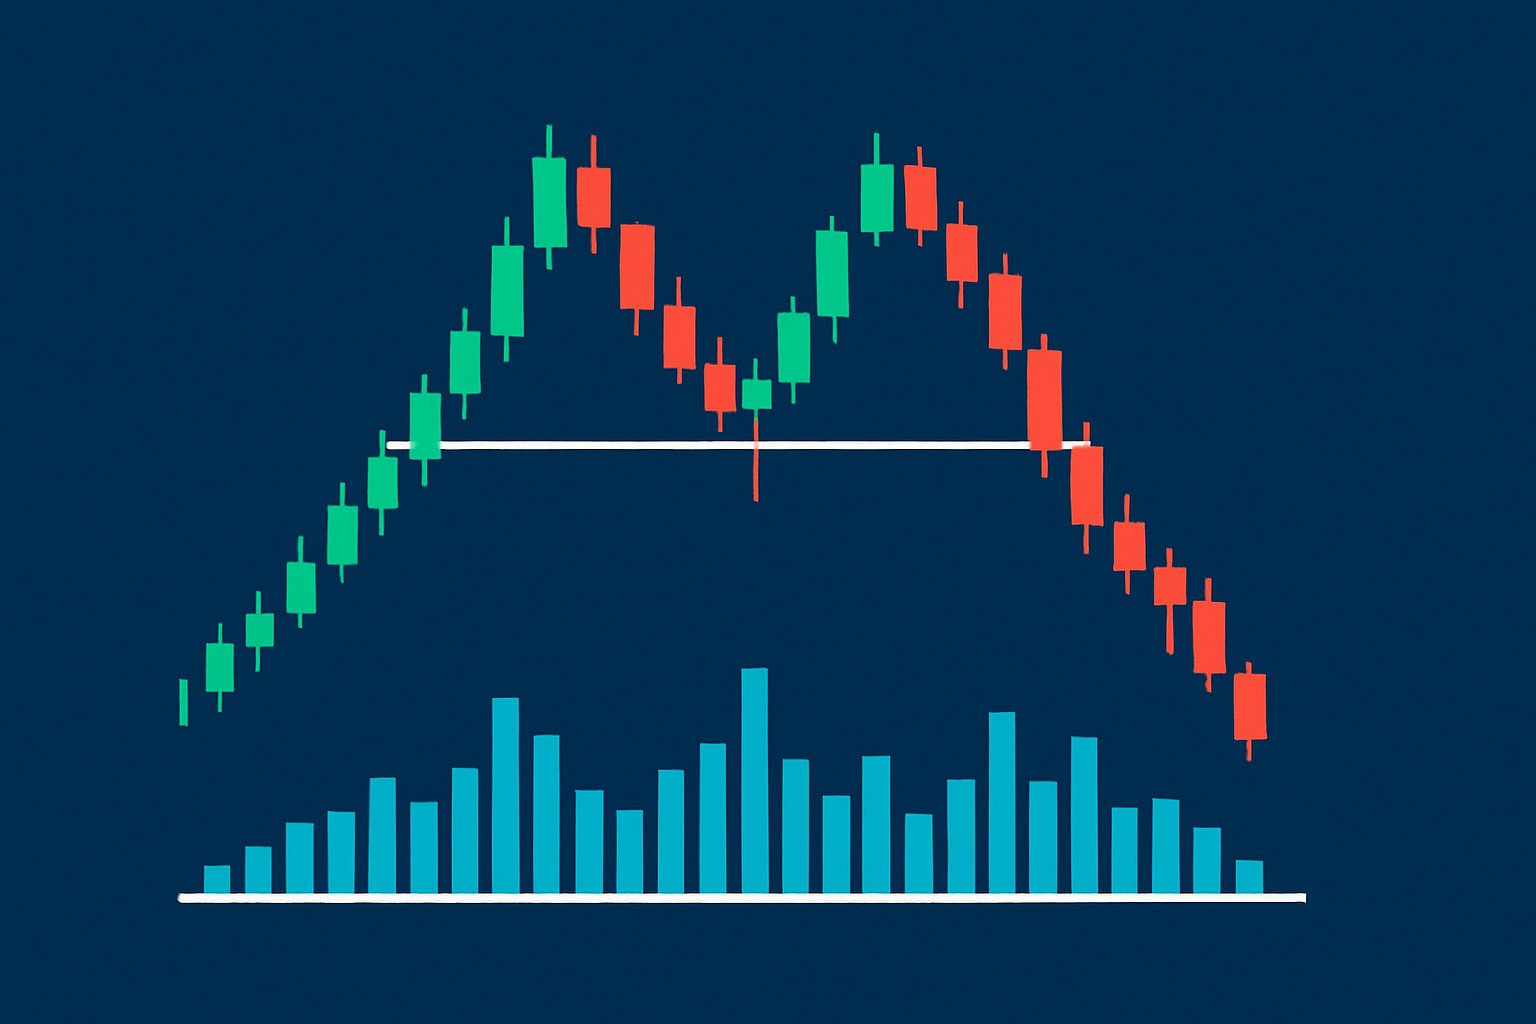
A price chart illustrating a double top pattern with corresponding volume bars highlighting key volume changes confirming the pattern
Clearly spot two key price peaks that hit about the same level. This is your classic hint of a potential double top pattern and a real red flag in price action.
Keep an eye on the volume during the first peak because a noticeable rise here usually signals serious buyer interest supporting the move.
Peek at the volume during the dip between those peaks. A drop often indicates some hesitation as if buyers and sellers are in a subtle tug of war.
Watch for volume fading during the second peak. It’s a common sign that momentum is running out of steam and fewer buyers are stepping up.
Nail down the pattern by spotting a volume spike when the price drops below the neckline support. This is the smoking gun.
See if higher volume stays around and the price continues sliding after the breakout. That’s your solid confirmation that sellers are in control for now.
Carefully following each step really helps traders read volume signals with a bit more confidence. Take the neckline breakout, for instance—a noticeable jump in volume here usually plays a starring role. If that’s missing, you end up with a pattern that just can’t quite hold its weight. It’s wiser to focus on patterns where volume and price movement move together instead of pulling in opposite directions.
While double tops often point to a solid reversal, they can occasionally throw a curveball with false signals especially when volume data gets misread or ignored. Traders sometimes confuse mere consolidation or background market noise for the real deal. This often leads to jumping in too soon or pulling the trigger on the wrong trades.
Confirming double top patterns with volume usually works best when you use advanced charting platforms. Popular choices like TradingView and TrendSpider come with useful tools such as On-Balance Volume (OBV), Volume Weighted Average Price (VWAP) and volume oscillators. These let traders look beneath the surface and follow volume trends as they happen in real time. These indicators do more than just sit there. They automate volume analysis, assist with pattern recognition and send alerts, making it easier to spot valid double tops instead of searching for a needle in a haystack.
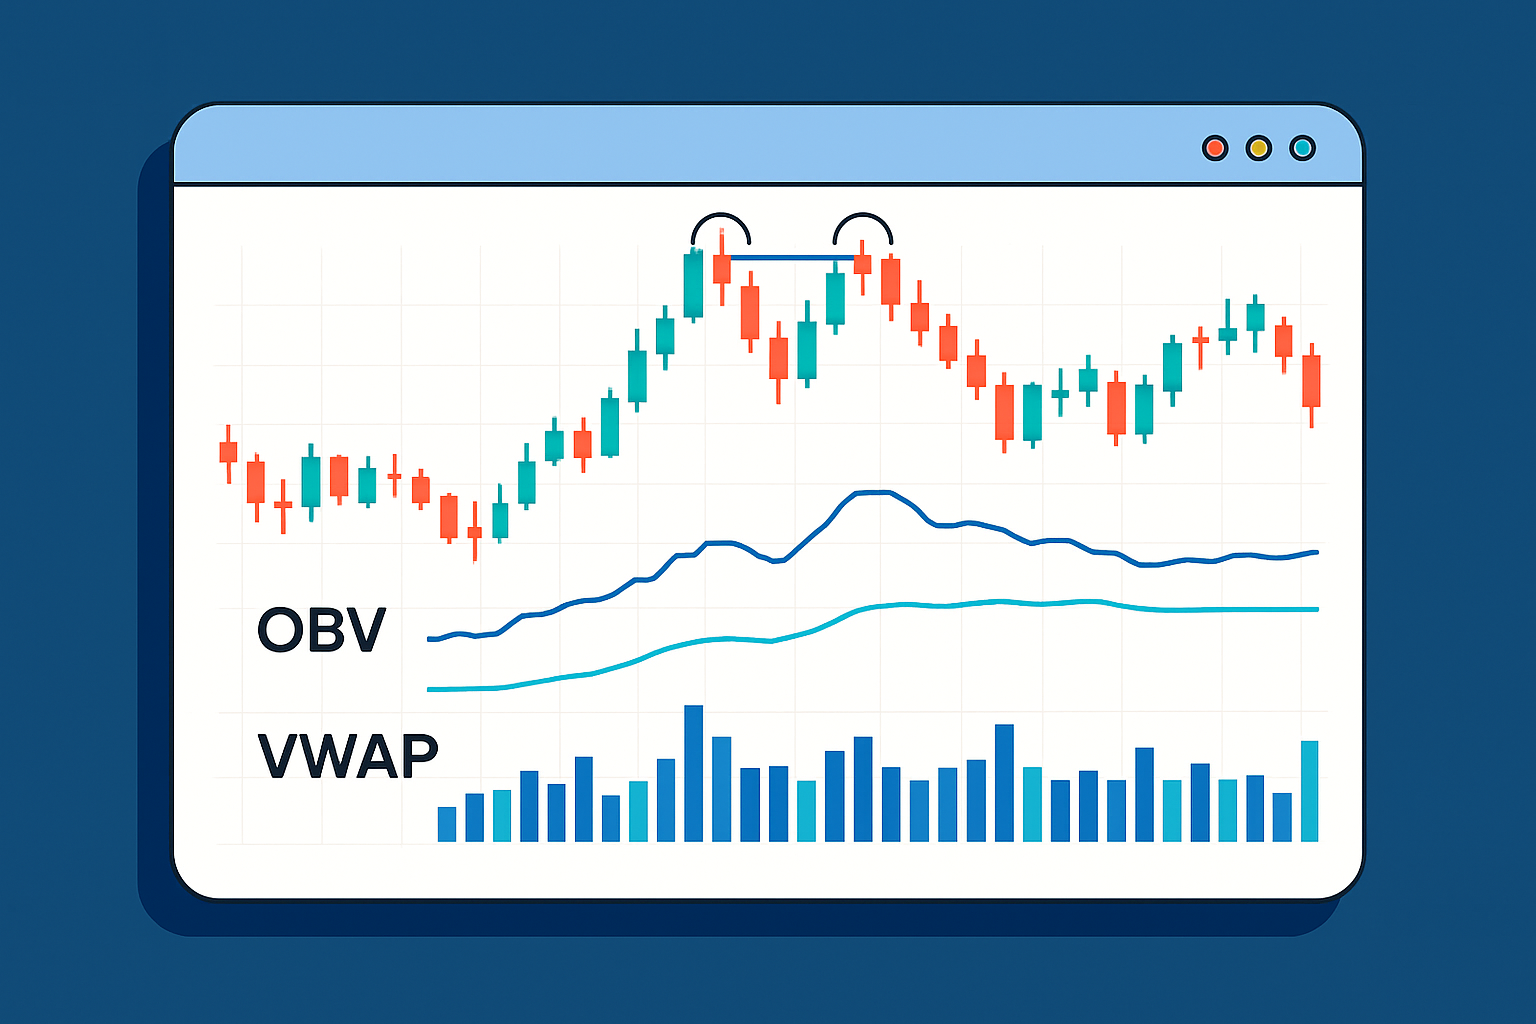
TradingView chart showing a double top pattern combined with volume indicators such as On-Balance Volume and VWAP
Take a recent case from the cryptocurrency market on Binance where Bitcoin's price formed a classic double top pattern—two distinct peaks sitting almost shoulder to shoulder in terms of level. The first peak popped up on high volume signaling eager buying action. Then as the market took a breather volume tapered off during the dip—like a crowd momentarily stepping back to catch their breath. When the second peak rolled around it came with noticeably less volume hinting that buyer enthusiasm was slipping away. Finally, a sharp spike in volume hit when the price broke below the neckline putting the sellers firmly in the driver’s seat.

Are you tired of juggling multiple tools for your trading needs? TradingView is the all-in-one platform that streamlines your analysis and decision-making.
With its powerful charting capabilities, real-time data, and vibrant community, TradingView empowers traders like you to stay ahead of the market. Join thousands who trust TradingView for their trading success.

19 posts written
Unlock the power of candle patterns to decode market psychology and improve your trading precision....

Discover the doji candlestick—a powerful price action signal revealing market indecision. This begin...

Discover the bullish harami candlestick pattern—a key technical signal that can hint at trend revers...

Master the hammer candlestick pattern—a key indicator for market reversals. This beginner-friendly g...