


Technical Analysis
Master the Bear Flag Setup
Unlock the power of the bear flag pattern with our practical, step-by-step guide. Understand market...

The descending triangle pattern is a classic chart formation in technical analysis that often signals potential price breakdowns. Getting the hang of spotting this pattern can really give traders a leg up, allowing them to anticipate market moves more confidently.
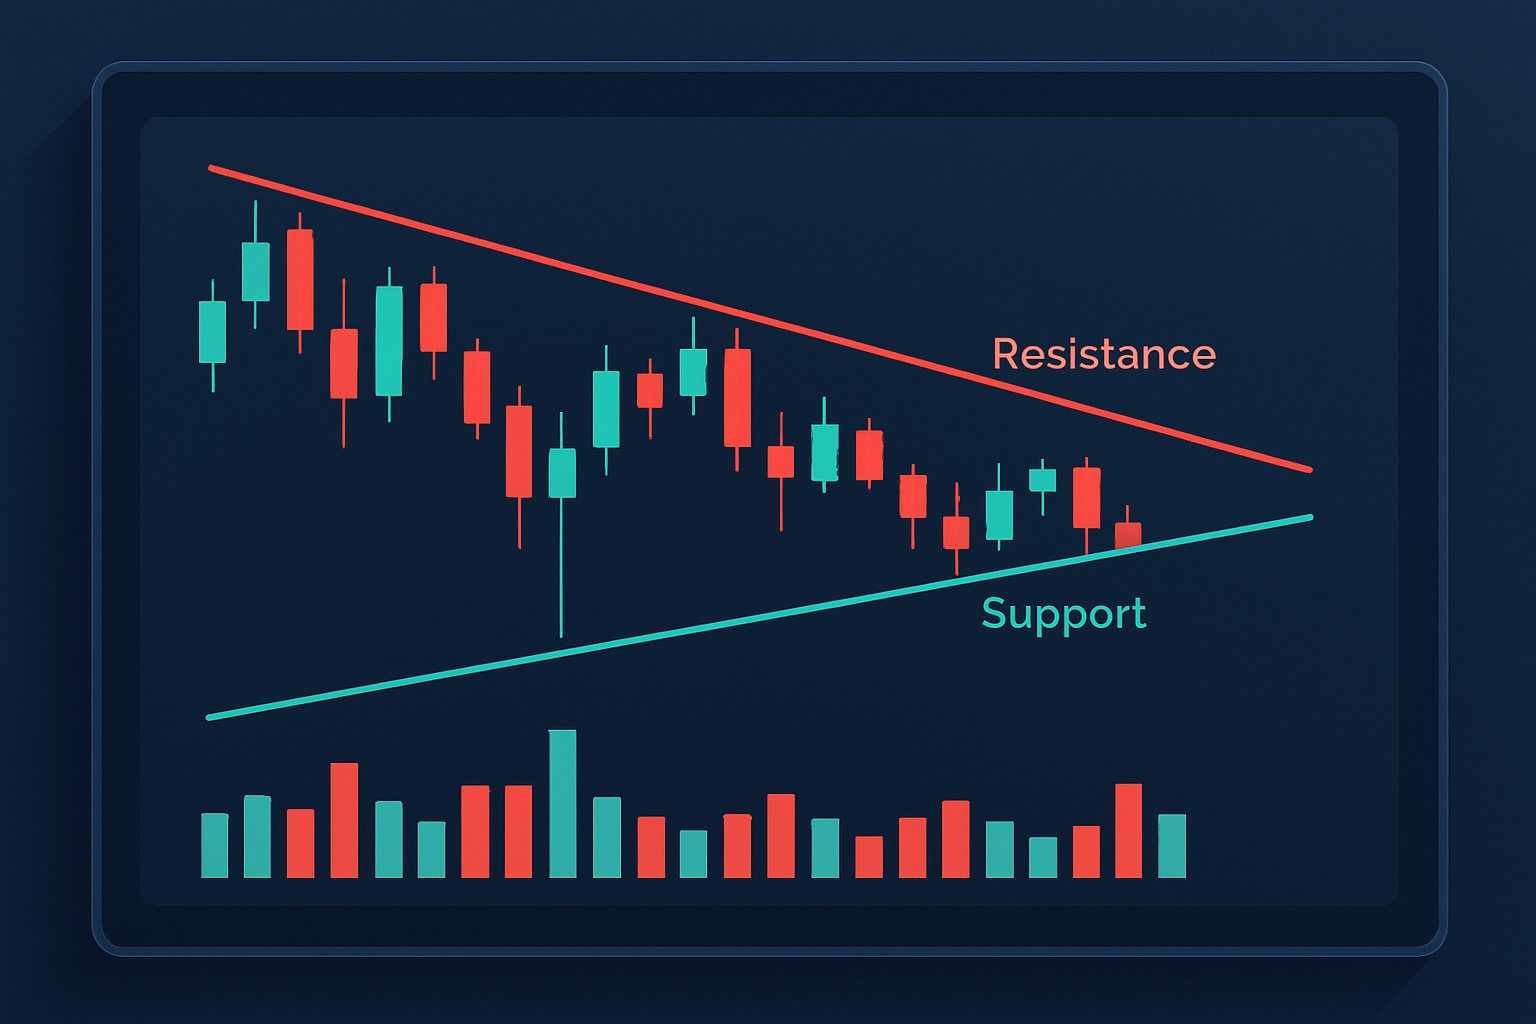
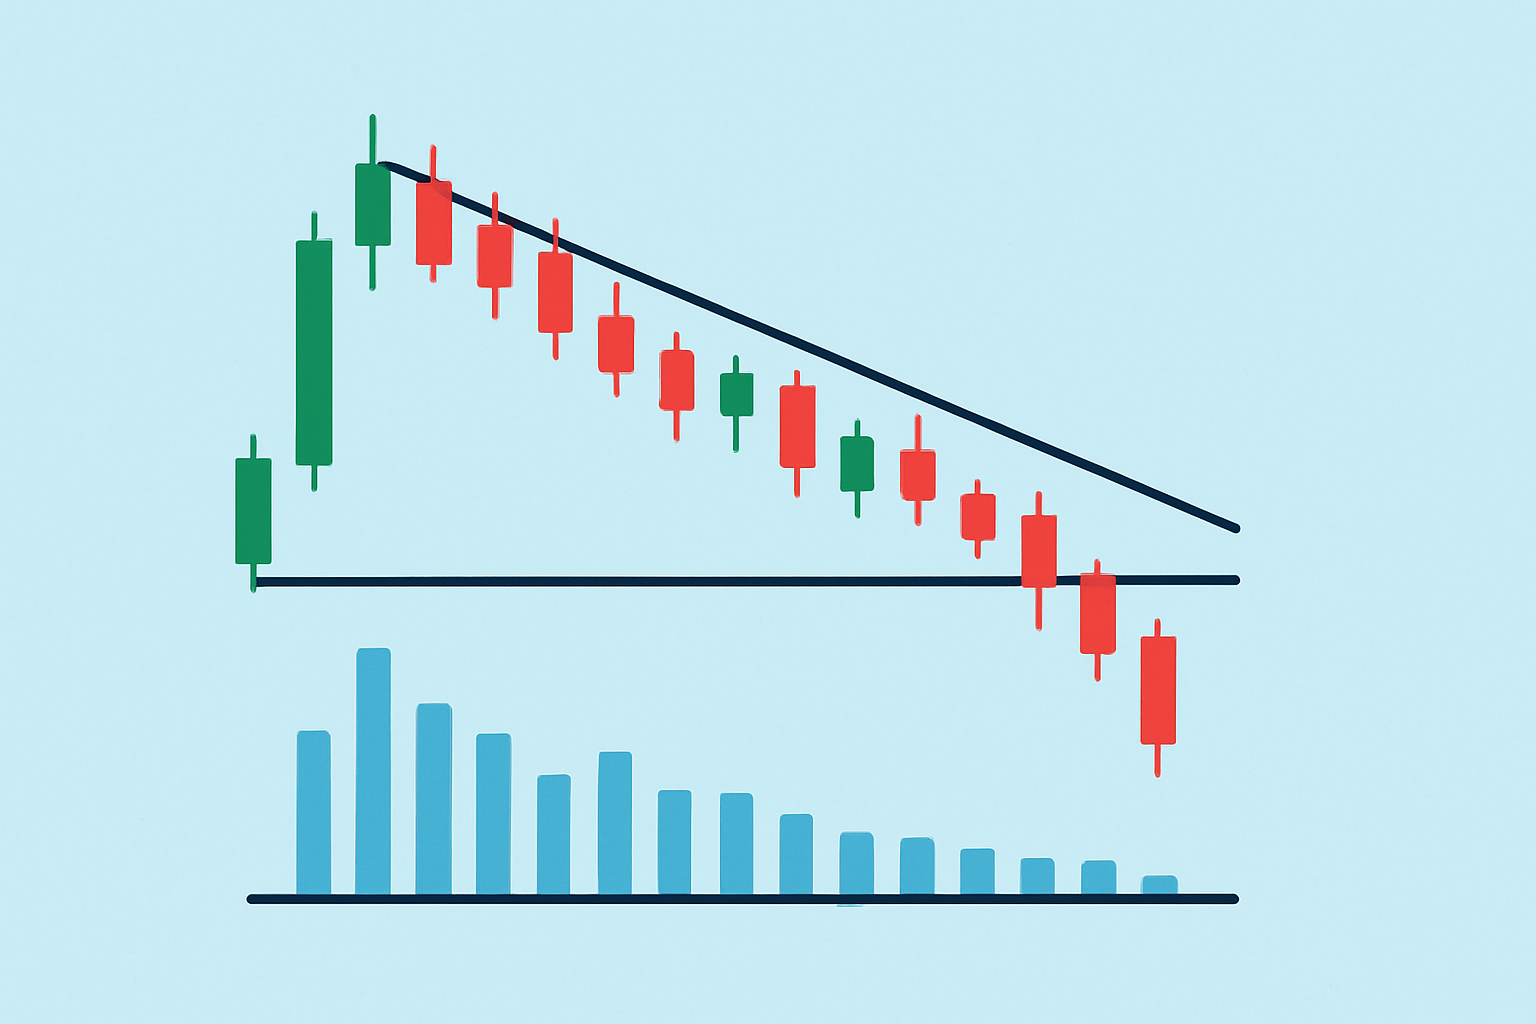
A descending triangle pattern is generally viewed as a bearish chart formation characterized by a flat or nearly horizontal support line below and a resistance line that slopes downward. You will often notice prices making lower highs while they keep bouncing off the same support level and gradually sketching out a triangle on the chart.
Spotting a descending triangle is all about tuning in closely to how prices move over specific timeframes. Traders keep their eyes peeled for those telltale signs and volume shifts that hint the pattern is really taking shape.
Spot a clear horizontal support line where the price seems to consistently find its footing, like a reliable safety net.
Keep an eye out for at least two lower highs that form a descending resistance trendline—think of it as the market tapping the brakes gently, but noticeably.
Check that trading volume usually tapers off as the pattern unfolds, which often hints at a sort of market contraction brewing beneath the surface.
Make sure the pattern holds steady over several sessions or periods to really confirm it before pulling the trigger on any decision.
A price chart depicting a descending triangle pattern with clear horizontal support, descending resistance, and volume contraction.
Descending triangles paint a picture of a tug-of-war where sellers keep ramping up pressure by pushing to lower highs while buyers stubbornly hold their ground at a steady support level.
The descending triangle pattern hints that sellers are slowly gaining the upper hand, nudging prices into a tight little corner, while buyers hold their ground stubbornly. More often than not, this tug-of-war ends with a bearish breakdown once the scales tip decisively.
Many traders tend to fall into the trap of thinking a descending triangle is a sure sign of a price drop, or that it plays out the same way on every timeframe.
Trading descending triangles often calls for a bit of patience and really careful timing. A smart approach usually means waiting for a clear breakout confirmation, then using stop-loss orders to keep risk in check.
Hold off until the price noticeably dips below the horizontal support line, ideally with a strong increase in trading volume to support it.
Watch for sudden spikes in volume because they help show whether the breakout is genuine rather than a short-lived dip that will fade away.
Place your stop-loss orders just above the most recent lower high as a safety net against unexpected reversals.
Determine your price target by measuring the widest gap of the triangle and then projecting that distance downward from where the breakout occurs. This simple method has helped me many times.
Managing risk is absolutely key when trading descending triangles. I’ve found that combining pattern analysis with trusty tools like moving averages or RSI and keeping a keen eye on overall market conditions usually improves your accuracy.
It's fascinating to see how the descending triangle pattern pops up across different markets, almost like a universal language among traders. Whether you are diving into stocks, forex, or even crypto, spotting this pattern can feel like catching a familiar face in a crowd—comforting and insightful. While the underlying principle remains the same, each market adds its own little quirks to the dance, making it all the more engaging to master.
The descending triangle pattern pops up all over the place in stocks, forex, cryptocurrency and commodities alike.
| Market Type | How it Appears | Typical Timeframe | Example Instrument | Trading Notes |
|---|---|---|---|---|
| Stocks | Price charts often reveal a clear downward resistance line coupled with flat support levels, almost like a stubborn ceiling and a firm floor holding their ground | Days to weeks | Apple (AAPL) | Keep an eye out for volume spikes—they’re usually the best little helpers to confirm breakouts |
| Forex | Prices tend to oscillate and squeeze neatly into a triangle shape with steady support that refuses to budge | Hours to days | EUR/USD | Pay attention to economic news; it can be a trusty filter to separate the wheat from the chaff in signals |
| Cryptocurrency | Sharp lower highs form while a horizontal floor stands strong, holding support zones like a bouncer at a club | Minutes to days | Bitcoin (BTC) | Brace yourself for high volatility—prices can jump like a cat on a hot tin roof at any moment |
| Commodities | Prices create descending highs paired with consistent demand support during trends, almost like a slow dance between supply and demand | Days to weeks | Gold (XAU/USD) | Best used alongside seasonal trends and fundamental data to avoid flying blind |
While the descending triangle pattern can definitely be a helpful tool, it’s far from foolproof. Traders often run into false breakouts or fuzzy formations that leave them scratching their heads.
Picture this: you’re watching the stock of Company XYZ over several weeks and you start to notice something interesting—a classic descending triangle pattern forming. There’s a clear horizontal support level at $50 where the price keeps bouncing off like it’s got a spring underneath—never really dropping below. Meanwhile, the highs sneak lower from $55 to $53 and finally $51, forming a descending resistance line. Volume tends to shrink as the price stays within this tightening range like everyone’s holding their breath. Then on day 30, the price slips below $50 on a surge of higher volume. That’s your cue to jump in with a short trade and place a stop-loss just above $51—the last stubborn peak. Since the triangle’s height is $5, you’re aiming for a profit target near $45, playing it smart. Throughout the trade you keep a close watch on indicators like the RSI for any hints the stock might be oversold in case you need to tweak your exit plan.

Tired of missing opportunities and making suboptimal trading decisions? TrendSpider's cutting-edge platform automates complex technical analysis, saving you time and reducing human error.
With multi-timeframe analysis, dynamic alerts, backtesting, and customizable charting, you'll gain a competitive edge in identifying trends and making informed trades across global markets.

14 posts written
Unlock the power of the bear flag pattern with our practical, step-by-step guide. Understand market...

Discover the doji candlestick—a powerful price action signal revealing market indecision. This begin...

Unlock the power of candle patterns to decode market psychology and improve your trading precision....

Discover what IOUs mean in finance, their role as informal debt acknowledgments, and how understandi...