


Technical Analysis
What the Doji Candlestick Means in Price Action
Discover the doji candlestick—a powerful price action signal revealing market indecision. This begin...

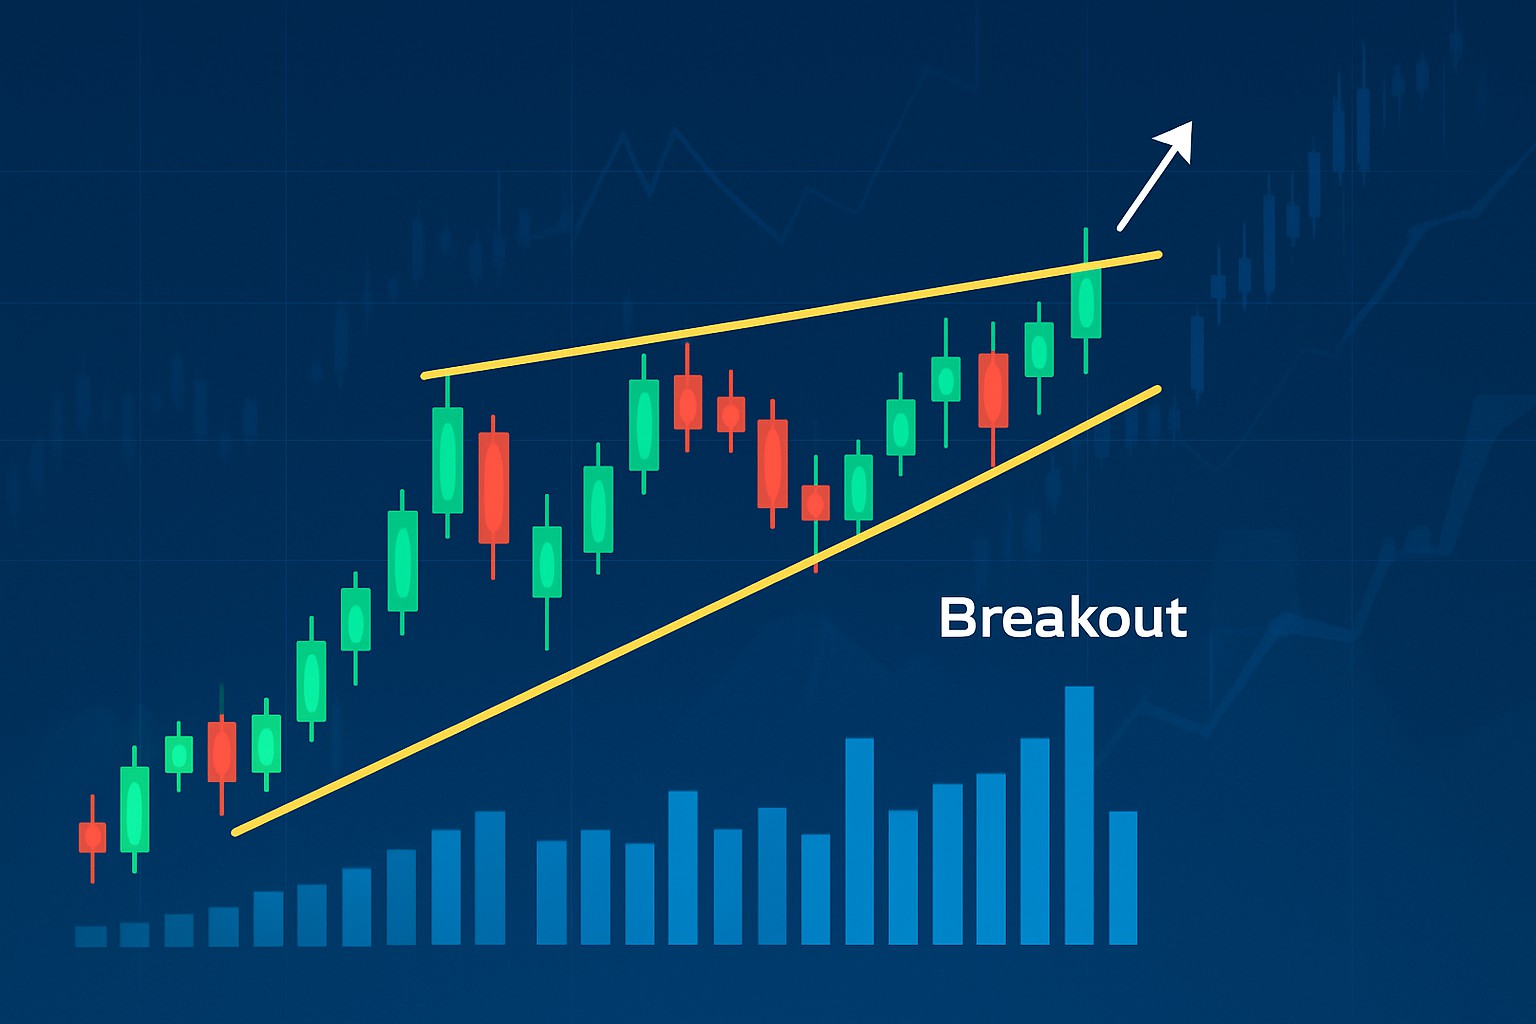
The ascending triangle pattern is a familiar sight in stock technical analysis and usually signals a potential bullish continuation in price movement. We’ll dive into what exactly the ascending triangle pattern is and how to spot it on your charts without breaking a sweat.
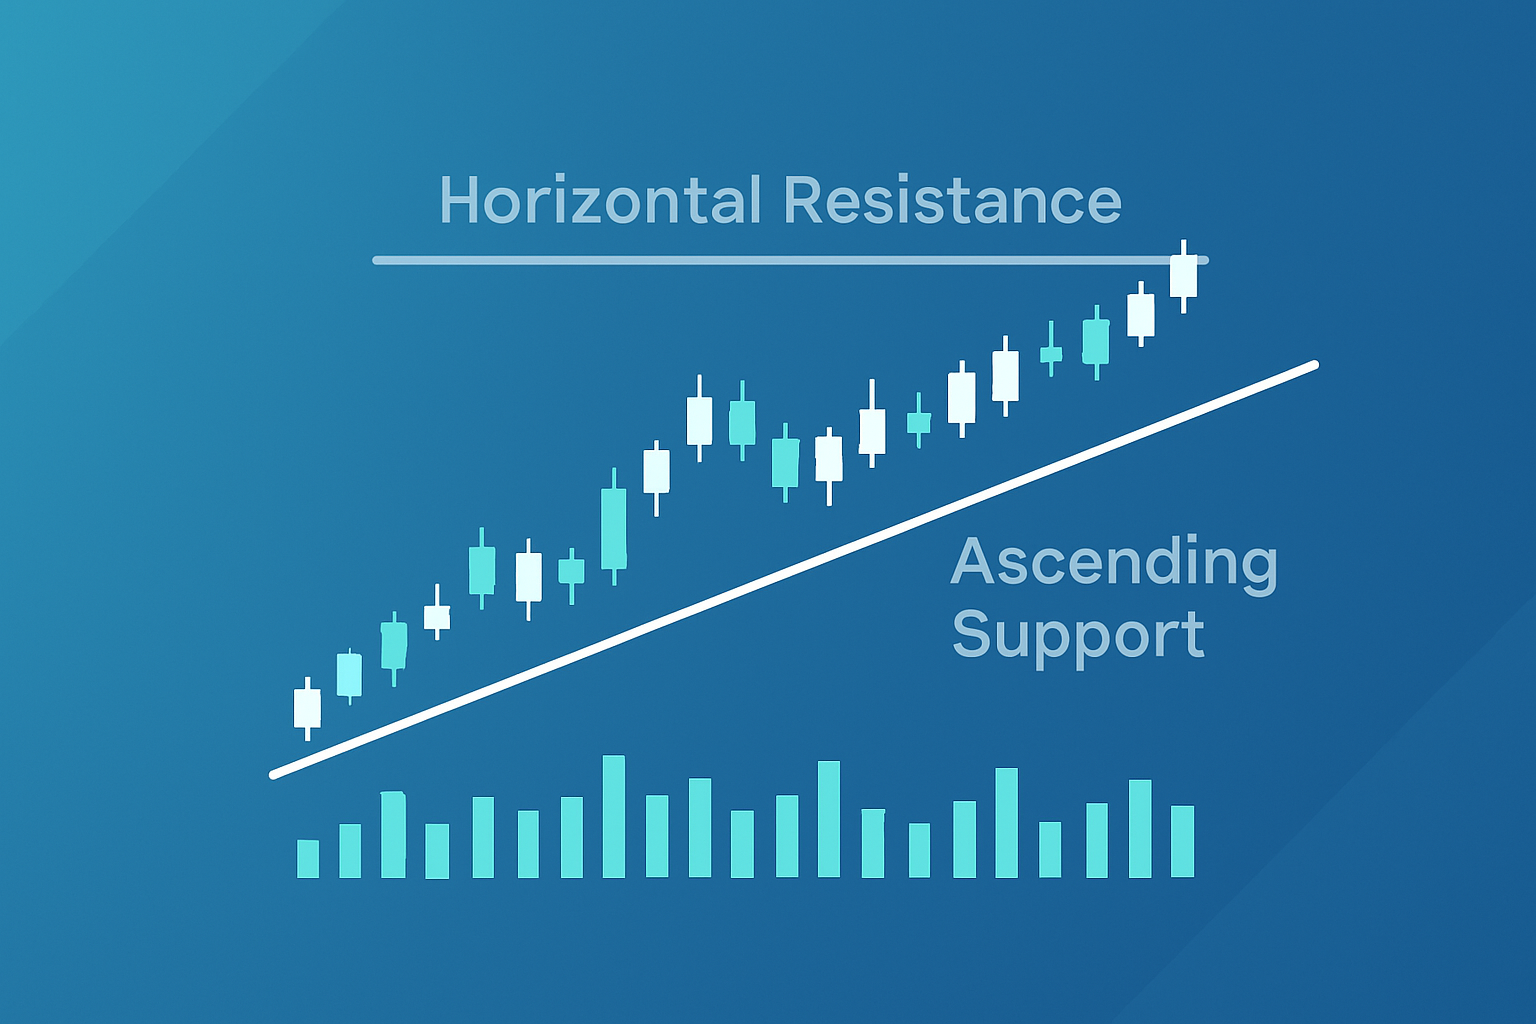
An ascending triangle pattern paints a pretty bullish picture with a flat horizontal resistance line at the top and a rising support line from below. This setup tells a story of mounting buying pressure as buyers slowly inch prices higher while wrestling with that steady resistance.
Spotting this pattern can really give traders a sharper sense of the market’s mood and a better guess at when bullish momentum might start revving up.
Spotting an ascending triangle takes a keen eye for how prices shift over time, and the knack for teasing out clear visual clues. Traders often zero in on trendlines and volume patterns to confirm just how strong the pattern really is
Spot a clear horizontal resistance level where the price just can’t seem to close above, no matter how many times it tries.
Pin down an ascending trendline by connecting those higher lows that slowly but surely push the support line upward.
Keep an eye on the volume patterns as the pattern takes shape, signaling a bit of consolidation before the next move.
Wait for a candle to close cleanly above the horizontal resistance to really confirm the breakout.
Then watch for a nice volume spike that seals the deal, showing strong buyer interest and plenty of momentum behind the move.
Example of an ascending triangle pattern on a stock chart, highlighting the flat resistance line and rising support line.
Beginners often get their wires crossed between ascending triangles and other triangle patterns, or they’re a bit too quick to call a breakout before it’s really there. It’s vital to steer clear of falling for false breakouts, which can be sneaky.
The ascending triangle pattern is a tug-of-war between buyers and sellers but over time the bulls start to gain the upper hand. Sellers keep a firm resistance level yet buyers grow more confident and step in earlier each time the price dips to form higher lows. This steady build-up of buying pressure creates quiet tension that slowly gathers steam for a breakout above resistance.
The ascending triangle paints a picture of a market slowly leaning bullish, where a steady wall of resistance meets steadily climbing buying pressure. It’s one of those classic setups that more often than not ends with a breakout pushing upward—kind of like a simmering pot finally boiling over.
Once traders catch sight of an ascending triangle they tend to roll up their sleeves and follow some go-to strategies to enter, manage and exit their trades thoughtfully. Typically this means patiently waiting for that unmistakable breakout signal, placing stop-loss orders just beneath the rising support like a cautious safety net and then setting profit targets that line up neatly with the pattern’s height.
Keep an eye out for a breakout candle that closes convincingly above the horizontal resistance line. It’s your green light that the pattern is playing out as hoped.
Jump into a long trade right after that breakout candle seals the deal because it’s a strong sign that buyers have firmly grabbed the reins.
Place a stop-loss order just below the ascending support line to keep any nasty surprises in check and protect your downside.
Figure your profit target by measuring the triangle’s vertical height then project that distance upward from the breakout point. This simple method is effective.
Tweak your position size to fit your own comfort zone with risk. Make sure your money management game is tight enough to keep you trading day in, day out.
Not every breakout leads to a lasting rally. False breakouts can sneak up and knock out stop losses before you know it. To protect their capital traders usually keep a hawk's eye on volume since low volume during a breakout often rings alarm bells for weak conviction.
The classic ascending triangle is straightforward to spot but real-world charts rarely play by the book. They often show imperfect shapes due to market noise or long consolidation phases. Volume doesn’t always drop off in a neat pattern and sometimes the shape blurs into other formations, making things murky.
Getting good at spotting the ascending triangle pattern takes a bit of practice and a fair share of patience. I’ve noticed that beginners usually find it really handy to dive into charting software to sift through past examples, give paper trading a whirl to practice entries without betting real cash.

Struggling to improve your trading performance? Edgewonk's advanced analytics tools are designed to give you the edge you need.
With detailed trade journaling, robust strategy analysis, and psychological insights, you'll gain a comprehensive understanding of your strengths and weaknesses. Don't miss out on this game-changing opportunity.

23 posts written
Discover the doji candlestick—a powerful price action signal revealing market indecision. This begin...
Master the falling wedge pattern with this comprehensive guide offering clear steps to identify, con...
Discover how the double top pattern signals potential trend reversals in trading. Learn to identify,...
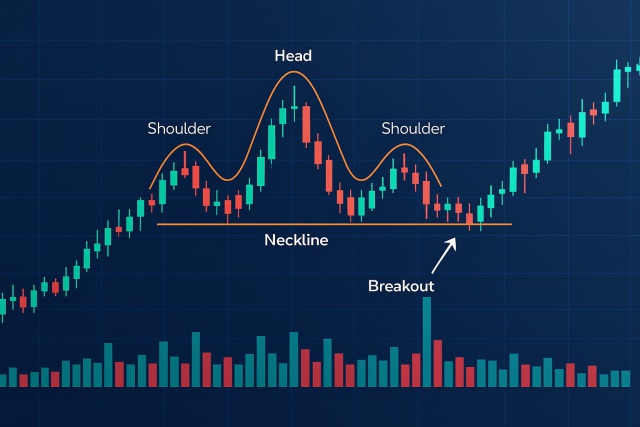
Discover how to confidently spot the head and shoulders chart pattern—a key indicator for trend reve...