


Technical Analysis
Profiting from Head and Shoulders Patterns in Any Market
Unlock the power of the head and shoulders pattern with this complete guide. Learn to spot, trade, a...

This article walks you through how traders often lean on the triple bottom pattern to pinpoint potential bullish reversals in the market.
Price patterns hold a special place for traders, often acting like little road signs that hint at what the market might do next. Take the triple bottom pattern for example—it’s a classic clue that a downtrend might finally be waving goodbye.
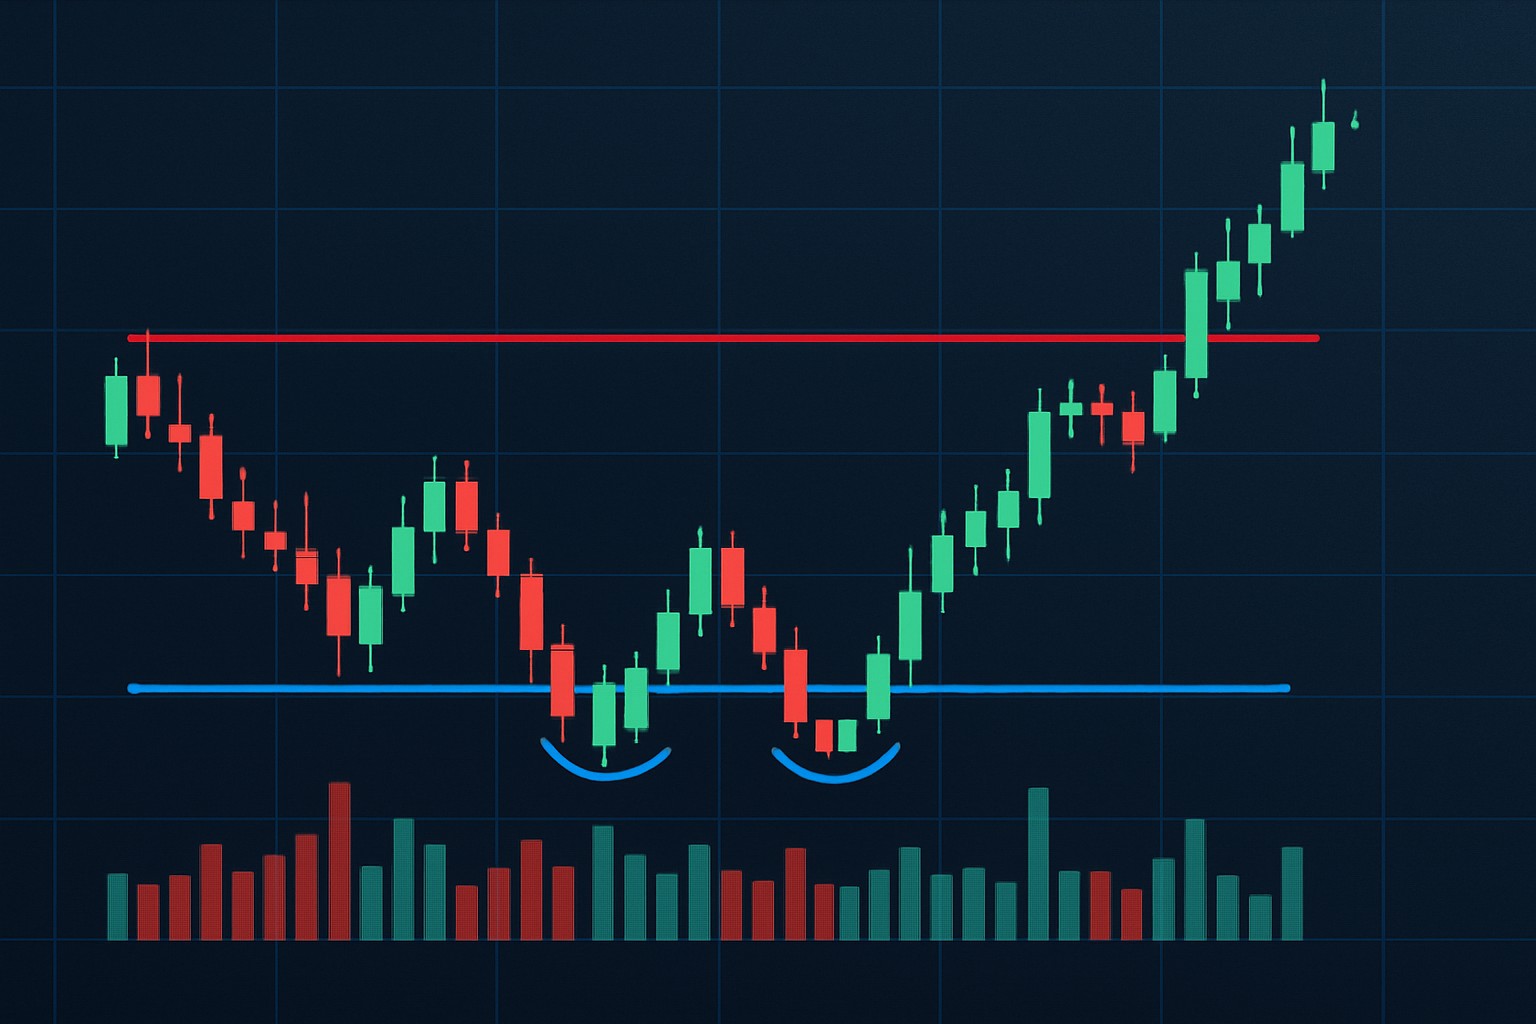
A triple bottom pattern pops up on price charts when an asset’s price dips down to roughly the same low point three separate times, with some modest rebounds in between. Picture a stretched-out 'W' sprawled across the timeframe—this shape really shines a spotlight on strong support at those lows.

Visual example of a triple bottom pattern on a price chart illustrating the three lows and resistance levels.
Picture a rubber ball dropped to the floor and bouncing three times before it finally gathers enough bounce to rise steadily. The triple bottom works the same way with the price tapping the floor three times, giving a clear nod that the support is solid before it starts inching upward.
Repeated lows clustering around the same price point often hint at solid demand that props up the price from dropping further. It’s a classic sign that buyers are gaining confidence while sellers start to lose their grip. This shifts the mood and usually sets the stage for a bullish bounce.
The price takes a little tumble at first, hitting that initial low where selling pressure really seems to be putting up a fight.
Then it perks up as buyers step onto the scene, sparking a short-lived rally that feels like a breath of fresh air.
The price dips once more, poking the support level again and carving out a second low like it’s feeling its way in the dark.
Another bounce follows, a clear sign that the support line isn’t ready to give up just yet.
The price returns a third time to double-check the bottom, sealing the deal with a confirmed triple low.
Finally, a breakout above the resistance formed by those earlier peaks hints that the bulls might be ready to take the reins.
After the third low traders tend to keep a keen eye out for a breakout above the resistance level especially when it’s backed by a noticeable uptick in volume.
"When you see volume really pick up during the breakout stage, it is often a strong hint that the triple bottom pattern is more than just a little hiccup or a mild market breather—it’s a bona fide bullish reversal." - Market Analyst
Identifying a triple bottom calls for a good deal of patience and a careful eye on timeframes that reveal meaningful price movement.
Technical tools like volume analysis often help confirm buying momentum during a breakout. Indicators such as RSI divergence usually give a subtle nudge when downtrends start to lose their punch. Moving averages offer extra context for support and make the whole pattern feel more trustworthy.
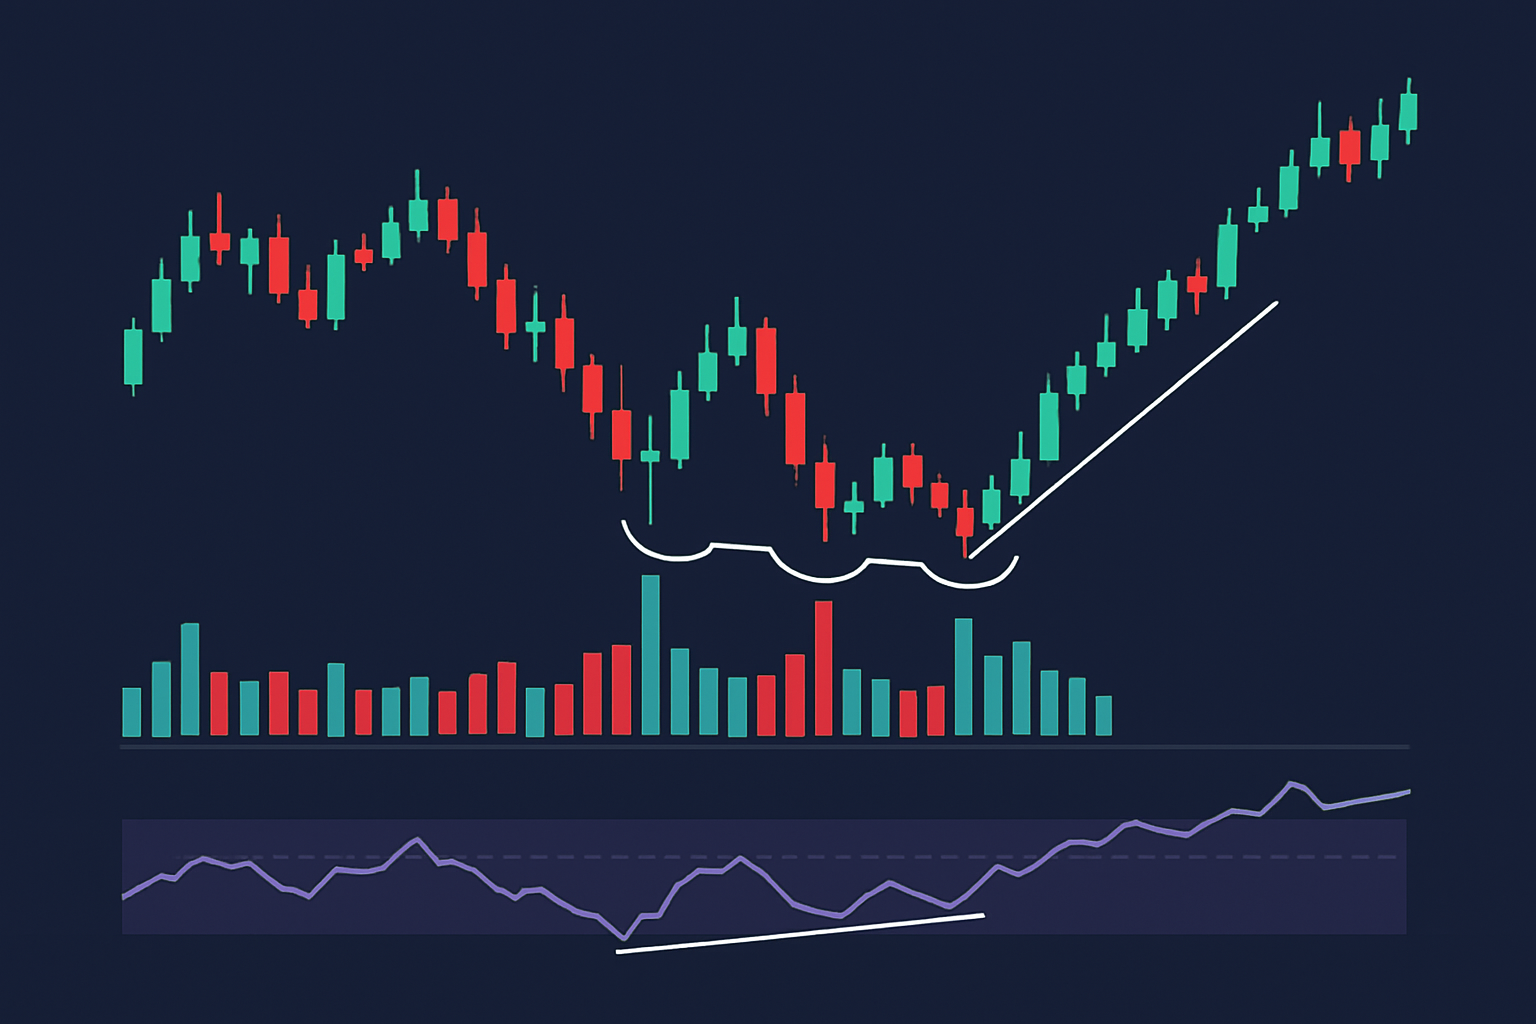
An example of triple bottom pattern confirmed by volume spikes and supporting technical indicators like RSI divergence.
Many traders tend to jump to the conclusion that a triple bottom will spark a swift and powerful bounce.
Misreading this pattern tends to send traders off on early trades or leads to spot-on wrong calls on setups.
Imagine a stock slipping down over a few weeks and hitting a price floor near $45 not once but three separate times. Each time is followed by a quick bounce. Then at the moment it taps that level for the third time, the price breaks through the $50 resistance on a surge of volume.
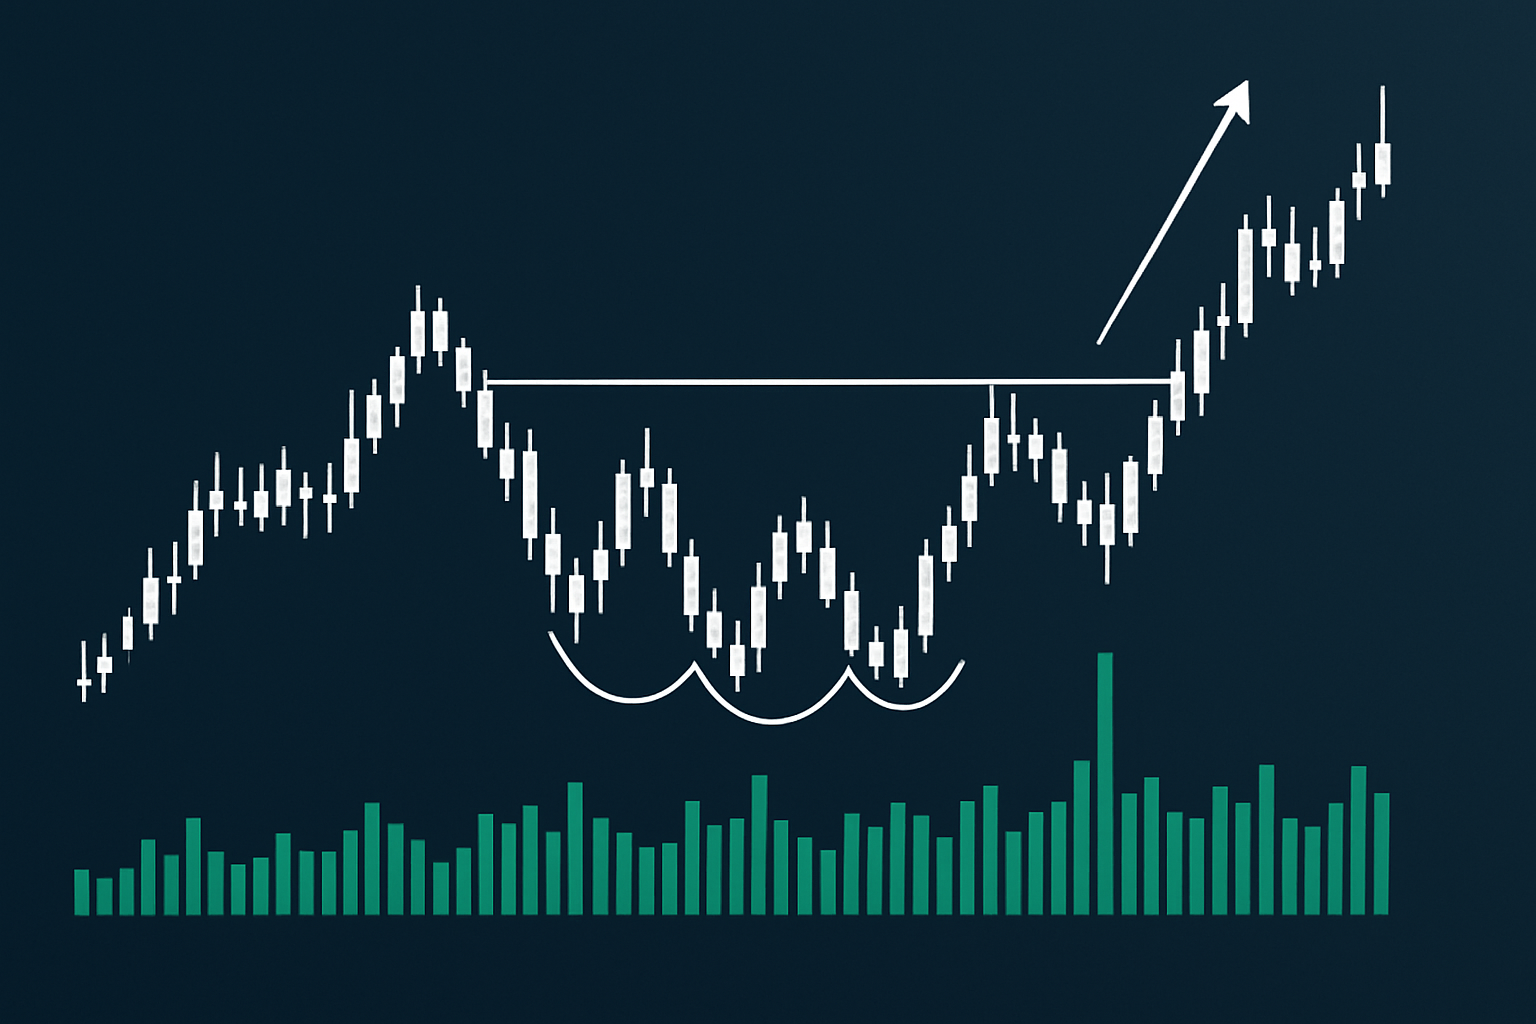
Case study chart illustrating a triple bottom pattern leading to a confirmed bullish breakout with supporting volume data.
Keep an eye out for those three lows clustering around the $45 mark—that's your cue the support might be holding strong.
Notice the volume gradually picking up steam during the rallies that pop up between those lows, which is always a promising sign.
Real confirmation comes when the price breaks past the $50 resistance, backed by a noticeable jump in volume—kind of like the crowd cheering louder just as the star player enters the game.
After that, you can estimate a price target by measuring the pattern's height above that resistance level—think of it as giving yourself a roadmap for what’s next.
Lastly, don’t forget to play it safe: set your stop-loss orders just below the support level to manage risk—better to be cautious than caught off guard.
This example nicely illustrates how mixing pattern recognition with volume and risk controls often gives a real boost to both confidence and trading results.
Triple bottoms can be a bit of a slippery customer. But fear not with a little know-how and patience, they can become your trusted sidekick in the trading world. Let’s dive into some best practices and tips that might just save you from a few head-scratching moments along the way.
Sticking to these best practices can really help traders boost the reliability of those triple bottom pattern signals.

Tired of missing opportunities and making suboptimal trading decisions? TrendSpider's cutting-edge platform automates complex technical analysis, saving you time and reducing human error.
With multi-timeframe analysis, dynamic alerts, backtesting, and customizable charting, you'll gain a competitive edge in identifying trends and making informed trades across global markets.

23 posts written
Unlock the power of the head and shoulders pattern with this complete guide. Learn to spot, trade, a...

Discover what IOUs mean in finance, their role as informal debt acknowledgments, and how understandi...

Discover the bullish harami candlestick pattern—a key technical signal that can hint at trend revers...

Unlock the power of the bear flag pattern with our practical, step-by-step guide. Understand market...