


Technical Analysis
What the Doji Candlestick Means in Price Action
Discover the doji candlestick—a powerful price action signal revealing market indecision. This begin...

Bearish pennant patterns hold a pretty important spot in technical analysis, signaling a likely continuation of the downward price momentum. Traders often lean on this pattern to catch those brief pauses in falling prices before the sell-off picks up steam again.
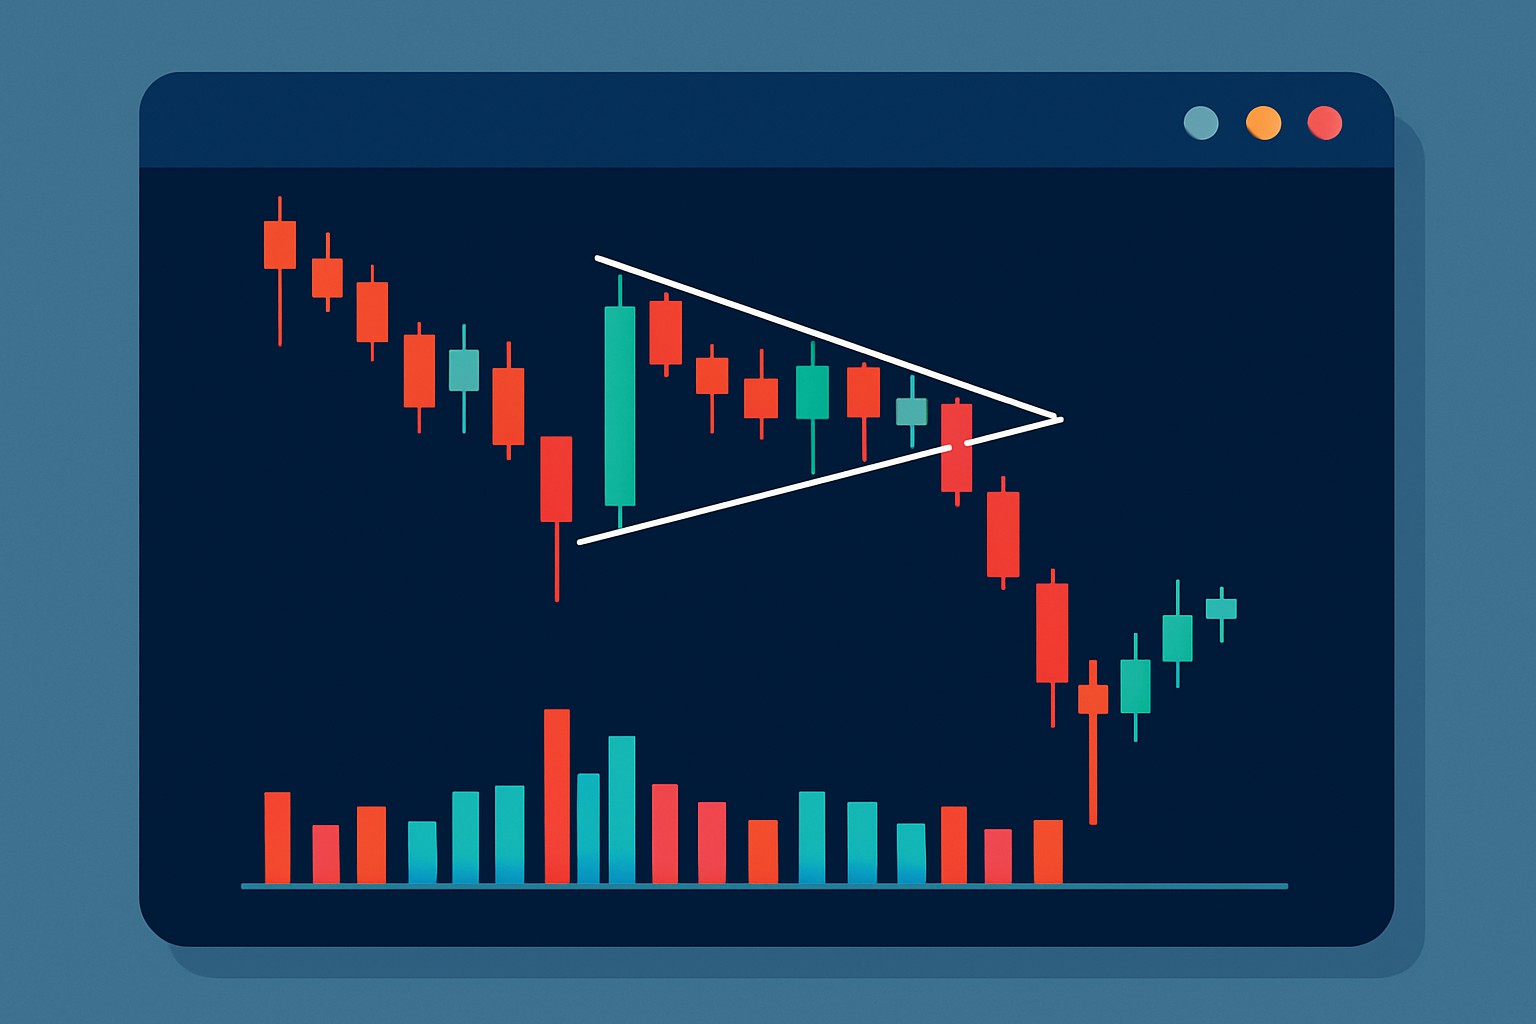
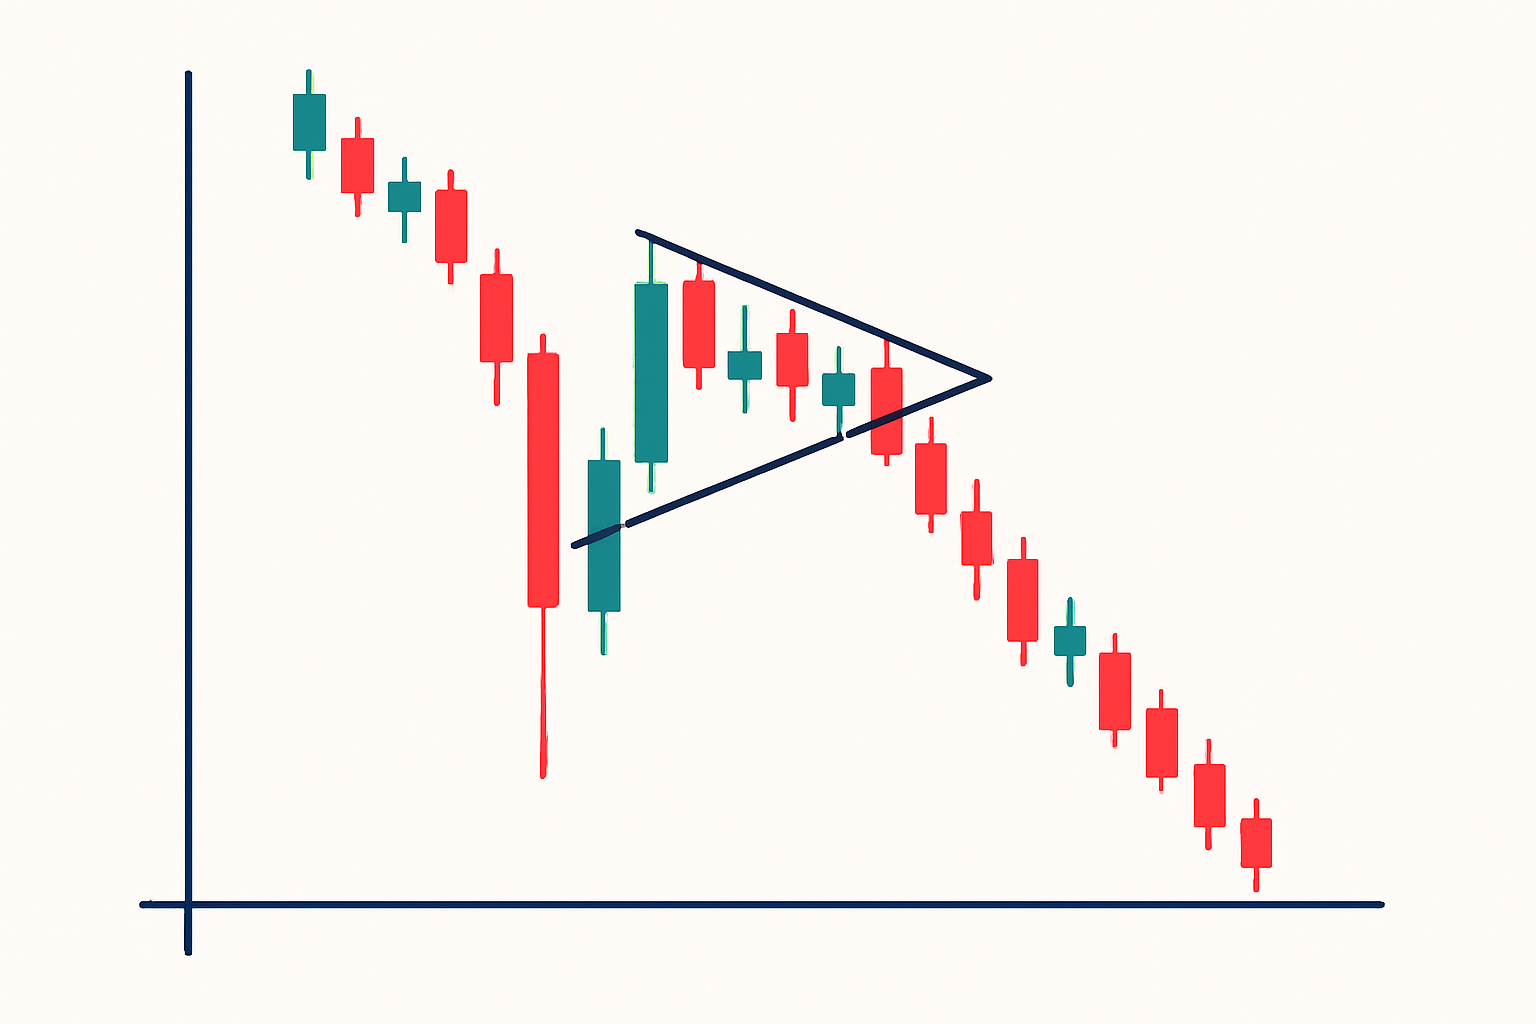
A bearish pennant often shows up as a short-term continuation pattern right after a sharp price drop called the flagpole. Once that initial tumble happens, you usually see the price drifting sideways trapped between converging trendlines forming a small symmetrical triangle known as the pennant.
Example of a bearish pennant pattern on a stock price chart highlighting the flagpole, pennant consolidation, and subsequent breakout to the downside.
Recognizing a bearish pennant pattern means paying close attention to price movements in three key stages. First, there is a sharp drop called the flagpole—think of it as the dramatic opening act. Then the price takes a breather and settles into a consolidation phase where converging trendlines form the classic pennant shape. Finally, the curtain falls as the price breaks below support, usually signaling that the downtrend will continue.
Make sure the market has taken a sharp, quick nosedive to set up that all-important flagpole.
Spot two trendlines that converge nicely during the consolidation phase, forming a neat symmetrical triangular pennant.
Keep an eye out as trading volume usually tapers off steadily throughout this consolidation because this detail really helps confirm you’re on the right track.
Watch carefully for a breakout below the pennant's lower trendline. That’s your green light that the continuation is playing out.
Take the length of the flagpole and project it downward from the breakout point to get a good estimate of how far the price might fall, almost like measuring your jump before you leap.
Volume often plays a starring role when confirming the bearish pennant pattern. During the consolidation phase, you usually notice volume tapering off—a calm before the storm—as buyers and sellers hit the pause button unsure of the next move. Then when the price finally breaks down, volume tends to surge, backing up the move's muscle and hinting that traders are throwing their lot in with the bearish trend.
Bearish pennants often hand traders some pretty handy clues about where the market could be headed next. These patterns usually hint that the downtrend is just taking a quick breather before continuing, which is a lifesaver when deciding the right moment to jump into short positions or to exit long ones. Nailing this formation can really fine-tune your timing and risk control
The bearish pennant often feels like that brief, calm pause in the market that tends to catch traders off guard just before prices take another dive. It’s sort of like the eye of the storm—a quiet moment that whispers a vital hint for those ready to make their next strategic move.
Bearish pennants are usually pretty solid signals, but many traders end up mixing them up with neutral symmetrical triangles or simply overlook key details like volume and the prior trend. These little slip-ups can easily lead to false alarms or trades that jump the gun. To spot the pattern right, the pennant should unmistakably show up after a sharp downtrend and be backed up by volume that confirms the breakout
Including bearish pennants in your trading playbook means setting crystal-clear rules for when to jump in and where to place your stop-loss as well as how to map out your profit targets. Traders often lean on the flagpole’s length as a yardstick to estimate how far the price might drop after breaking out. They place stops just a hair above the pennant’s upper edge to keep potential losses in check.
Make sure you have got the bearish pennant pattern nailed down—check that it is riding a clear downtrend and the volume shifts are playing along nicely.
Jump into a short position only after the price convincingly dips below the pennant's lower trendline—no half-measures here.
Place your stop-loss just above the pennant's upper trendline to keep those pesky false breakouts from sneaking in and spoiling the party.
Figure out the profit target by measuring the flagpole's height and then project that distance downward starting from the breakout point—think of it like setting your sights before taking the shot.
Stay sharp and monitor volume and price action closely for any hints of reversal or if momentum starts to fizzle, and be ready to tweak your game plan on the fly.
| Parameter | Description |
|---|---|
| Entry Point | The price level where the breakout slips below the pennant’s lower trendline, signaling the move |
| Stop-Loss Location | Set just above the pennant’s upper trendline to keep potential losses in check—think of it as your safety net |
| Profit Target | Found by measuring the flagpole’s height and projecting that same distance downward; it’s like aiming for a target that makes sense |
| Volume Confirmation | Typically, volume takes a breather during the pennant’s formation, then surges right at breakout, giving that all-important nod that the move’s legit |
| Risk-Reward Considerations | Carefully balancing your stop-loss and profit target to maintain a healthy risk-to-reward ratio—because nobody likes lopsided bets |
Checking out real-world examples of bearish pennant trades really helps traders get a feel for how the pattern plays out in live markets and pick up on those subtle little details you might otherwise miss.
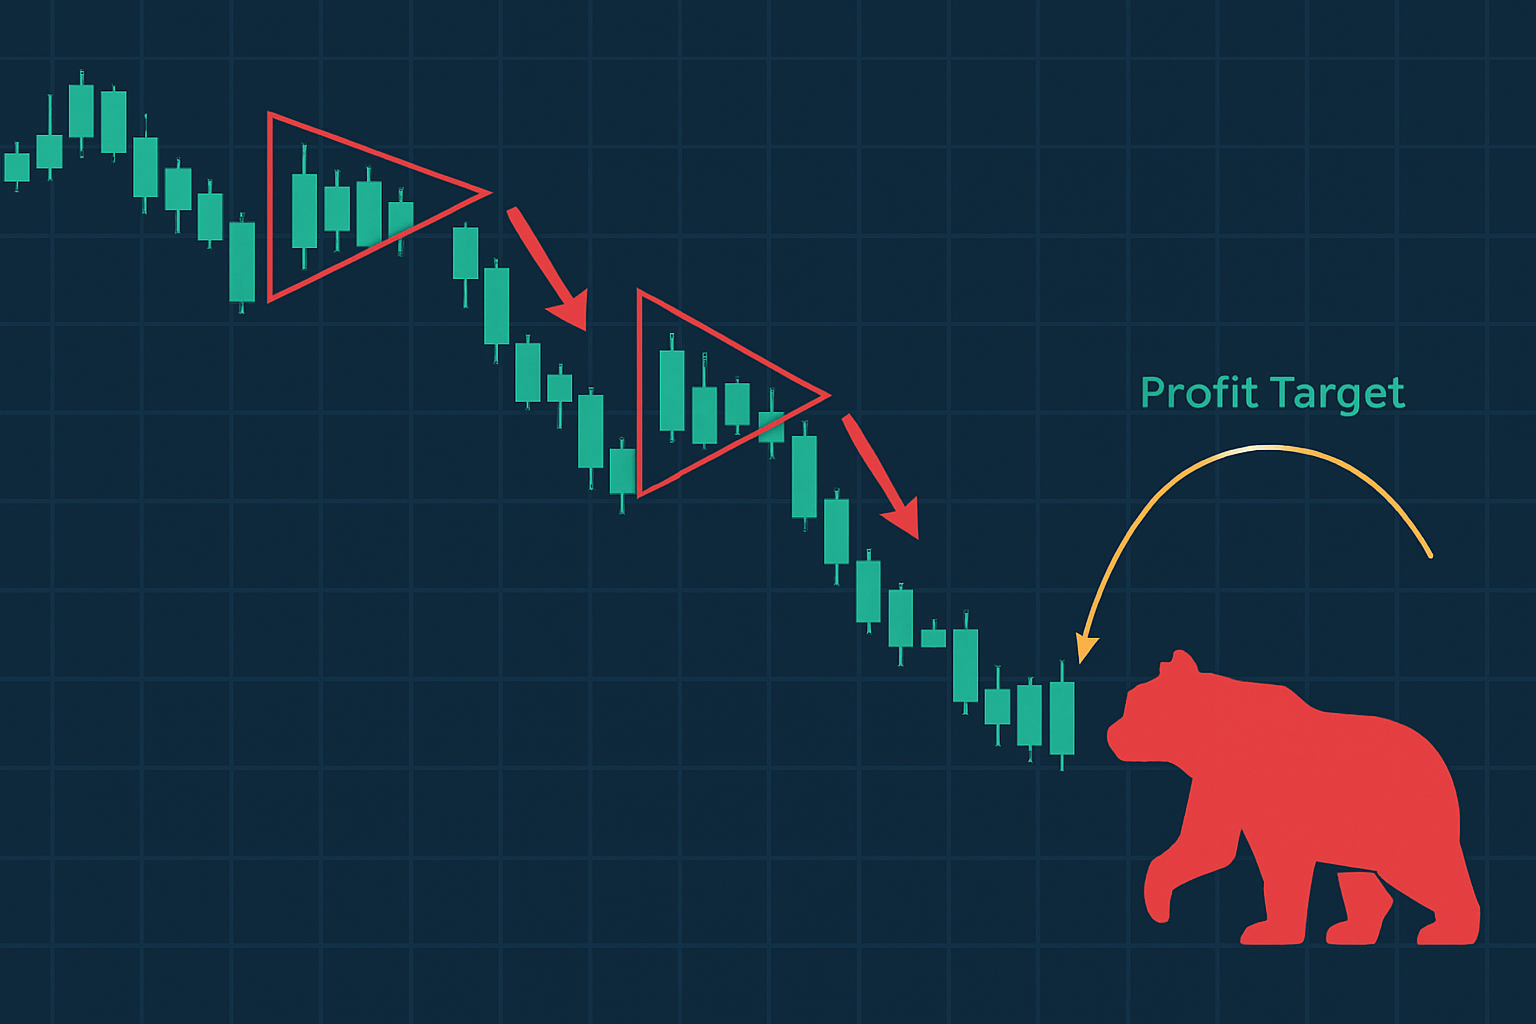
An illustrative chart showing multiple bearish pennant instances, breakout points, and achieved profit targets to demonstrate practical trading outcomes.
Bearish pennants can be pretty handy as technical indicators, though they’re far from a crystal ball. In markets that are bouncing all over the place or reacting to the latest headlines, it’s not uncommon to see false breakouts and swift reversals that can really throw you off. Traders usually get the best results when they don’t rely on pennants alone but rather mix in other tools—think momentum oscillators and a solid read on the bigger trend—to help dodge those pesky misleading signals.

Tired of missing opportunities and making suboptimal trading decisions? TrendSpider's cutting-edge platform automates complex technical analysis, saving you time and reducing human error.
With multi-timeframe analysis, dynamic alerts, backtesting, and customizable charting, you'll gain a competitive edge in identifying trends and making informed trades across global markets.

23 posts written
Discover the doji candlestick—a powerful price action signal revealing market indecision. This begin...

Master the hammer candlestick pattern—a key indicator for market reversals. This beginner-friendly g...

Unlock the power of candle patterns to decode market psychology and improve your trading precision....

Learn how the harami candlestick pattern signals potential market reversals. This guide breaks down...