How to Spot a Hammer Candlestick in Trading Charts
Master the hammer candlestick pattern—a key indicator for market reversals. This beginner-friendly g...

Candlestick charts are a staple in the world of technical analysis, offering traders a neat visual snapshot of price movements through different types of candlesticks over specific trading periods.
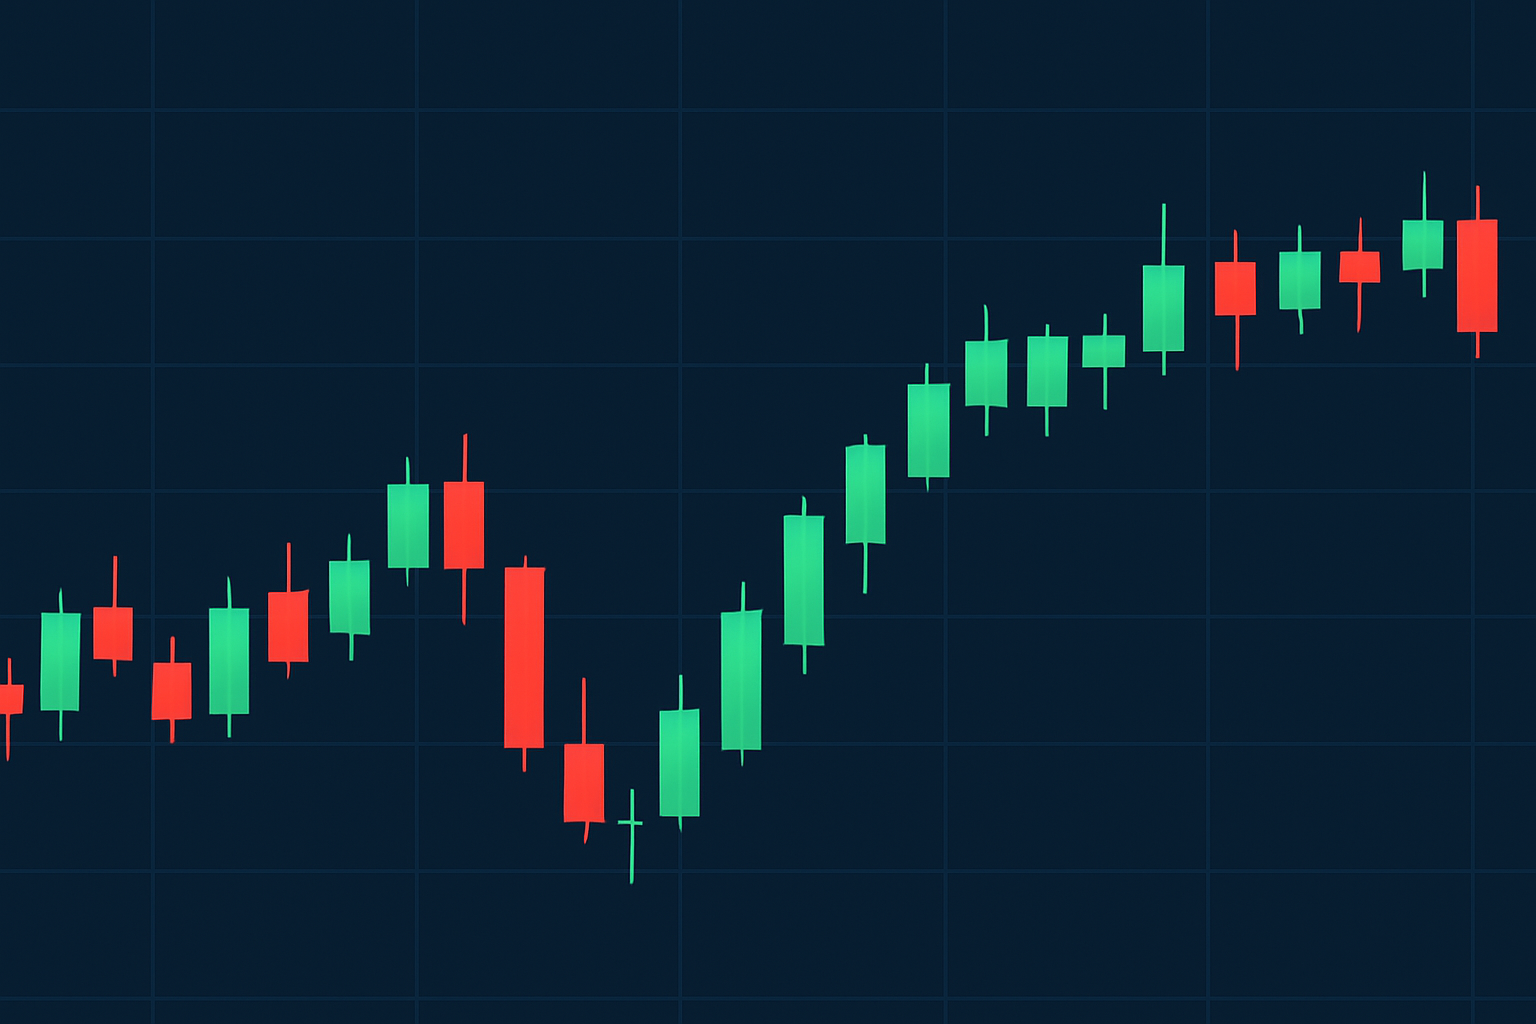
A candlestick has a few key parts that are straightforward once you get the hang of it. The body represents the opening and closing prices while the wicks reveal the high and low prices during that timeframe. Bullish candles usually show up as green or white and give a nudge that prices are moving up. On the flip side, bearish candles are often red or black and let you know the market is leaning downward.
These elements reveal a lot about trader sentiment. Long bodies typically signal strong buying or selling pressure, like the market shouting its intentions loud and clear. On the flip side, long wicks often hint at rejection of certain price levels or a burst of volatility. It is as if the market is having second thoughts.
Certain candlestick shapes pop up quite regularly and often sneak in some pretty important hints about market momentum or those moments when uncertainty is in the air.
| Pattern Name | Visual Description | Indication | Typical Interpretation |
|---|---|---|---|
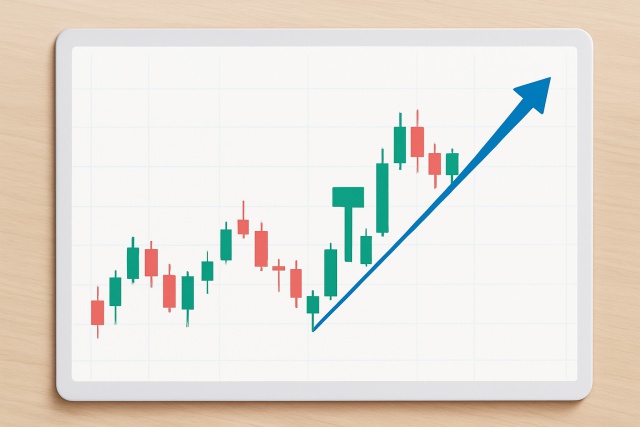
| Hammer | Small body, long lower wick, short upper wick | Bullish | Often points to a bullish reversal after a downtrend, giving hope to the cautious bulls |
| Hanging Man | Small body, long lower wick, short upper wick | Bearish | Can signal a bearish reversal following an uptrend, a bit like a warning flag waving softly |
| Inverted Hammer | Small body, long upper wick, short lower wick | Bullish | Usually suggests a reversal after a downtrend, hinting that buyers might be sneaking back in |
| Shooting Star | Small body, long upper wick, short lower wick | Bearish | Typically marks a bearish reversal after an uptrend, as if the market just got tired of climbing |
| Doji | Very small or no body, equal wicks | Indecision | Reflects market uncertainty—think of it as a moment of hesitation before the next big move |
| Spinning Top | Small body with long upper and lower wicks | Indecision | Shows mixed sentiment and often suggests a trend might be about to take a new direction, keeping traders on their toes |
| Marubozu | Long body, no or minimal wicks | Strong signal | Indicates strong bullish or bearish momentum, leaving little doubt about which side's calling the shots |
Spotting these candles after a long trend can really save you from jumping the gun. Take the hammer for example. When it appears after a downtrend, it is often a sign that things might turn around and start climbing. On the other hand, a shooting star near the peak of an uptrend usually signals a possible pullback. No single candle works on its own. It is very important for traders to also watch the volume and the bigger picture. One candle alone doesn’t guarantee a move but it does offer a glimpse into trader psychology and potential momentum shifts.
Traders often keep an eye on groups of candlesticks forming specific patterns, mainly because these clusters tend to deliver signals that feel a bit more solid and trustworthy than just a lone candle flickering on its own.
Bullish versions of these patterns usually signal that buyers are starting to grab the reins from sellers and often point to either a trend reversal or a strong continuation—kind of like a changing of the guard. On the flip side, bearish patterns hint that buyers might be running low on steam while selling pressure quietly creeps back in. The psychology behind these multi-candle formations unfolds gradually and reveals a market sentiment that’s shifting under the surface. Larger candles tend to show stronger conviction and the whole sequence paints a clear picture of which side is gaining the upper hand.

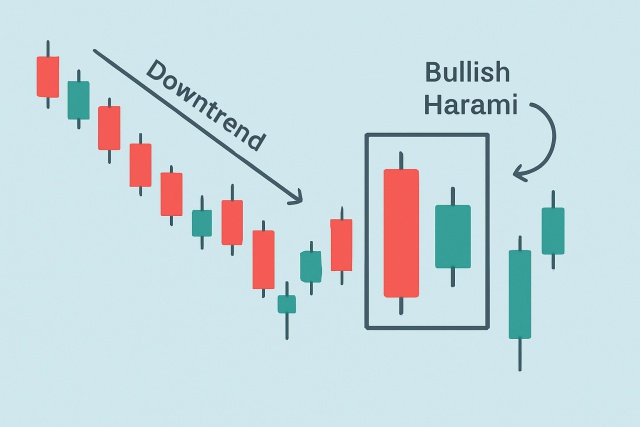
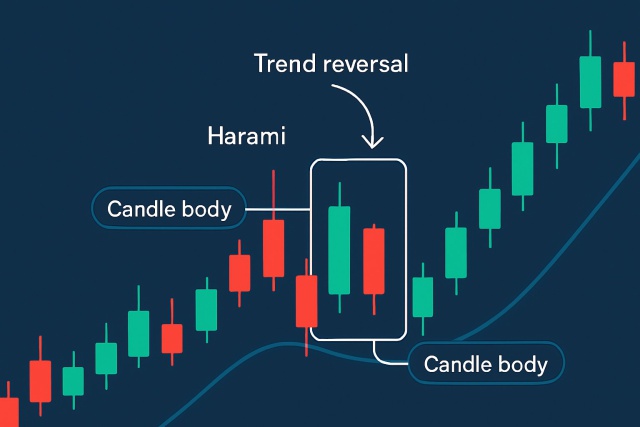
Visual examples of key candlestick patterns showing price movement and signaling potential trend reversals or continuations
Candlestick patterns can offer helpful hints but they are far from a crystal ball for predicting price moves. Successful trading usually means blending candlestick analysis with volume data and double-checking trends while keeping risk management front and center.
Successful traders usually don’t rely on candlestick patterns alone. They combine them with other tools like technical indicators and volume data to better confirm their signals. It’s also wise to use stop-loss orders along with clear entry and exit points based on those signals. This approach helps manage risk and increases the potential for returns.
Kick things off by pinpointing the main market trend—moving averages or trendlines usually do the trick here.
Next, keep an eye out for candlestick patterns that either support this trend or throw a wrench in the works.
Back up these signals with volume indicators or other trusty technical tools.
Then, lock in your entry and exit points. Make sure they’re crystal clear and based on those candlestick clues plus solid support or resistance levels.
Finally, don’t forget to practice good risk management like setting stop-loss orders—your capital will thank you for it down the road.
Imagine a trader spotting one of the key types of candlesticks - a hammer pattern - near a sturdy support level on a Bitcoin chart. This might nudge them to take a long position if the volume shows solid buying interest. On Binance's spot trading platform, executing such trades happens in a flash, making it easier to jump on these signals before they slip away. Meanwhile, alert tools on platforms like TrendSpider come to the rescue by nudging traders with timely notifications about candlestick patterns so they can make vital calls to enter or exit positions right on the dot.
Reading candlesticks is a bit like tuning into the little cues people drop in a chat. Those subtle hints often spill the beans on hidden intentions and give you a leg up on what’s likely coming down the pike.
Are you tired of juggling multiple tools for your trading needs? TradingView is the all-in-one platform that streamlines your analysis and decision-making.
With its powerful charting capabilities, real-time data, and vibrant community, TradingView empowers traders like you to stay ahead of the market. Join thousands who trust TradingView for their trading success.
Are you ready to elevate your trading game? Binance, the leading cryptocurrency exchange, offers a seamless platform for traders of all levels. With its user-friendly interface and powerful tools, you can navigate the dynamic world of digital assets with confidence.
23 posts written
With 15 years of experience in commodity markets, Leila Amiri is transforming the field with her unique perspectives on sustainable investing and ESG integration.
Read Articles
Master the hammer candlestick pattern—a key indicator for market reversals. This beginner-friendly g...

Discover the bullish harami candlestick pattern—a key technical signal that can hint at trend revers...

Discover what IOUs mean in finance, their role as informal debt acknowledgments, and how understandi...

Learn how the harami candlestick pattern signals potential market reversals. This guide breaks down...
