


Technical Analysis
What the Doji Candlestick Means in Price Action
Discover the doji candlestick—a powerful price action signal revealing market indecision. This begin...

The hammer candlestick is a sturdy chart pattern that beginners often find pretty handy to spot. It throws out some valuable clues about potential price reversals lurking in the market.
A hammer candlestick is a distinctive kind of candle you’ll spot on trading charts, marked by a small body and a long lower wick that really stands out. It tends to show up after prices have been tumbling and hints that buyers might be stepping back into the ring, potentially turning the tide.
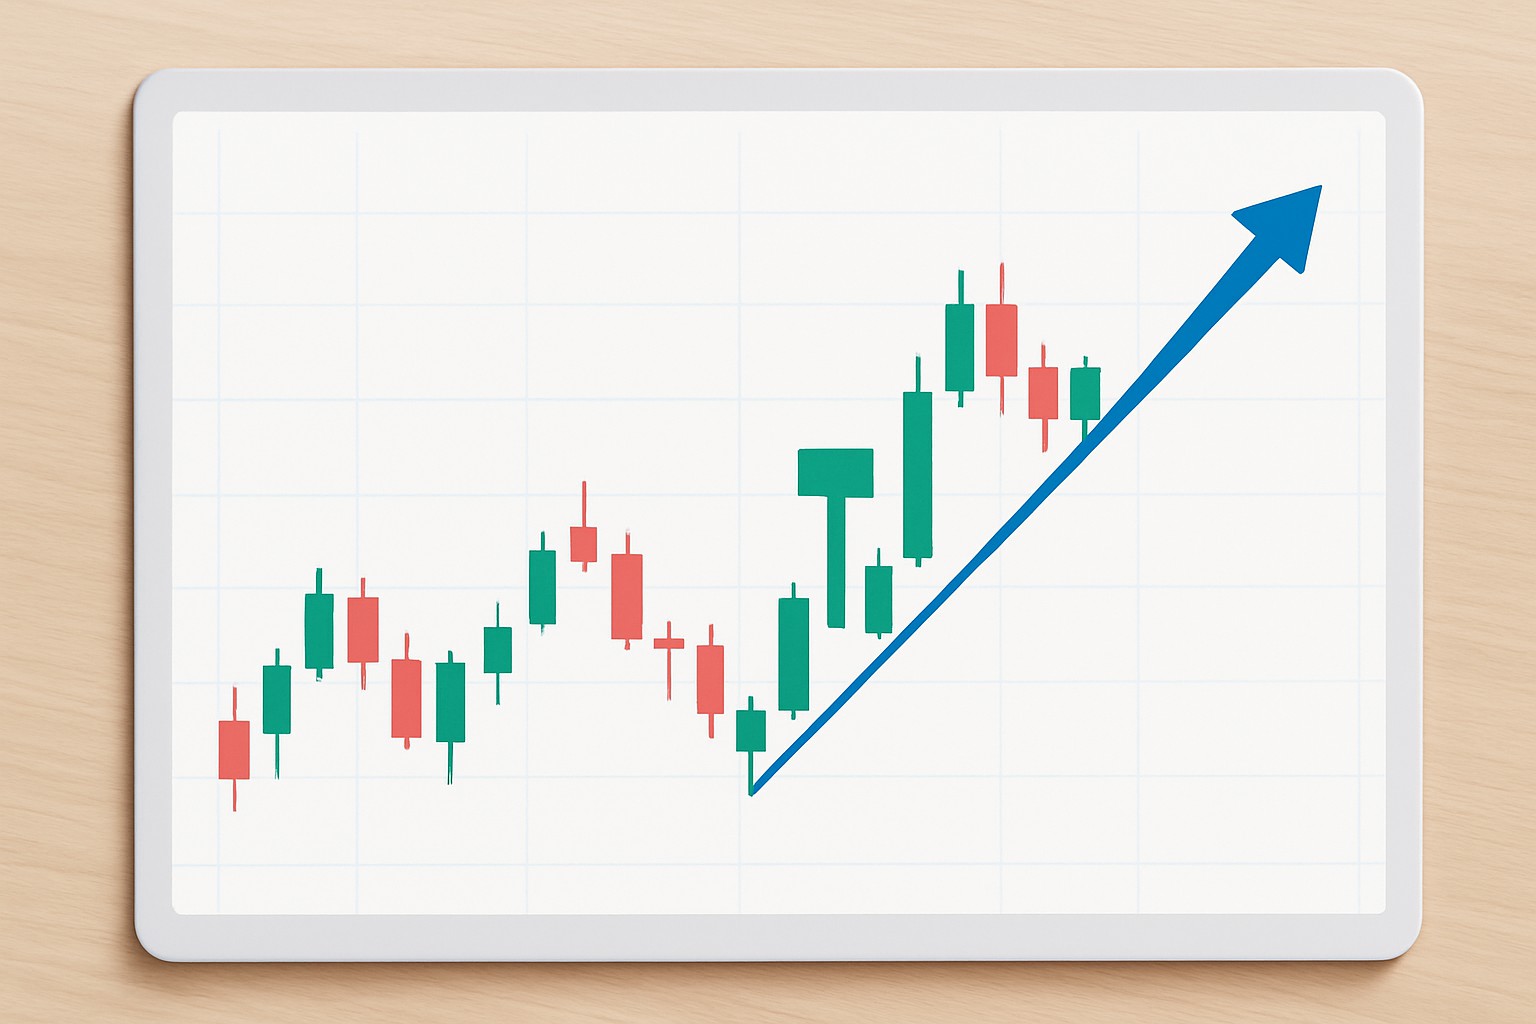
Spot a hammer by looking for a small rectangle known as the body near the top of the candlestick, with a skinny wick stretching well below it. That long lower wick tells a little story—the price got pushed down but then bounced back like a champ. If the top wick is either short or nowhere to be seen, it usually means the price didn’t stray far above the open or close.
Example of a hammer candlestick pattern on a trading chart showing its key features
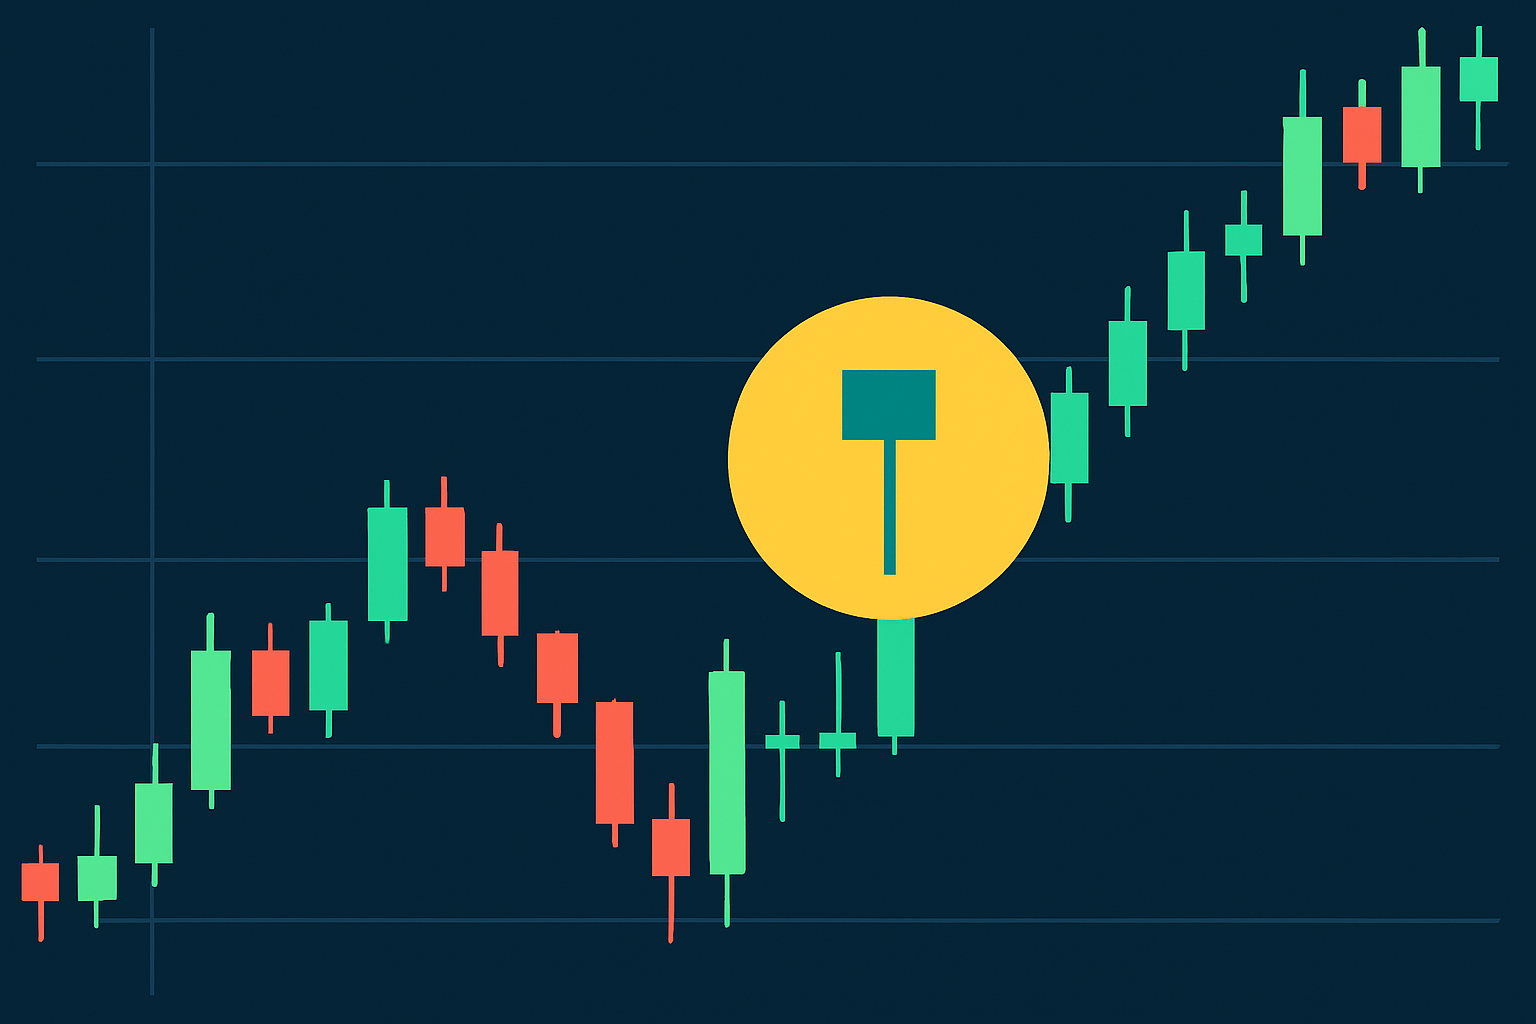
Scan your trading chart for candlesticks that have a small real body, where the open and close prices are very close to each other.
Watch for a long lower shadow or wick that is at least twice the length of the small body since it shows the candle is making a strong statement.
Make sure there is little to no upper shadow above the real body because this creates a clean silhouette.
Double-check that this candlestick appears right after a clear downhill slide which means a noticeable downward trend or a series of falling prices, as context is very important.
Don’t overlook the candle’s color since a bullish green or white candle can strengthen the reversal signal, although sometimes it just gives a subtle hint rather than a strong indication.
If you take your time with each step, you will begin to spot hammer candlesticks with a bit more confidence and ease. Tools like TradingView or TrendSpider are pretty handy for zooming in and really getting up close and personal with those candles.
Hammer candlesticks are pretty important because they often hint at a shift in market sentiment. When prices have been on the decline and a hammer shows up, it usually means buyers are starting to push back against those falling prices.
The hammer can be quite the handy pattern but leaning on it alone when making trading decisions is like trying to drive blindfolded. It’s smarter to back up that signal with other trusty technical indicators like volume analysis or moving averages or RSI. Doing so usually lowers the chance of getting tricked by false signals and helps you spot a genuine reversal when it’s knocking at the door.
It is worth taking a moment to think through a few key factors before jumping into a trade just because you spot a hammer candlestick. Check out the trend leading up to it, where the candle pops up on the chart, its color and how much trading volume is behind it. Platforms like TradingView come in handy here by offering detailed charts that can back up your gut feeling with solid data.
Kick off your practice with user-friendly charting platforms like TradingView they’re pretty intuitive and will not leave you scratching your head. These tools offer customizable candlestick charts along with replay features that are genuinely handy when you want to rewind the action.
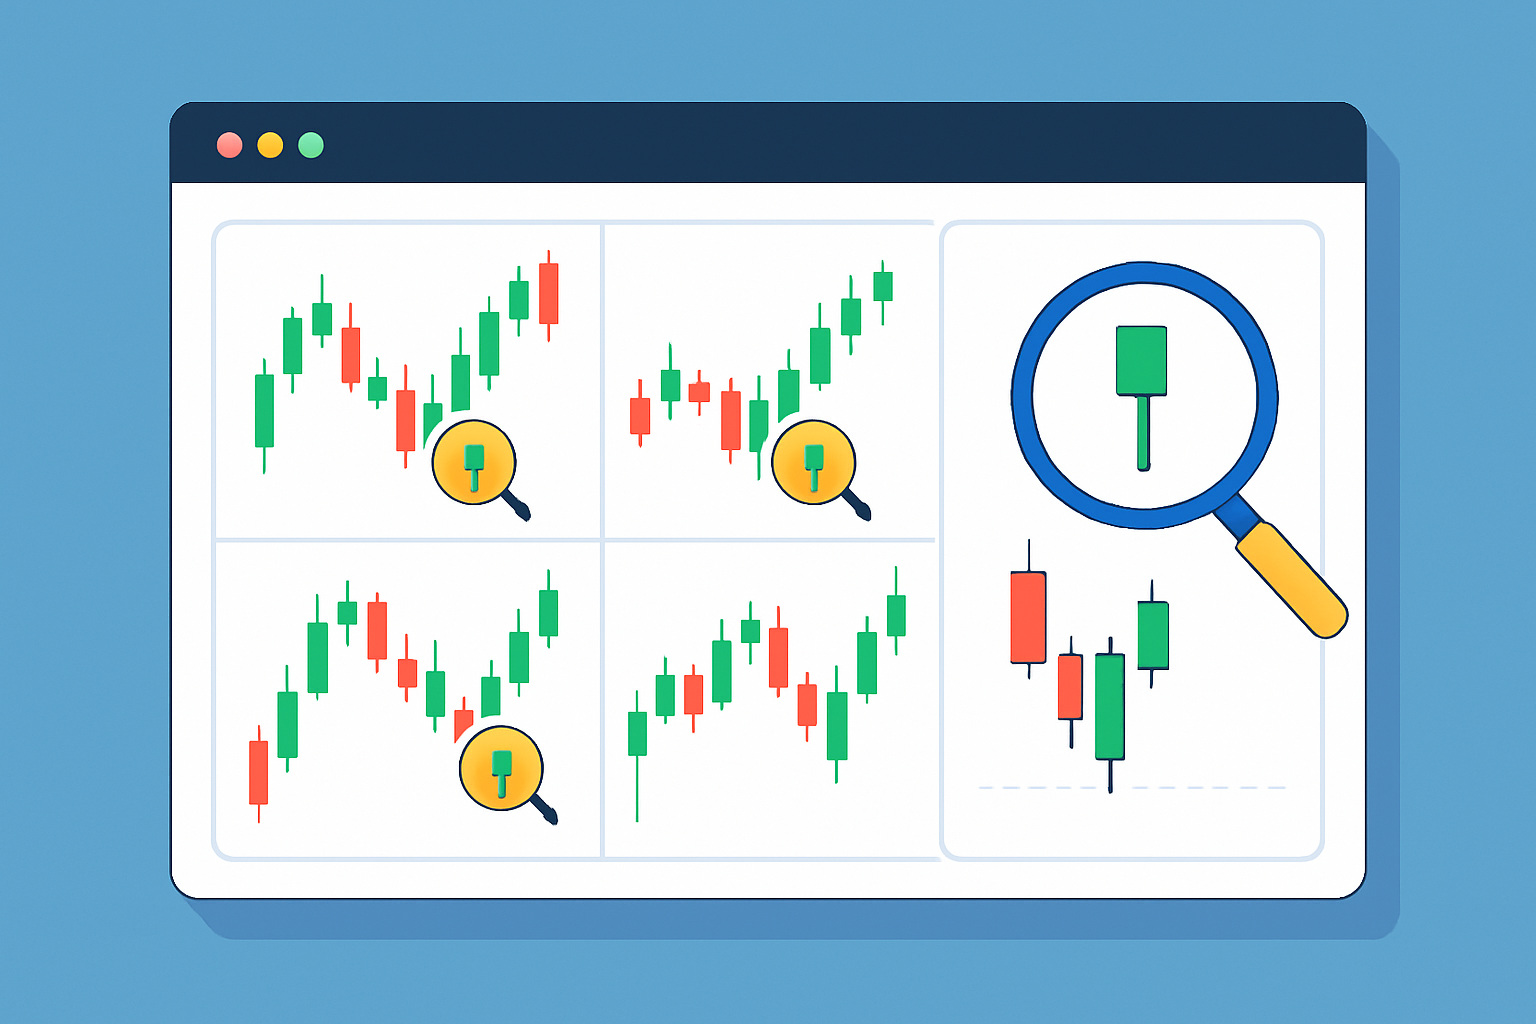
Interactive tool showcasing hammer candlestick patterns for beginner practice
Once you get the hang of spotting hammer candlesticks, try blending that insight with other technical tools like moving averages or RSI. Volume indicators also help paint a clearer picture of what is really going on in the market. Always remember to keep risk in check by setting stop-loss orders and resist the temptation to throw all your eggs in one basket with any single trade. Platforms such as Binance offer a bunch of trading options where you can test-drive these strategies firsthand.

Are you tired of juggling multiple tools for your trading needs? TradingView is the all-in-one platform that streamlines your analysis and decision-making.
With its powerful charting capabilities, real-time data, and vibrant community, TradingView empowers traders like you to stay ahead of the market. Join thousands who trust TradingView for their trading success.

20 posts written
Discover the doji candlestick—a powerful price action signal revealing market indecision. This begin...

Discover the bullish harami candlestick pattern—a key technical signal that can hint at trend revers...

Unlock the power of the head and shoulders pattern with this complete guide. Learn to spot, trade, a...

Learn how the harami candlestick pattern signals potential market reversals. This guide breaks down...