


Technical Analysis
IOU Meaning in Finance
Discover what IOUs mean in finance, their role as informal debt acknowledgments, and how understandi...

Candle patterns show up as shapes on candlestick charts, offering a window into market sentiment and throwing out hints about possible price reversals or whether a trend will keep on trucking.
This detailed guide digs into the key candle patterns every trader ought to know, from straightforward single-candle shapes to trickier multi-candle formations that can make your head spin. We’ll explore their features, the psychology beneath the surface, and how you can put them to work in real-world trading across assets like stocks, forex and cryptocurrencies. Along the way, you’ll pick up tips on spotting these patterns in live markets, double-checking them with trusty technical tools and weaving them smoothly into your trading strategy.
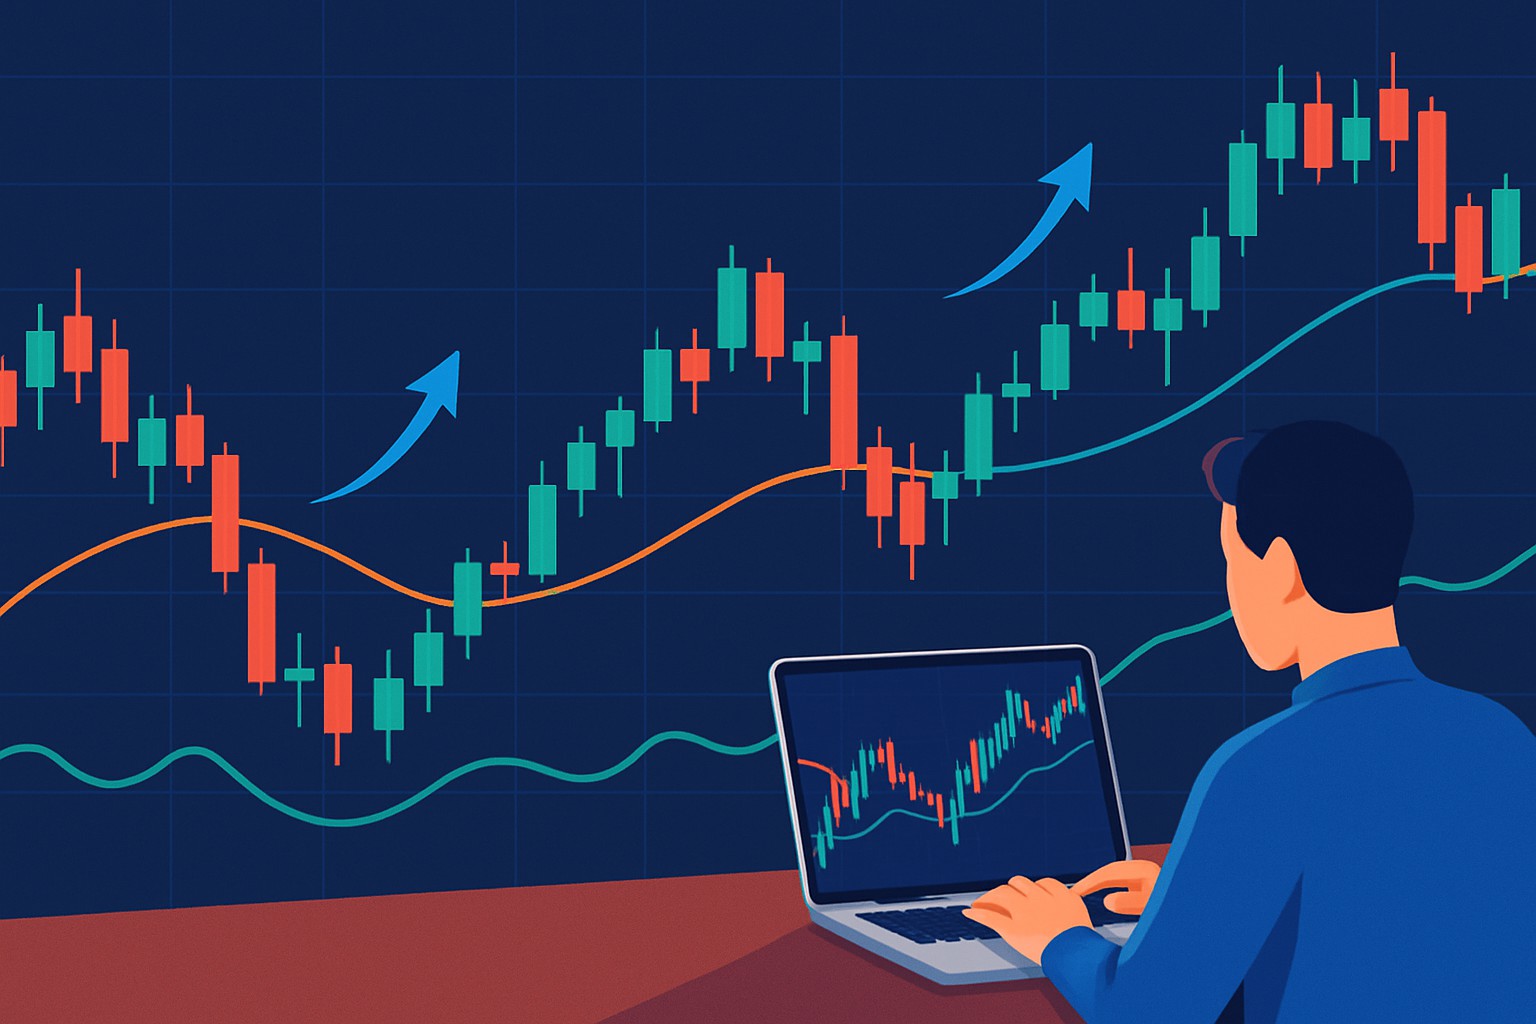
Let’s dive into the world of candlestick charts—those colorful little bars that can tell you more about market mood than a weather report can about tomorrow’s rain. At first glance, they might seem like cryptic hieroglyphs, but once you get the hang of their rhythm, they’re actually pretty straightforward and surprisingly insightful. In this section, we’ll peel back the layers to see what makes these charts tick and how you can read them like a pro (or at least like someone who doesn’t squint uncomfortably).
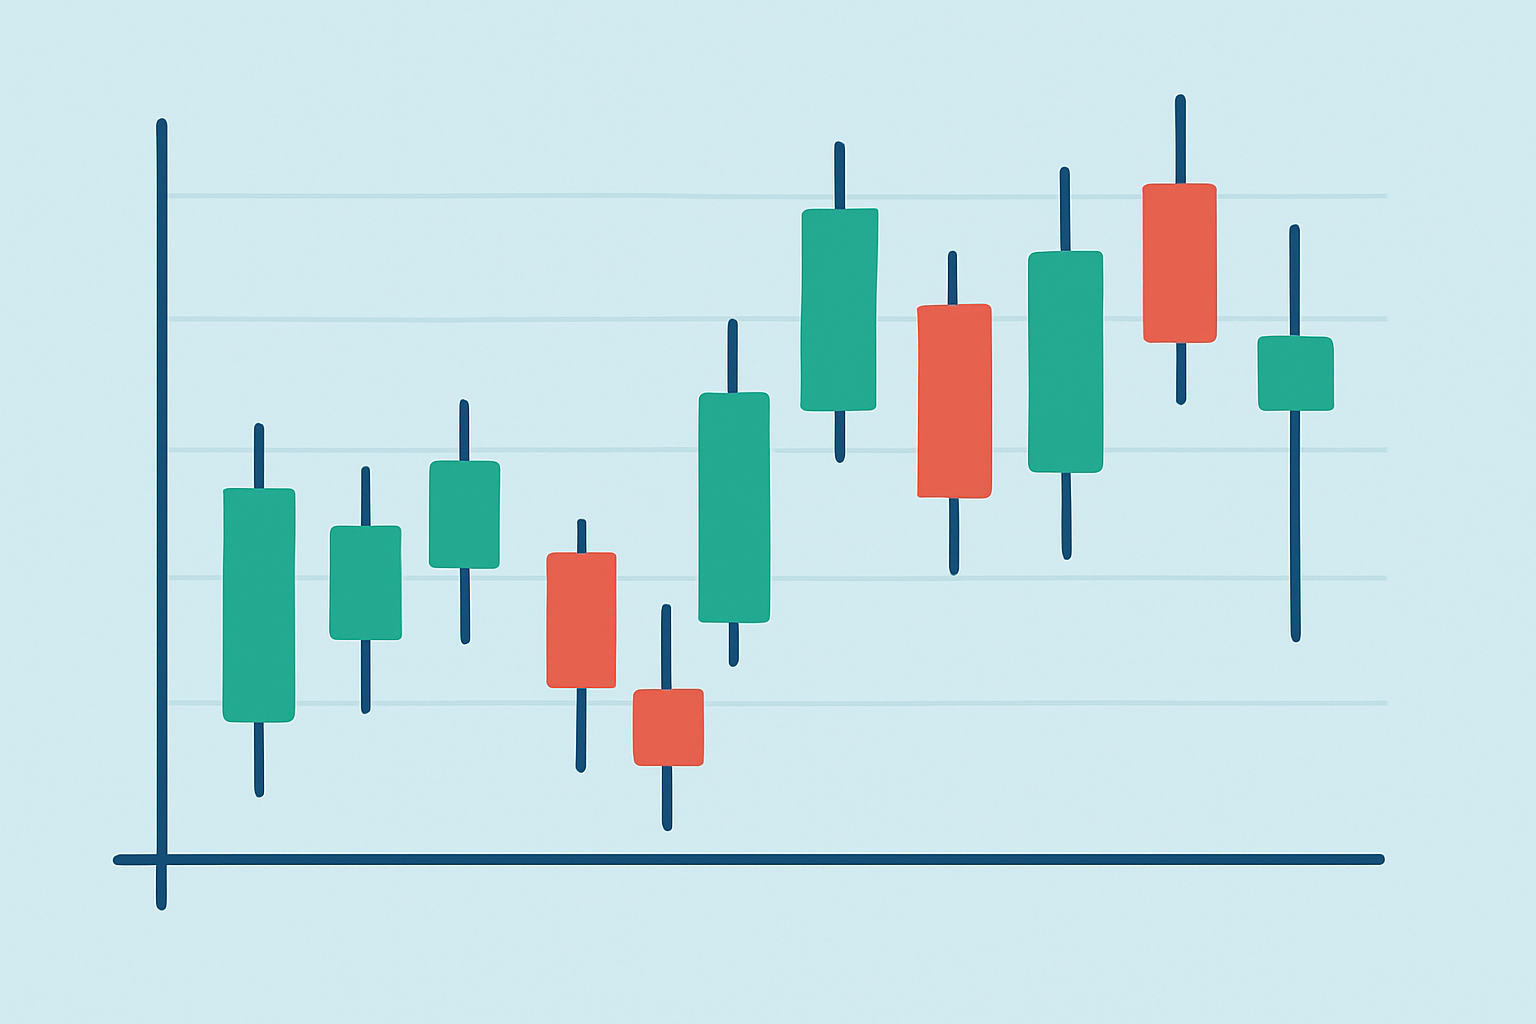
Candlestick charts are composed of individual candles that tell the story of open, close, high and low prices over a set period. Each candle has a body and a wick that give you a snapshot of how the price moved during that time.
Candlestick charts offer more than typical line charts that just connect the dots on closing prices. They lay out the full price range and show the ongoing tug-of-war between buyers and sellers in each time slice. The candle's body shows the gap between opening and closing prices while the wicks sometimes called shadows pinpoint the highest highs and lowest lows during that stretch. Colors do the heavy lifting here with bullish candles often in green or white and bearish ones in red or black. This makes it easier for traders to catch momentum shifts at a glance.
Starting off with the key single and dual-candle patterns lays down a rock-solid foundation for wrapping your head around more complex formations. Patterns like the hammer or engulfing candles usually throw out early hints about shifts in market sentiment.
The Hammer is a classic bullish reversal pattern characterized by a small body and a long lower wick. It tells us that the market tried to push prices down but buyers rejected those lower levels after a decline. The Hanging Man looks a lot like the Hammer but shows up after an uptrend and waves a subtle warning flag for a possible bearish turnaround. Then there’s the Doji candle where open and close prices are neck and neck, signaling serious market indecision—kind of like when you can’t decide what movie to watch—and it often appears just before a trend change. The Inverted Hammer flips things a bit with a long upper wick and small body, hinting bullish potential after a downtrend like a little nudge saying, "Hey, things might be looking up." Meanwhile, the Shooting Star appears after an uptrend with a long upper shadow and signals a bearish reversal as if the market just had second thoughts. The Bullish Engulfing pattern throws a small red candle under the bus with a much bigger green candle that swallows it whole, signaling serious buying pressure stepping onto the scene. Its nemesis, the Bearish Engulfing, does the exact opposite—here a powerful red candle takes over a green one suggesting the bears are tightening their grip and a downtrend might be lurking ahead.
Visual examples of the seven basic candlestick patterns including Hammer, Hanging Man, Doji, Inverted Hammer, Shooting Star, Bullish Engulfing, and Bearish Engulfing.
More intricate candle patterns involve multiple candles and usually pack a punch when it comes to signaling trades, as they capture those subtle shifts in market mood or finally clear up any lingering uncertainty.
The Morning Star is a classic bullish reversal pattern made up of three candles. It starts with a tall red candle followed by a small-bodied candle sitting just below that, signaling market indecision. Finally, a tall green candle closes inside the first candle’s body like it’s quietly tipping the scales. Its bearish counterpart, the Evening Star, often points to a downtrend reversal and flips the script. The Three White Soldiers pattern is straightforward. It shows three strong green candles marching in a row, a clear sign of solid bullish momentum. Flip that around and you get the Three Black Crows, which shows three consecutive red candles indicating serious bearish pressure looming. Then there are the Tweezer Tops and Bottoms, great for spotting price rejection at key support or resistance levels and serving as helpful hints that a reversal might be coming. The Dark Cloud Cover pattern tells its own story: a strong red candle opens above the previous green candle’s close but then dives below its midpoint, hinting at growing bearish pressure. On the flip side, the Piercing Line pattern turns that idea on its head with a green candle pushing deep into the prior red candle’s territory and showing a surge of buying strength coming back into play.
| Pattern Name | Number of Candles | Bullish/Bearish | Formation Criteria | Best Use Cases |
|---|---|---|---|---|
| Morning Star | 3 | Bullish | Starts with a hefty bearish candle, followed by a small-bodied candle nestled lower, and then a big bullish candle that closes well within the first candle’s body. It’s like the market taking a deep breath before shooting up. | Great for spotting those sneaky trend reversals when the downtrend’s ready to call it quits |
| Evening Star | 3 | Bearish | Kicks off with a large bullish candle, then a small-bodied candle perched above, and wraps up with a hefty bearish candle that closes into the original candle’s body. It’s the market’s way of waving goodbye to the uptrend. | Perfect for confirming when tops are about to roll over during uptrends |
| Three White Soldiers | 3 | Bullish | Three strong green candles marching in a row, each one closing higher than its predecessor. Think of it as bullish momentum with its foot firmly on the gas. | Solid confirmation of strong bullish momentum |
| Three Black Crows | 3 | Bearish | Three red candles in a steady sequence, each closing lower than the last, like the bears scripting a slow but sure takeover. | A clear sign of bearish momentum picking up steam |
| Tweezer Tops/Bottoms | 2 | Bullish/Bearish | Two candles with matching highs (tops) or lows (bottoms), acting like a price rejection handshake gone sideways. | Handy for spotting reversals hovering near key support or resistance levels |
| Dark Cloud Cover | 2 | Bearish | A bearish candle that opens above the previous bullish candle’s close but then slides down to close below its midpoint—like a cloud suddenly casting a gloom over a sunny day. | Often a heads-up for bearish reversals after an uptrend |
| Piercing Line | 2 | Bullish | A bullish candle that opens below the prior red candle’s low but manages to close above its midpoint — imagine a piercing ray of hope after a gloomy stretch. | Usually signals bullish reversals right after a downtrend |
Spotting candle patterns in the hustle and bustle of live markets definitely calls for a clear approach, paired with some trusty technical tools to back up those signals.
Dodge pesky false signals. Traders shouldn’t put all their eggs in the candle pattern basket. It’s smarter to blend pattern analysis with the bigger market picture, current news and trusty technical indicators. Volume confirmation is a must-have because a pattern on low volume isn’t strong enough to bank on. Checking multiple timeframes can be a game-changer. It helps you figure out if a pattern shows a small hiccup or a full-blown trend shift. Plus, setting stop-loss orders that respect the pattern’s quirks goes a long way in keeping risk in check.
Candle patterns pop up across the whole spectrum of trading styles from the lightning-fast moves of day trading to the more patient world of longer-term position trading.
Use candle patterns as entry signals but always make sure you’re in tune with the bigger trend. This way, you’re not just guessing but actually timing your trades more smartly.
When setting stop-loss orders, place them just beyond the candle’s extreme wick. This is a handy trick to keep your risk in check without getting stopped out too early.
Aim your profit targets around nearby support and resistance levels or use Fibonacci retracements that match how strong the pattern looks. This approach helps keep your goals realistic and grounded.
Be mindful of your position sizes and don’t put all your eggs in one basket, especially if the candle patterns send mixed signals. Managing risk is half the battle.
Combine candle patterns with other analysis tools like fundamental data or indicators to develop trade setups that have a better chance of success because relying on just one source often leaves you uncertain.
A swing trader who spots a bullish engulfing pattern near a strong support level might jump in with a tight stop loss just below the candle’s low. They hope to ride the wave up to resistance zones. Day traders often mix short-term moving averages with morning star formations to catch quick trend reversals before they vanish.
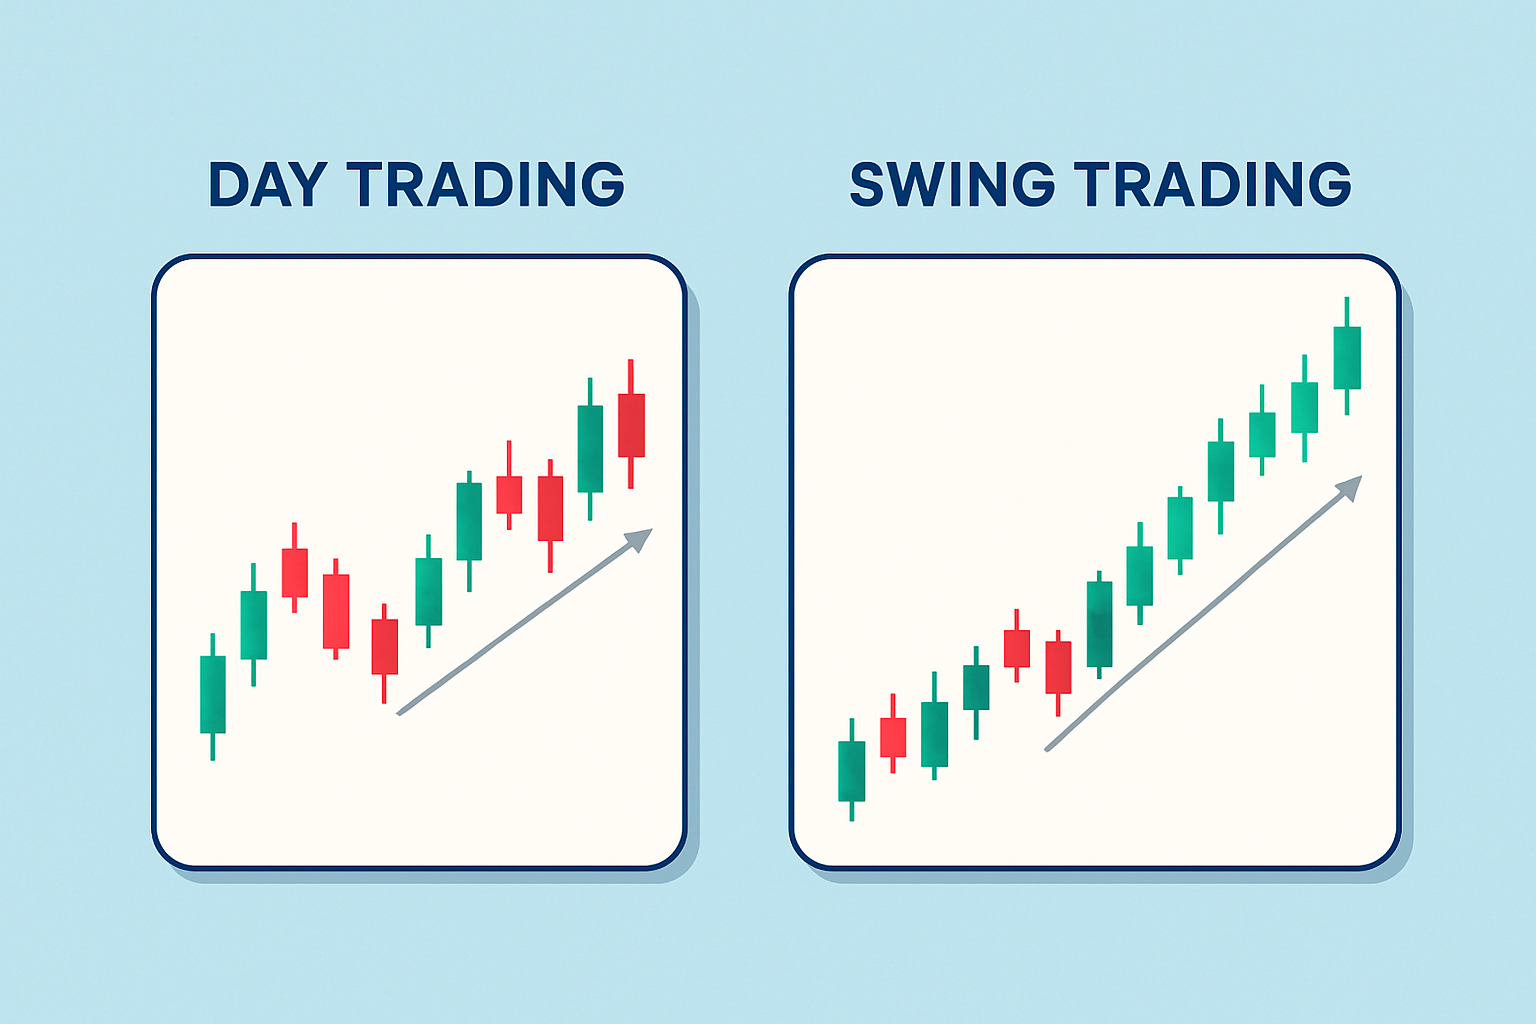
Examples of practical candle pattern strategies illustrated across different trading styles like day trading and swing trading.
Many traders including myself at times tend to stumble over common mistakes with candle patterns—things like ignoring the bigger trend or putting all their eggs in the pattern basket without backup confirmation. These slip-ups can easily lead to painful losses.
"Discipline and context truly make all the difference when working with candle patterns. No pattern is some magic ticket to success, but when you combine them with solid risk management and a decent understanding of the market, they can really become handy tools for traders trying to find their footing." – Experienced Market Analyst
Really getting a solid grip on candle patterns, traders often lean on well-respected classics like Steve Nison's Japanese Candlestick Charting Techniques and dive into technical analysis courses that zoom in on candlesticks. Pairing that with charting software that offers pattern recognition features—think TradingView or TrendSpider—can genuinely give your learning curve and live trading a nice little boost.
Consistently learning through backtesting and paper trading candle patterns really helps to sink your teeth into the subject, unveiling those subtle nuances that shift from one market to another and under different conditions. Leveraging technology and tuning in to what the community has to say usually gives the whole learning curve a much-needed boost.

Struggling to improve your trading performance? Edgewonk's advanced analytics tools are designed to give you the edge you need.
With detailed trade journaling, robust strategy analysis, and psychological insights, you'll gain a comprehensive understanding of your strengths and weaknesses. Don't miss out on this game-changing opportunity.

10 posts written
Discover what IOUs mean in finance, their role as informal debt acknowledgments, and how understandi...

Discover the bullish harami candlestick pattern—a key technical signal that can hint at trend revers...

Unlock the power of the bear flag pattern with our practical, step-by-step guide. Understand market...

Discover the doji candlestick—a powerful price action signal revealing market indecision. This begin...