


Technical Analysis
Most Important Candle Patterns Every Trader Should Know
Unlock the power of candle patterns to decode market psychology and improve your trading precision....

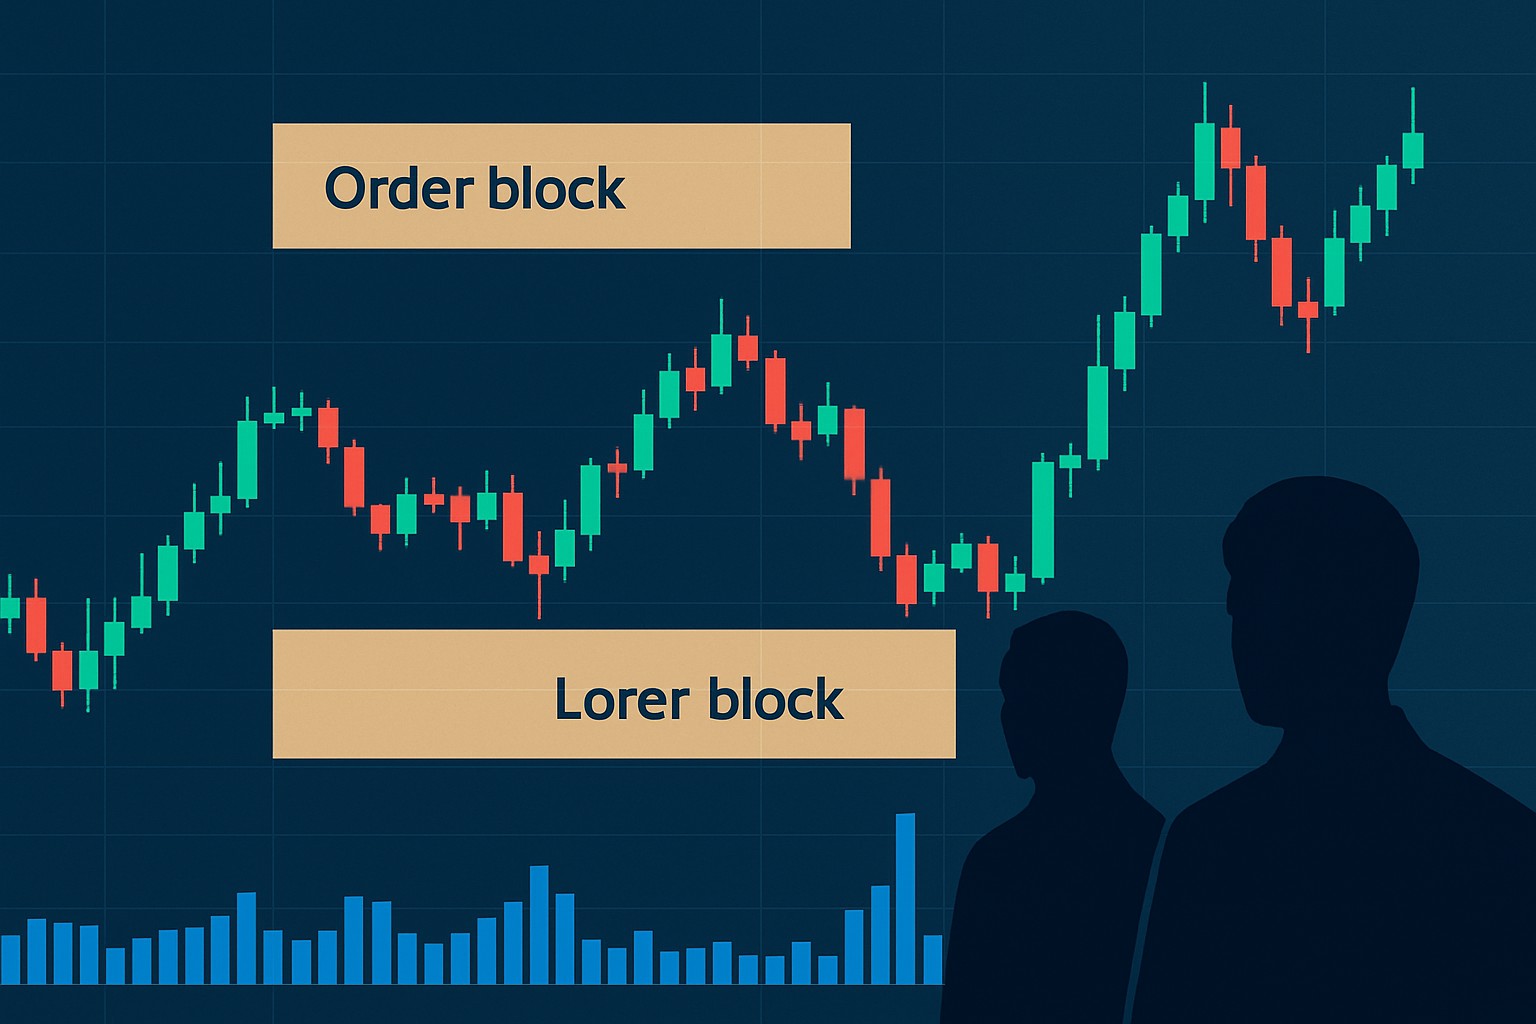
Order blocks are pretty handy tools in the world of technical analysis, shining a light on those spots where big institutional players have really left their mark on price movements. These zones tend to be like signposts, often signaling important market turning points. If you can spot them, it gives traders a leg up in nailing down key support and resistance levels with a bit more finesse. Once you get comfortable with the ins and outs of order block methods, you’re able to confirm these important areas with a fair bit more confidence—making it easier to time trades and keep risk in check.
Order blocks highlight those price zones where big players—large institutions—have dropped major buy or sell orders, often causing the chart to hit the brakes or change direction. These areas usually act as solid support or resistance when the price circles back, turning into critical levels you don’t want to overlook for confirmation.
Order blocks are candlestick patterns or zones where big institutional players have placed hefty orders. These create clusters of supply or demand you can almost feel lurking there.
These blocks usually appear after a strong price movement when institutions are building up or offloading their positions. This leads to the classic consolidation zones we all watch closely.
Institutional activity is important because their massive volume orders leave obvious footprints. Sharp retail traders can spot these and get a sneak peek into the market mood.
Bullish order blocks show up just before prices rise and act as demand zones. Bearish order blocks appear before downturns and serve as supply zones. This is like the market subtly tipping its hand.
When reading price action around order blocks, watch for signs like price rejections, periods of consolidation or continuation patterns. These clues suggest institutions are playing their hand behind the scenes.
Pinpointing order blocks usually means juggling several timeframes and paying close attention to how prices behave over time. Traders often lean on tools like candlestick pattern analysis and volume tracking and price action signals within context to sniff out genuine institutional moves.
Price action near an order block often throws out telling clues about how solid it might be. Traders keep an eye on patterns like pin bars, engulfing moves and retests to figure out if that order block is still holding the fort or if it’s been busted.
Volume plays a key role in confirming order blocks since institutional orders usually leave behind distinctive volume footprints. Seasoned traders often develop a knack for spotting volume spikes, clusters and divergences around likely order block zones.
Order blocks tend to work even better when paired with other technical tools like moving averages or Fibonacci retracements and market structure breaks. This combo creates layered confirmation that’s great at reducing risk and boosting the overall quality of your trades.
Even seasoned traders can find themselves tangled up with order blocks now and then. Missing or misreading vital validation clues often leads to signals that throw you for a loop and inevitably some less-than-stellar trades.
Mixing up order blocks with general supply and demand zones makes accuracy a bit iffy at best.
Ignoring the importance of the timeframe by pinpointing order blocks on irrelevant or really tiny timeframes—kind of like trying to read a billboard through a keyhole.
Overlooking volume confirmation and skipping the step to check if institutional orders actually left their mark on the zone.
Relying solely on spotting order blocks without backing them up with solid price action signals like retests or candle patterns usually throws a wrench in the plans.
Confusing false breakouts for the real deal often leads to jumping the gun with early or badly timed trade entries.
Using order block analysis effectively takes discipline and a solid clear-cut plan. Pinpoint your order block levels with care and watch out for multiple signals to back them up. Stay prepared for the market to throw a few curveballs your way. Zero in on managing risk around breakout failures and delayed confirmations.
Pick timeframes where institutional activity usually makes the biggest splash, like higher intervals such as 1H or 4H and daily. These tend to reveal the real action.
Make sure to clearly mark order blocks on your charts using colored zones or notes to make tracking easier during live price swings.
Double-check each order block with at least two different methods such as volume analysis or observing price action signals to avoid going in blind.
Place your stop-loss orders just outside the edges of the order block to limit your risk if the price breaks out unexpectedly.
Try to enter trades on retests or confirmation candles instead of jumping in on the first move for a better risk-to-reward setup.
| Technique | Ideal Conditions | Pros | Cons |
|---|---|---|---|
| Candle Structure Analysis | Clear engulfing candles close to an order block | Shines a light on where the big institutional players might be lurking | Can sometimes throw up false signals, especially when the market is doing its usual choppy dance |
| Close Location Validation | Closes within or just beyond the order block area | Helps back up the strength of a support or resistance level, giving you a bit more confidence | Relies heavily on nailing those levels accurately, which can be a bit of a delicate art |
| Volume Spikes | Noticeable volume increase near the order block | Highlights when the big fish are making their moves | Could mislead if the volume spike is coming from another asset, so watch your step |
| Wick Rejection Confirmation | Long wicks pushing back price extremes | Provides clear, visible clues that the market is pushing back hard | Usually needs a helping hand from other signals to really seal the deal |
| Confluence with Support/Resistance | Order blocks that overlap with established zones | Makes the level feel a lot more trustworthy, like a tag-team effort | But beware — too many overlaps can muddy the waters and make things more confusing |
| Price Action Signals | Pin bars, engulfing patterns, retests at order block | Offers real-time nods of validation, which traders love | Sometimes these signals can be a bit like Rorschach tests — open to different reads |
| Volume Dry-ups Before Breakouts | Low volume right before a breakout | Often hints that the opposing pressure is losing steam | Might fall flat in markets that are charging ahead with strong trends |
| Integration with Moving Averages | Order blocks near moving average lines | Adds a helpful layer of context about what the market's mood might be | Just a heads up — moving averages often lag behind what’s really happening with price action |

Tired of missing opportunities and making suboptimal trading decisions? TrendSpider's cutting-edge platform automates complex technical analysis, saving you time and reducing human error.
With multi-timeframe analysis, dynamic alerts, backtesting, and customizable charting, you'll gain a competitive edge in identifying trends and making informed trades across global markets.

16 posts written
Unlock the power of candle patterns to decode market psychology and improve your trading precision....

Discover the doji candlestick—a powerful price action signal revealing market indecision. This begin...

Discover the bullish harami candlestick pattern—a key technical signal that can hint at trend revers...

Unlock the power of the head and shoulders pattern with this complete guide. Learn to spot, trade, a...