
Insights
What the DEM Indicator Is and How to Use It
Discover how the DEM indicator offers a smoother, more responsive view of market trends. This guide...


Contrarian investing is all about swimming against the tide, aiming to cash in when market sentiment swings to the extreme ends - a strategy often informed by tools like the AAII sentiment survey.
The AAII Sentiment Survey is a trusty gauge that captures the mood swings of individual investors. It provides some pretty handy insights into the ever-changing market psychology.
The American Association of Individual Investors (AAII) conducts a weekly Sentiment Survey that gathers insights from thousands of everyday investors. These individuals weigh in on whether they’re feeling bullish or bearish about where the stock market might be headed over the next six months.
The AAII Sentiment Survey has been a well-regarded measure of market sentiment for decades. It often lines up with significant market shifts, making it a surprisingly handy tool to have in your back pocket.
Investor sentiment captures the overall mood or mindset of market participants. Think of it like the electric vibe of a crowd at a sports game reacting to every play on the field. The stock market rarely moves based on cold, hard facts alone because it’s also influenced by the emotions swirling around. When fear creeps in, prices can take a nosedive even if the fundamentals remain rock solid. On the other hand, too much optimism might push prices to levels that make you raise an eyebrow.
Contrarian investing is all about swimming against the tide in the market snapping up stocks when most individuals are biting their nails with worry, and cashing out just as everyone’s riding high on optimism.
Contrarian investing often gets a bad rap as merely swimming against the tide without a plan but in reality it demands a careful eye and sharp timing. It also requires a knack for spotting when the crowd’s extreme emotions signal golden opportunities rather than traps waiting to snap shut.
Reading the AAII Sentiment Survey for contrarian signals usually means keeping an eye out for moments when bullish or bearish sentiment spikes to unusually high levels. These extremes often hint that the market might be running on fumes—when optimism or fear get a bit carried away, a reversal could be lurking just around the corner.
Keep a sharp eye on the weekly AAII Sentiment Survey results because these little nuggets often reveal patterns before they become obvious.
Watch for those extreme sentiment levels, like bullish readings soaring above 60% or bearish ones creeping past 40. That is when things start to get interesting.
Compare these sentiment extremes against actual market price movements. Do they dance in sync or step on each other's toes?
Play the contrarian card by buying when bearishness hits its peak and maybe thinking twice about buying when bullishness is running wild. Perhaps it is time to lock in those profits.
Always lean on other technical or fundamental indicators to back up what sentiment is whispering before pulling the trigger on any trades.
Bullish sentiment readings above 60% often signal strong optimism and set the stage for market highs. On the flip side, when bearish sentiment creeps over 40%, it usually mirrors growing fear and hints that a market bottom could be near.
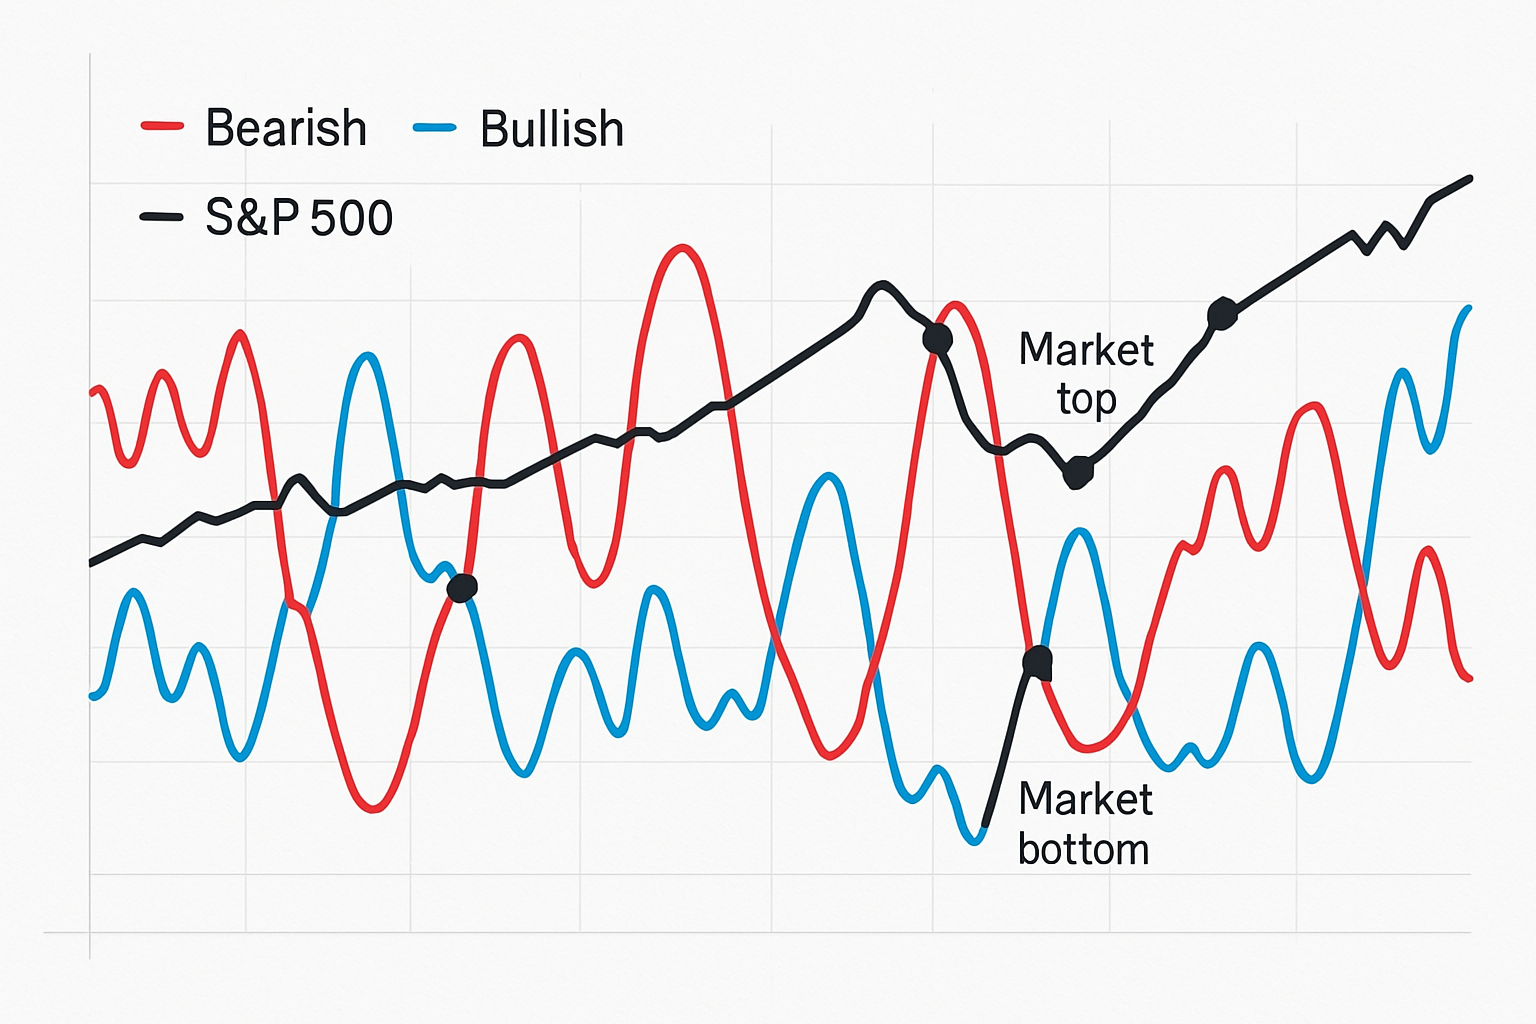
Visual chart example of AAII Sentiment Survey data overlaid with S&P 500 market movements illustrating contrarian signals
The AAII Sentiment Survey provides some handy insights, but I’ve found it’s best not to lean on it exclusively. Emotional extremes tend to hang around longer than most people expect, and market behavior rarely sticks to a neat script when it comes to sentiment.
Let's dive into some eye-opening examples of contrarian investing, using the trusty AAII sentiment data as our guide. You might find that going against the grain, at times, is not just brave—it's downright rewarding.
Extreme readings in AAII sentiment tend to ring the alarm bells for significant market moves. Those sharp swings in investor mood captured by the survey have often popped up right before both rallies and declines.
Investors who kept a close eye on the AAII Sentiment Survey during these stretches probably noticed that unusually strong bearish or bullish readings often acted like blinking neon signs pointing the other way. Jumping in to buy when fear hit the roof in late 2018 and early 2020 set them up nicely for some impressive rallies. On the flip side, those who played it safe and took profits after a wave of optimism in 2019 managed to sidestep a few nasty market dips.
The AAII Sentiment Survey usually shines brightest when paired with other market indicators.
Using several indicators together can often help cut down on those pesky false signals you might get from relying on just one measure. For example, when you see a jump in AAII bullish sentiment paired with rising margin debt and low VIX readings it usually points more clearly to an overheated market.
Emotional discipline is a big deal because contrarian moves often feel downright uncomfortable, especially when the AAII sentiment survey shows extreme readings that fly in the face of what seems obvious during strong market trends.
Warren Buffett once wisely pointed out that it’s smart to be cautious when everyone else is charging full steam ahead, and to lean into risks when most individuals are dragging their feet.

Tired of missing opportunities and making suboptimal trading decisions? TrendSpider's cutting-edge platform automates complex technical analysis, saving you time and reducing human error.
With multi-timeframe analysis, dynamic alerts, backtesting, and customizable charting, you'll gain a competitive edge in identifying trends and making informed trades across global markets.

14 posts written
Discover how the DEM indicator offers a smoother, more responsive view of market trends. This guide...
Learn the meaning of NFP in trading and why the monthly Non-Farm Payrolls report is a key economic i...
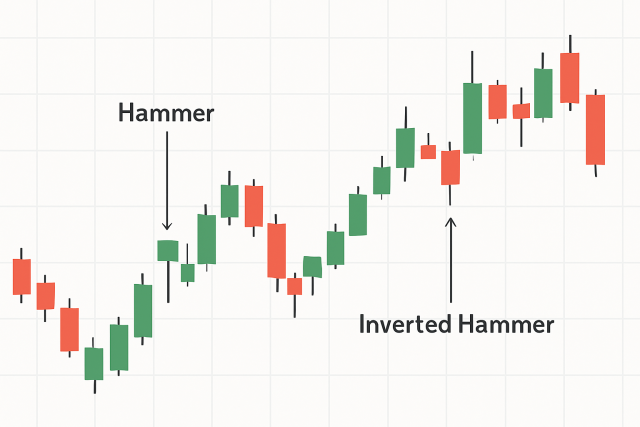
Hammer candle patterns are essential for spotting trend reversals. This guide simplifies their meani...
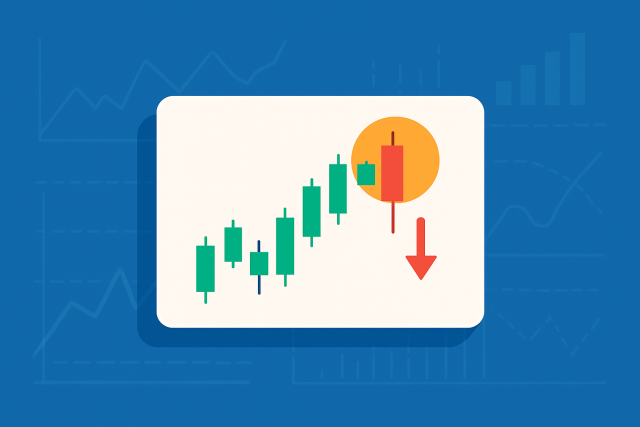
Master the hanging man formation to spot potential bearish reversals confidently. This guide breaks...