


Insights
Contrarian Investing Using the AAII Sentiment Survey
Unlock the power of contrarian investing by leveraging the AAII Sentiment Survey. Learn how investor...

In the often tangled world of trading having reliable indicators in your toolkit can be a real lifesaver for analysts and traders aiming to make smarter moves. Among the sea of tools out there the DEM indicator quietly holds its ground as a lesser-known yet surprisingly handy technical analysis tool. It offers valuable insights into market momentum and the strength of trends, giving traders a fresh angle to consider alongside crowd favorites like RSI or MACD.
The DEM indicator, short for Double Exponential Moving Average indicator, is a nifty technical tool designed to smooth out price data while trimming down lag and doing a better job than your average moving averages. Built with technical analysis in mind, it helps traders catch trends and potential reversals faster while keeping things reliable.
Unlike the more familiar Relative Strength Index (RSI) or the Moving Average Convergence Divergence (MACD), the DEM indicator takes a slightly different approach—it's mainly designed to smooth out price movements with less lag. Rather than bouncing around within rigid ranges or zeroing in on divergence, it’s a bit quicker on the uptake when prices start to move.
The DEM indicator works by applying an exponential moving average twice which helps reduce the usual lag that occurs with a single EMA. It starts by calculating an EMA of the price then runs another EMA on that output. This results in a smoother and more responsive signal that better captures price trends.
Imagine trying to clean up a noisy radio signal by running it through a filter twice to get that crisp clear sound you want to hear. The DEM indicator plays the same game by processing price data two times to cut through the market chatter and deliver a smoother clearer trend signal.
The DEM indicator helps unveil the strength and direction of market trends by smoothing out pesky price swings. It stays more on the ball than your average moving average when catching shifts. I’ve found it useful for spotting early trend reversals and confirming when trends are still holding strong. It also picks up on changes in momentum.
Include the DEM indicator in your trading strategy by picking a timeframe that matches your trading rhythm. Adjust the indicator periods to fit your personal style and pair DEM signals with other indicators to double-check your moves.
Choose the timeframe that really suits your trading style. Daily charts work great for swing trading, and intraday setups are perfect if you are into scalping.
Pair DEM signals with volume indicators or trusty trend tools like MACD or RSI to strengthen your confirmation. Think of it as getting a second opinion before making a move.
Lay down clear entry and exit rules based on DEM crossovers or when the trend shifts. Having a game plan helps keep emotions in check.
Always take a step back and consider DEM signals in the bigger picture of the market because this little habit can save you from chasing false alarms and costly mistakes.
One common pitfall I have noticed is putting all your eggs in the DEM indicator basket without taking a peek at other signals or the overall market vibe, which often leads to jumping into trades a bit too soon. Messing around with the indicator settings too much to chase the latest trends tends to dilute its reliability. The good news is you can steer clear of these hiccups by sticking to a disciplined approach and mixing in a variety of analysis tools.
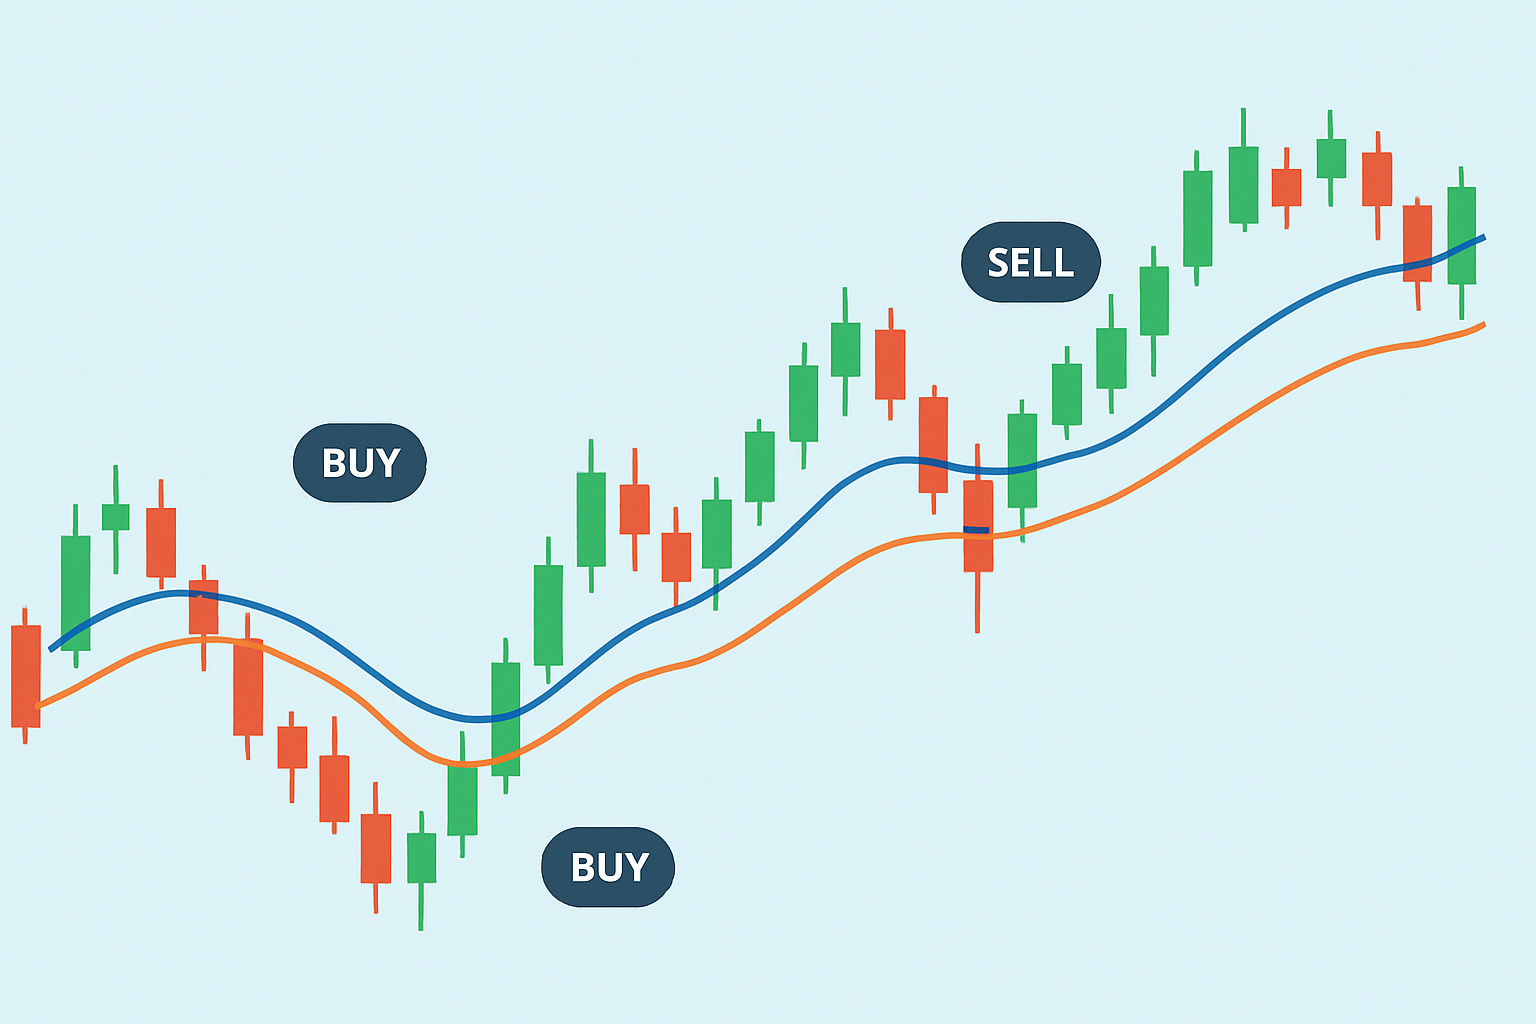
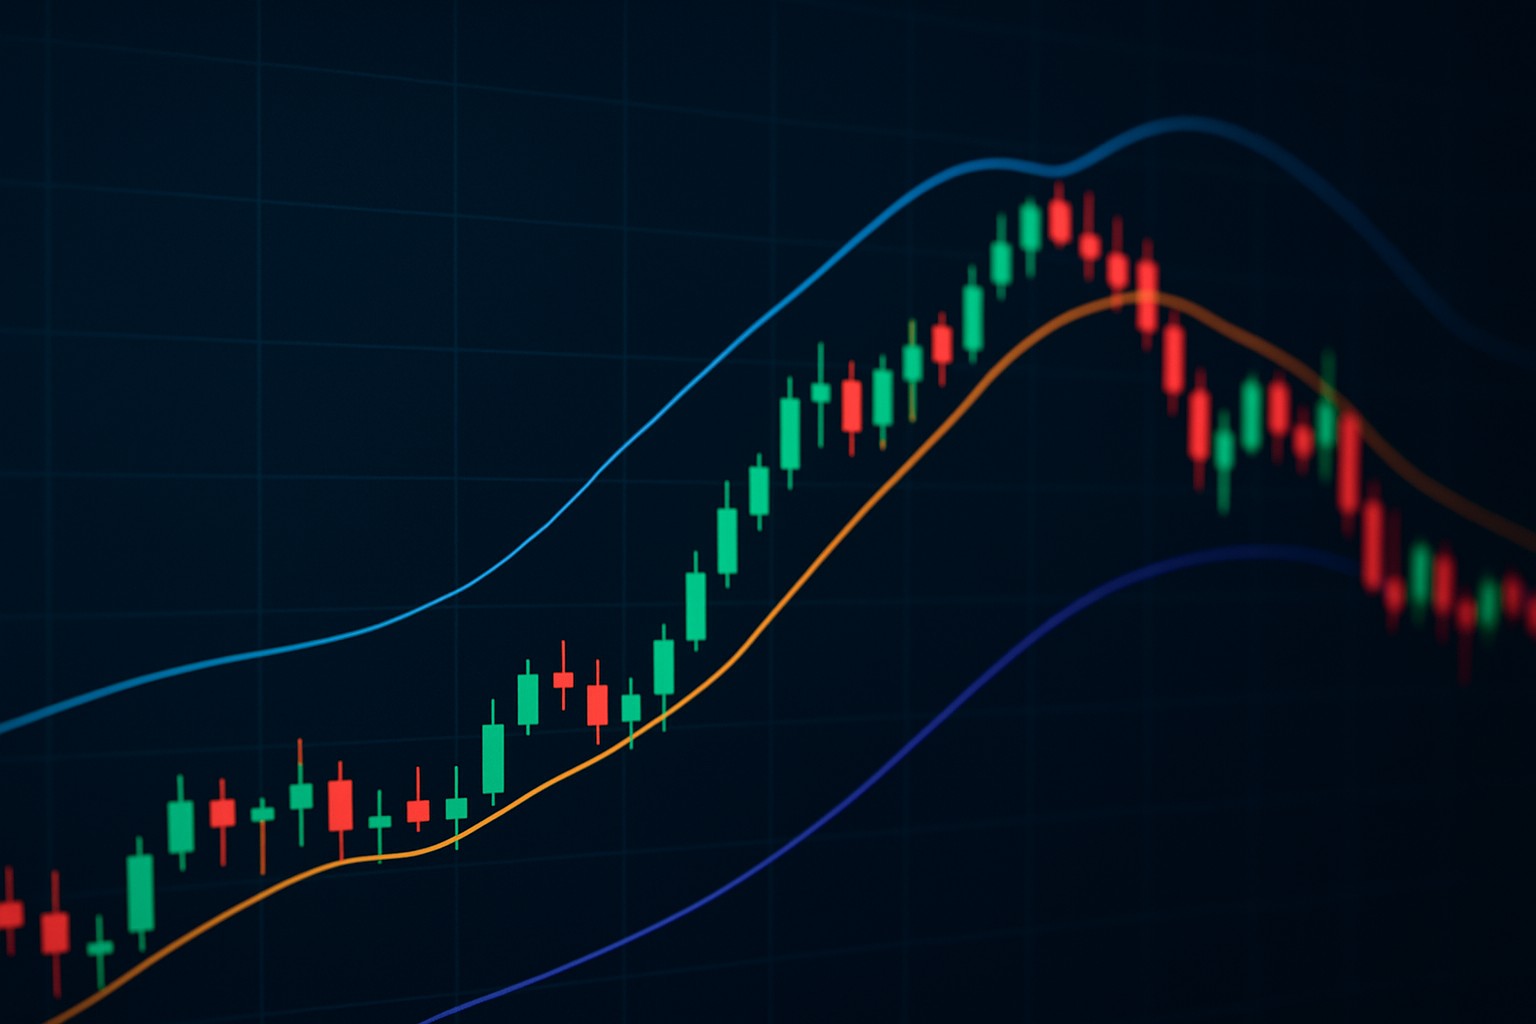
Chart example showing the DEM indicator applied on a price graph with annotations highlighting crucial buy and sell signals for trading.
The DEM indicator really shines in trending markets where the price marches steadily in one direction over time. In those cases it nails the momentum and delivers signals on time. But in sideways or choppy markets it tends to throw out more false alarms or lag when the price action gets wishy-washy, like many oscillators.
People often fall into the trap of thinking the DEM indicator is a magic wand that always delivers profits or perfectly calls market highs and lows. On top of that it’s not uncommon for people to confuse DEM with other indicators or concepts because the acronyms are alike. This leads to some head-scratching misuse.
If you’re looking to really wrap your head around the DEM indicator and how it’s put to work, diving into specialized trading books that focus on advanced moving averages can be a real game-changer. I’ve also found that online tutorials breaking down exponential smoothing techniques often come in handy, especially when you want to get your feet wet without drowning in jargon. Plus, don’t overlook the active communities on platforms like TradingView and TrendSpider because these crowds often share nuggets of wisdom and clever strategies that can spark some 'aha' moments.

Are you tired of juggling multiple tools for your trading needs? TradingView is the all-in-one platform that streamlines your analysis and decision-making.
With its powerful charting capabilities, real-time data, and vibrant community, TradingView empowers traders like you to stay ahead of the market. Join thousands who trust TradingView for their trading success.

14 posts written
Unlock the power of contrarian investing by leveraging the AAII Sentiment Survey. Learn how investor...

Learn the meaning of NFP in trading and why the monthly Non-Farm Payrolls report is a key economic i...
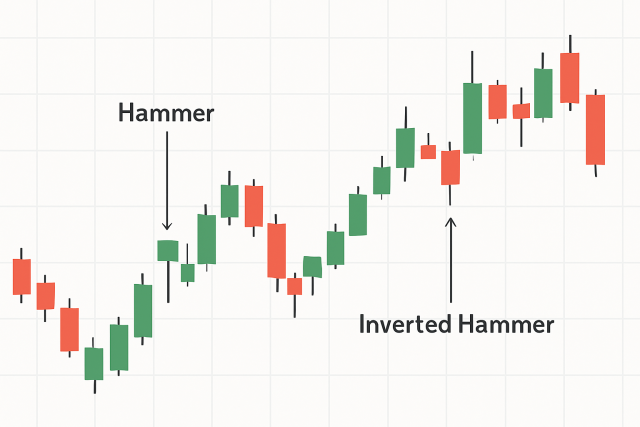
Hammer candle patterns are essential for spotting trend reversals. This guide simplifies their meani...
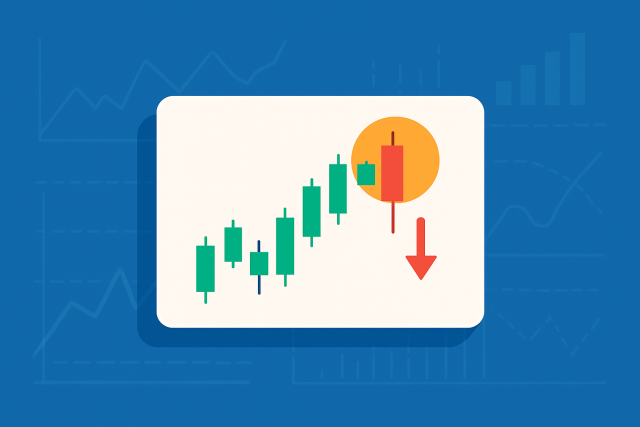
Master the hanging man formation to spot potential bearish reversals confidently. This guide breaks...