


Insights
Contrarian Investing Using the AAII Sentiment Survey
Unlock the power of contrarian investing by leveraging the AAII Sentiment Survey. Learn how investor...

Stock chart patterns often offer handy clues about possible shifts in market sentiment and where prices might head. One pattern that tends to grab attention is the hanging man candlestick. It usually signals a bearish reversal after an uptrend. The hanging man pattern can be a head-scratcher for many traders. This article breaks down the hanging man formation in plain language. It shows you exactly what it looks like, how to spot it on stock charts, and the key things to keep in mind when it appears.
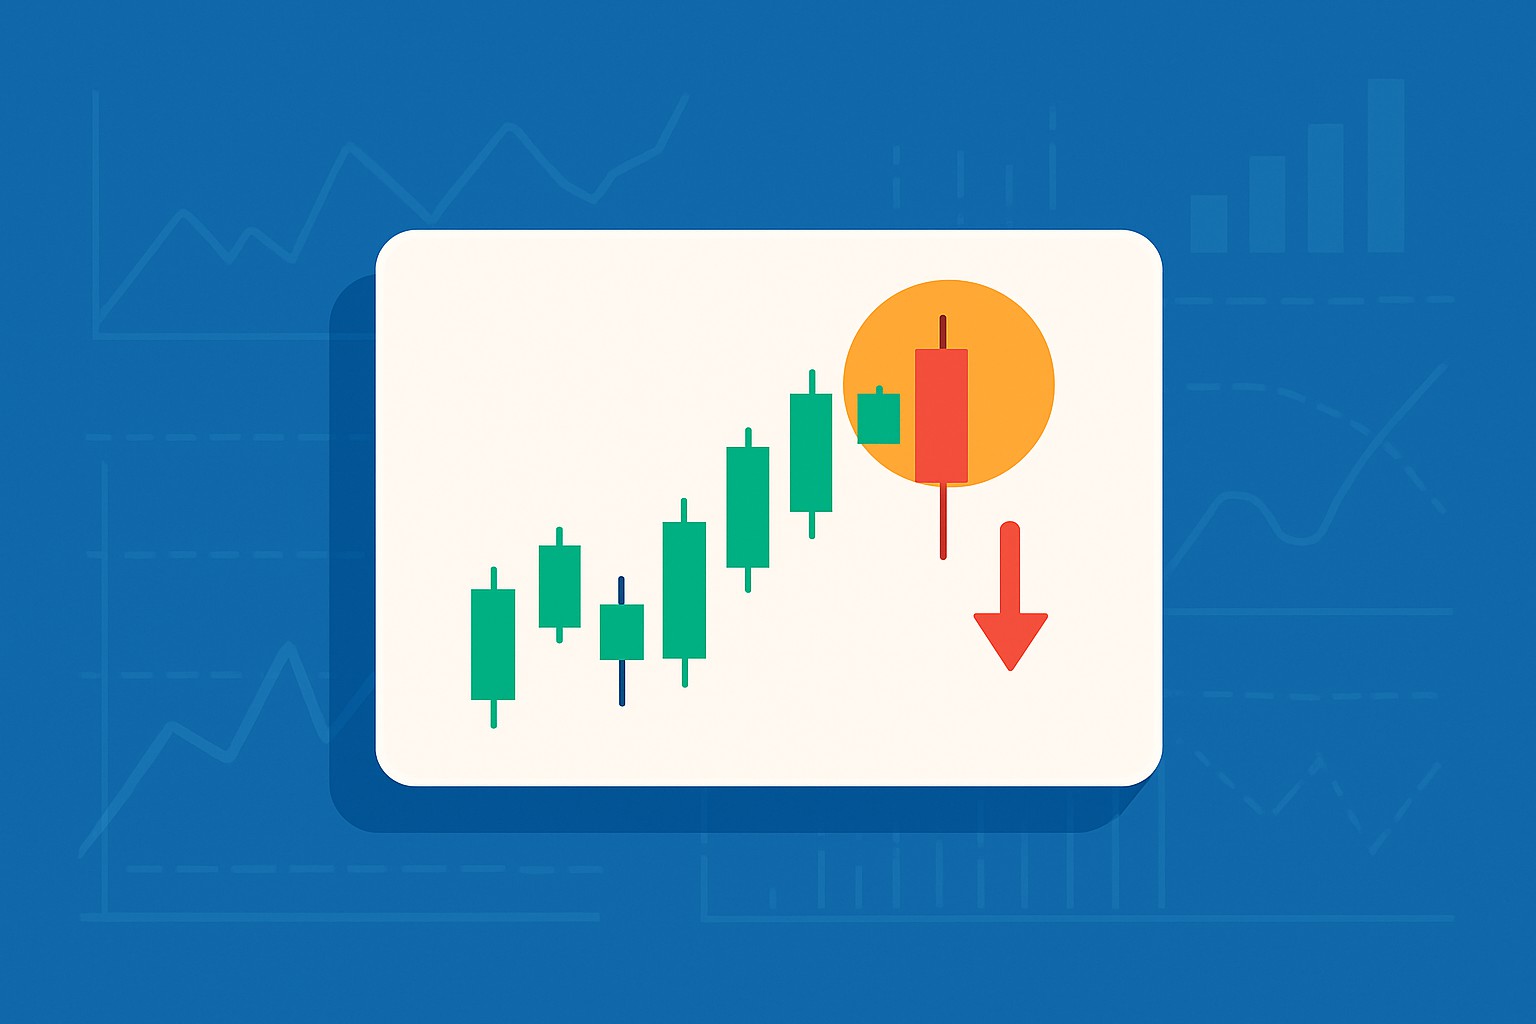
A hanging man is a rather distinctive candlestick pattern that pops up after a lengthy upward price rally quietly signaling there might be a bearish shift looming. Its shape is pretty unmistakable—kind of like a little figure hanging from a line, which definitely grabs your attention. But beyond the quirky look, the real story lies in what it reveals about trader sentiment and the potential shift in momentum on the chart.
The candlestick resembles a hanging man at first glance but its true meaning runs deeper and reveals the twists and turns of market psychology. In the thick of a bullish rally sellers came in with enough force to push prices down quite a bit
Spotting a hanging man is about more than just eyeballing a lone candlestick shape. It usually appears during an uptrend and requires confirmation from other indicators to support it. So, here’s a handy step-by-step guide to help you clearly recognize this pattern.
Make sure the stock or asset has been cruising along in a clear and steady uptrend before the hanging man shows up because this pattern often hints that the bulls might be handing over reins to the bears.
Keep an eye out for a small real body near the top of the day’s price range. This tells you that upward movement was limited during that session, almost like the market was catching its breath.
Spot a long lower shadow at least twice the length of the real body. This points to sellers pushing prices down with some gusto.
Check that the candlestick has little or no upper shadow. This shows prices didn’t get much love above the open or close.
Watch for a spike in trading volume on the hanging man day and see how the next day plays out—ideally with a bearish candle—to seal the deal on that reversal signal.
Images like the one above give you a pretty clear snapshot of what a hanging man candlestick looks like in real market conditions. Whether you’re just dipping your toes into trading or have been around the block a few times, seeing these candlesticks in action really helps sharpen your pattern recognition.
The hanging man pattern is far more than just some quirky shape on a chart. It actually captures the tug-of-war between buyers and sellers, revealing the subtle shifts in trader sentiment as the trading session unfolds.
The hanging man signals a moment when the market seems to lose its nerve, even though the bullish momentum is still holding strong. It is like a little early warning flag that a reversal might be just around the corner.
Spotting a hanging man can be a handy early warning sign but jumping the gun without double-checking usually leads to false alarms and unnecessary losses. Traders really need a solid way to gauge how trustworthy the signal is before diving in.
Hold off until the next trading session brings a confirming candle, ideally a bearish one that closes below the hanging man’s real body. This detail helps confirm the reversal is on solid ground.
Keep an eye on the trading volume during the hanging man pattern because when volume spikes it tends to add extra punch by showing stronger market interest and making the pattern more convincing.
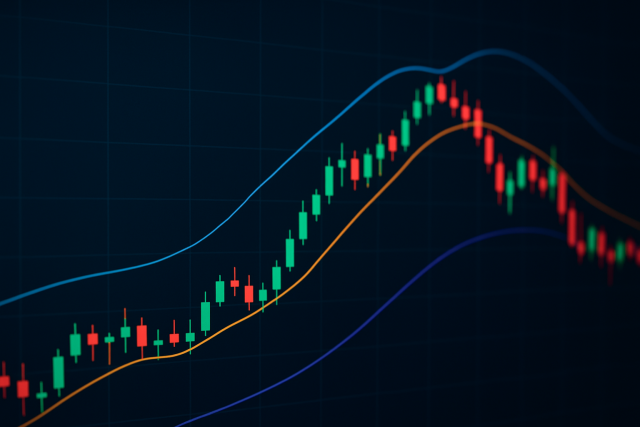
Check other technical indicators like RSI or MACD to get a clearer sense of whether momentum is starting to fade.
Take a moment to consider the bigger picture. Broader market conditions and fundamental factors like sector strength or recent news events can influence how reliable this pattern really is.
Protect yourself by setting stop-loss orders just below the hanging man’s low. This acts as a safety net against any unexpected bullish moves that might happen.
Using these confirmation techniques usually helps reduce the risk of false signals that pop up when markets get jumpy. Platforms like TradingView make life easier by combining volume data, technical indicators and real-time charting tools into one package. TrendSpider’s AI-driven pattern recognition can automatically spot hanging man formations and send alerts to traders, taking some guesswork and stress out of confirmation and decision-making.
Even seasoned traders can occasionally stumble over hanging man candlestick patterns. Misreading or misapplying these signals often leads to trading decisions that don’t quite hit the mark.
Keeping an eye out for these typical slip-ups can seriously boost your trading discipline and save you from a lot of headaches caused by rushing in or skimming over important details.
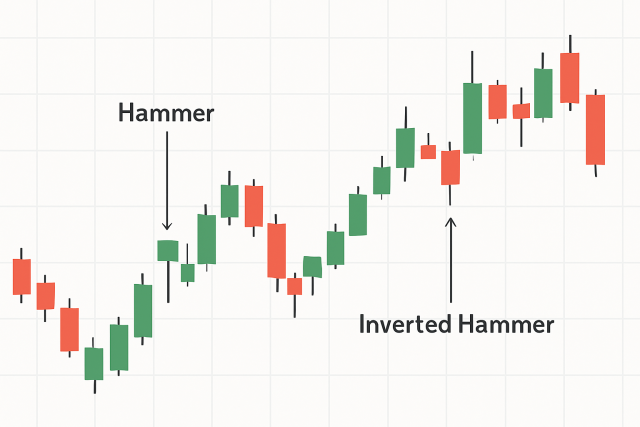
The hanging man shares a striking resemblance with other candlestick patterns, like the hammer and inverted hammer. Since these patterns can often send very different signals—one usually leans bullish while the other tips bearish—it’s key to nail down the differences to avoid costly trading blunders.
| Pattern Name | Context | Body Placement | Shadow Lengths | Typical Interpretation | Key Differences |
|---|---|---|---|---|---|
| Hanging Man | Uptrend | Small body near top | Long lower shadow (about twice the body), very small upper shadow | Usually a bearish reversal signal, waving a cautious flag | Pops up after an uptrend and hints at a possible market top, so watch your step |
| Hammer | Downtrend | Small body near top | Long lower shadow, minimal upper shadow | Typically a bullish reversal signal, it’s the market throwing a hopeful glance | Shows up at the bottom of a downtrend, signaling a potential market bottom—you might want to pay attention here |
| Inverted Hammer | Downtrend | Small body near bottom | Long upper shadow, short lower shadow | Often a bullish reversal signal, kind of a tricky little fellow | Its shadow points the other way compared to the regular hammer, making an appearance during downtrends |
| Shooting Star | Uptrend | Small body near bottom | Long upper shadow, very small lower shadow | Generally a bearish reversal signal, almost like a falling star that flashes a warning | Mirror image of the hanging man’s shadow setup, just flipped around |
| Hanging Man (color variants) | Uptrend | Real body color varies | Lower shadow long | Body color tends to confirm pattern strength but the signal stands either way, so don’t put all your eggs in one basket | Color adds a bit of flavor indicating relative bullish or bearish vibes within the pattern |
This comparison table shines a light on the subtle but key differences between these patterns, helping to clear up any potential confusion and steering traders toward the right interpretations.
By weaving these practical tips into your trading routine, you’ll give yourself a better shot at accurately spotting hanging man patterns and responding in just the right way.

Are you tired of juggling multiple tools for your trading needs? TradingView is the all-in-one platform that streamlines your analysis and decision-making.
With its powerful charting capabilities, real-time data, and vibrant community, TradingView empowers traders like you to stay ahead of the market. Join thousands who trust TradingView for their trading success.

23 posts written
Unlock the power of contrarian investing by leveraging the AAII Sentiment Survey. Learn how investor...
Hammer candle patterns are essential for spotting trend reversals. This guide simplifies their meani...
Discover how the DEM indicator offers a smoother, more responsive view of market trends. This guide...

Learn the meaning of NFP in trading and why the monthly Non-Farm Payrolls report is a key economic i...