


Technical Analysis
Profiting from Head and Shoulders Patterns in Any Market
Unlock the power of the head and shoulders pattern with this complete guide. Learn to spot, trade, a...

The hammer candlestick pattern is a pretty well-regarded technical indicator in forex trading that often hints at a potential price reversal. Catching this pattern can really help traders get ahead of the game, spotting bullish moves right after bearish trends.
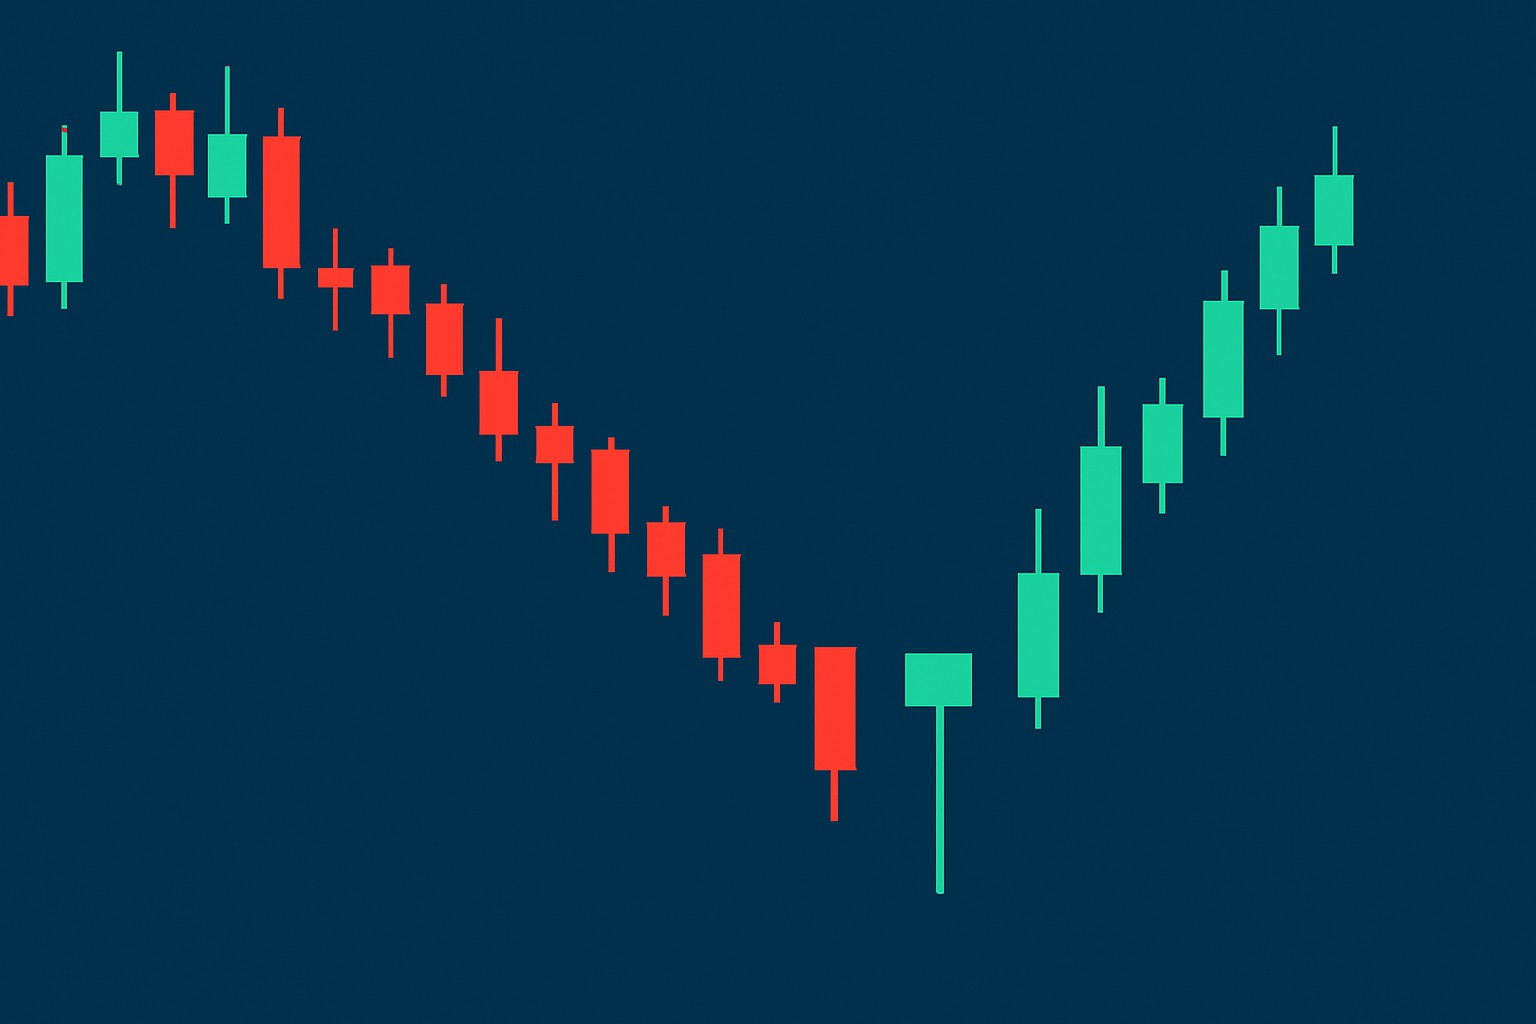
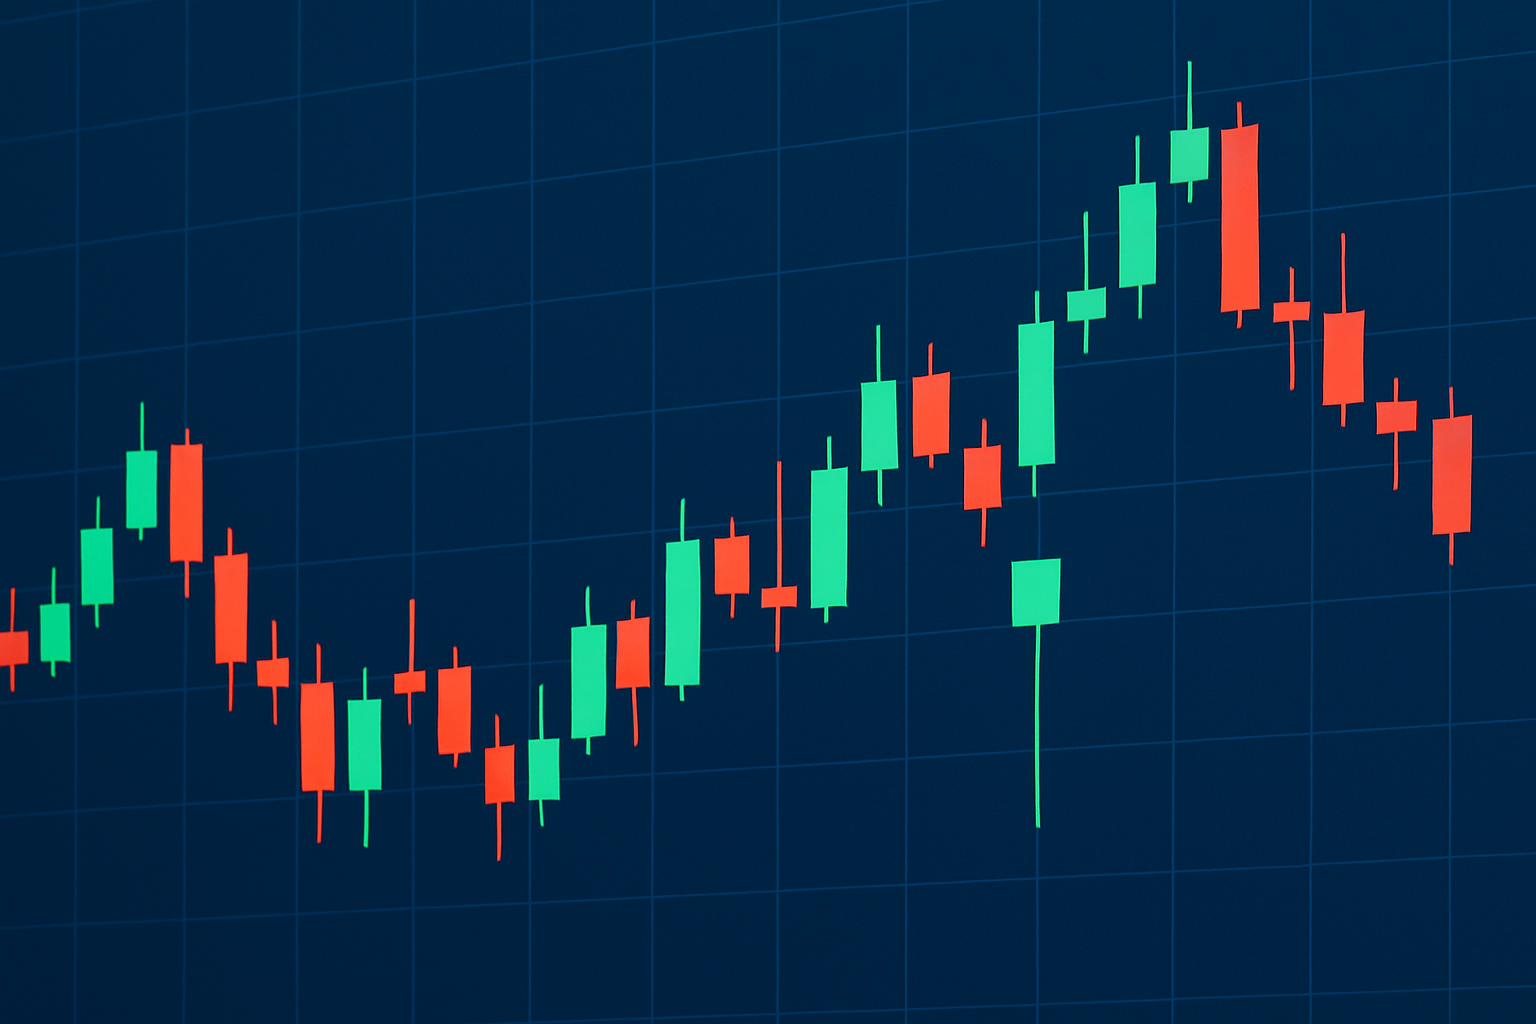
Candlestick charting is a classic way to visualize price data that started in Japan centuries ago and has become a staple across many financial markets including forex. Each candlestick captures price movement over a set time frame. The body shows the opening and closing prices and the shadows or wicks highlight the highs and lows. The body’s color reveals whether the price closed higher (bullish) or lower (bearish) than it started.
A hammer candlestick shows up with a small real body snugged up near the top of the price range, accompanied by a long lower wick that is at least twice the length of the body. The upper wick usually keeps a low profile, often barely there or completely missing.
Example of a hammer candlestick pattern showing its distinctive small body and long lower wick in a forex chart.
The hammer signals a pretty striking shift in market mood. Prices take a sharp nosedive during the period, only to have some determined buying step in and push the price back near or even above the opening level. It’s like the bears are starting to lose their grip while the bulls are quietly gearing up for a comeback.
Identifying a hammer candlestick demands a keen eye across multiple timeframes and currency pairs. Keep an eye out for these unmistakable features to spot the pattern right and avoid getting tangled up with lookalike candlesticks.
It is surprisingly easy to confuse a hammer with an inverted hammer or even a shooting star, given they each hint at slightly different stories. Plus, reading doji candles or hammers during uptrends as straight-up reversal signals can often send you down the wrong path.
When a hammer pops up after a downtrend it’s often a pretty good hint that a price reversal could be just around the corner, bringing some fresh bullish momentum into play. Traders tend to read it as a sign that sellers had their moment pushing prices down, but then buyers swooped back in—kind of like stepping up to the plate just in time.
Knowing the difference between the hammer, inverted hammer and hanging man patterns is key—mixing them up can lead you astray. The inverted hammer has a longer upper wick and its body is near the bottom. It can hint at a bullish reversal although it is a rarer sight.
Take a good look at the overall trend to make sure there’s a clear downtrend leading up to the hammer. This sets the stage nicely.
Keep an eye out for hammer candlesticks on your forex charts across several timeframes to boost your accuracy. The 1-hour, 4-hour and daily charts are usually reliable.
Wait for a confirmation candle after the hammer shows up. A solid bullish candle that closes above the hammer’s real body does the trick.
Play it safe by placing your stop-loss just below the hammer’s lowest point. This move helps keep your risk in check.
When picking your entry point, it’s usually best to jump in at the confirmation candle’s opening or as the price breaks above its high. Then size your position according to your risk comfort zone.
Set your profit targets with a dose of realism by using past resistance zones, Fibonacci retracement levels or a straightforward fixed risk-reward ratio.
As the price starts moving in your favor, think about tightening your stop-loss or using trailing stops to lock in gains and limit any unexpected losses along the way.
Keeping a firm grip on risk management is absolutely essential when trading the hammer pattern. It’s smart to never throw more than a small slice of your trading capital into any single trade. And of course always set stop-loss orders to keep losses in check if the market takes a detour against you.
The hammer candlestick pattern usually shines brightest when you don’t rely on it alone. Pair it up with trusty sidekicks like RSI, MACD and moving averages plus key support and resistance levels and you’re giving yourself a much better shot at reading the signals right.
Spotting a hammer candle at a solid support level, especially when the RSI dips below 30 and the MACD shows a bullish crossover often signals a promising trade entry.
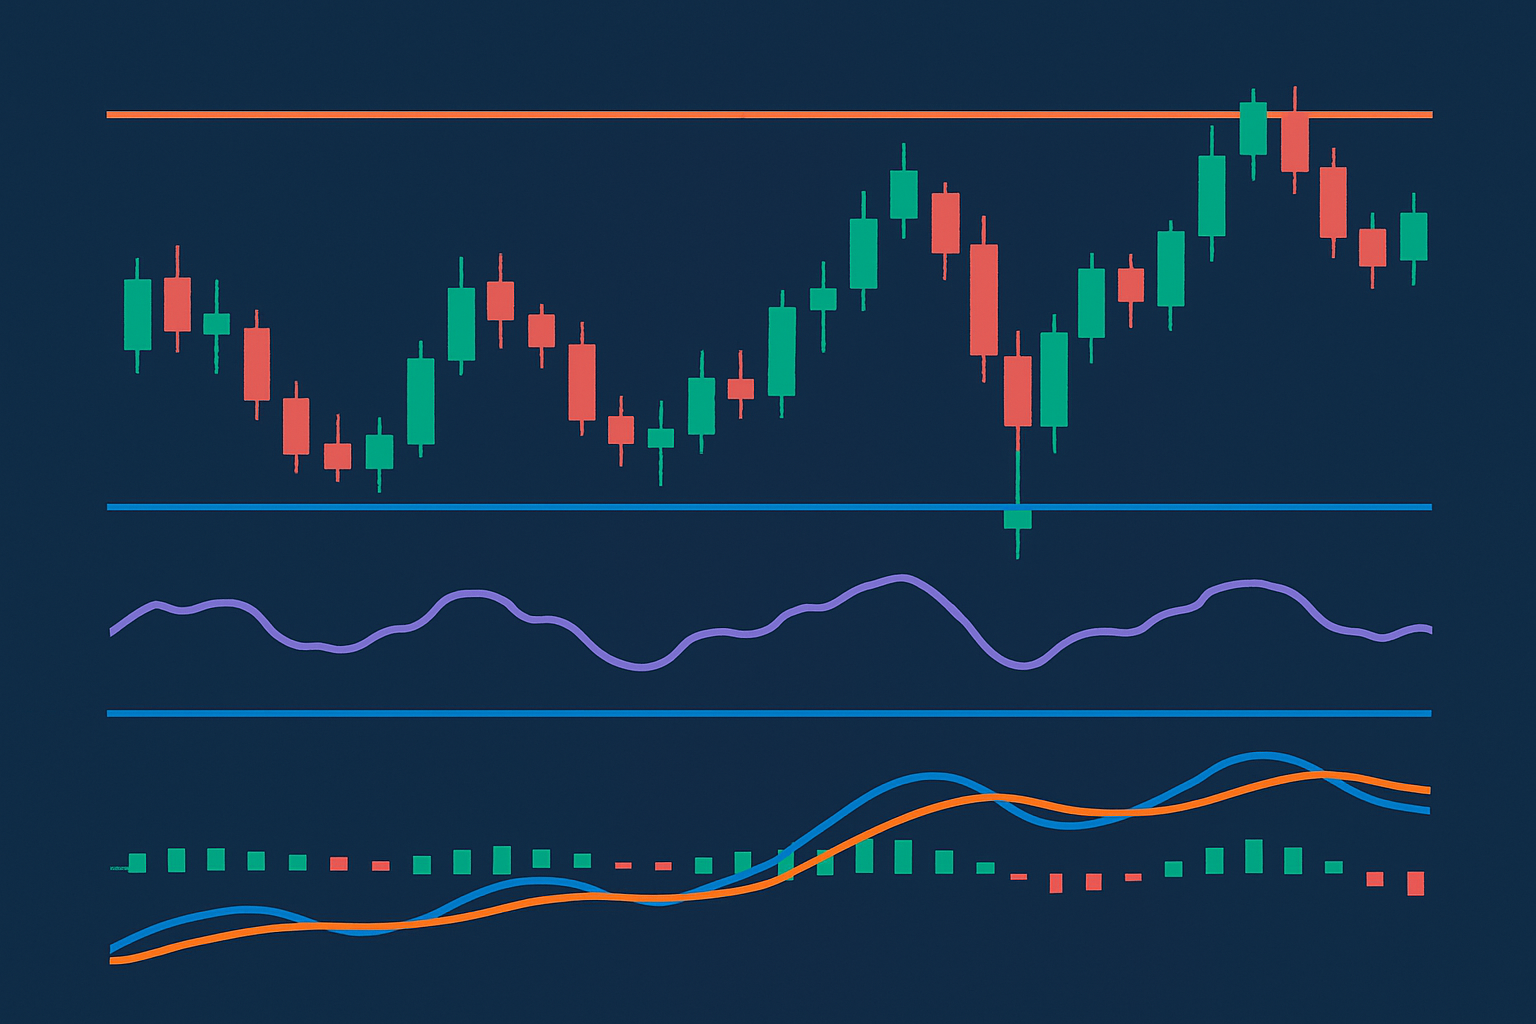
Forex chart demonstrating hammer candlestick pattern confirmed by RSI oversold reading, MACD crossover, and key support level.
Trading with hammer candlestick patterns isn’t always a walk in the park. You’ll often find that nailing down their true signals takes a bit of patience and a keen eye. One common hiccup is mistaking similar looking candles for genuine hammers which can lead you down the wrong path. But don’t sweat it—once you get the hang of spotting the subtle differences, you’ll feel a lot more confident.
Another thing to keep in mind is context. Hammers don’t act solo; their power really shows up when you consider them alongside other indicators and the overall market mood. I’ve found that blending them with volume data or trend lines usually helps filter out the noise and sharpens your entries.
Oh, and a quick heads-up Sometimes the market throws curveballs and even classic hammer signals don’t play out as expected. Having a solid risk management plan and keeping emotions in check can save you from those gut-wrenching moments.
With these tips tucked under your belt, trading with hammer patterns becomes less about chance and more about skill. So, roll up your sleeves, study those wicks, and remember—patience often pays off.
The hammer pattern can be surprisingly effective though traders often wrestle with hurdles like false signals and thin trading volumes. Emotional biases also nudge you into jumping the gun on trades. Keeping a mindful eye on these quirks is key if you want to harness the hammer properly.
To really boost your reliability when trading the hammer candlestick pattern, it’s a smart move to double-check signals with other technical tools like volume analysis or momentum indicators. In my experience, steering clear of trading during those dry spells of low liquidity can save a lot of headaches. Also, setting down some clear rules—like waiting for a confirming candle to close—can keep you from jumping the gun. Developing the discipline to manage your emotional impulses is absolutely key. I’ve seen patience pay off more times than not. Tools like TradingView or TrendSpider come equipped with advanced charting and pattern recognition features that can do a lot of the heavy lifting, automating detection and helping filter out the noise so you can focus on the genuine hammer setups that really matter.

Are you tired of juggling multiple tools for your trading needs? TradingView is the all-in-one platform that streamlines your analysis and decision-making.
With its powerful charting capabilities, real-time data, and vibrant community, TradingView empowers traders like you to stay ahead of the market. Join thousands who trust TradingView for their trading success.

19 posts written
Unlock the power of the head and shoulders pattern with this complete guide. Learn to spot, trade, a...

Unlock the power of the bear flag pattern with our practical, step-by-step guide. Understand market...

Learn how the harami candlestick pattern signals potential market reversals. This guide breaks down...

Discover the bullish harami candlestick pattern—a key technical signal that can hint at trend revers...