


Technical Analysis
Profiting from Head and Shoulders Patterns in Any Market
Unlock the power of the head and shoulders pattern with this complete guide. Learn to spot, trade, a...

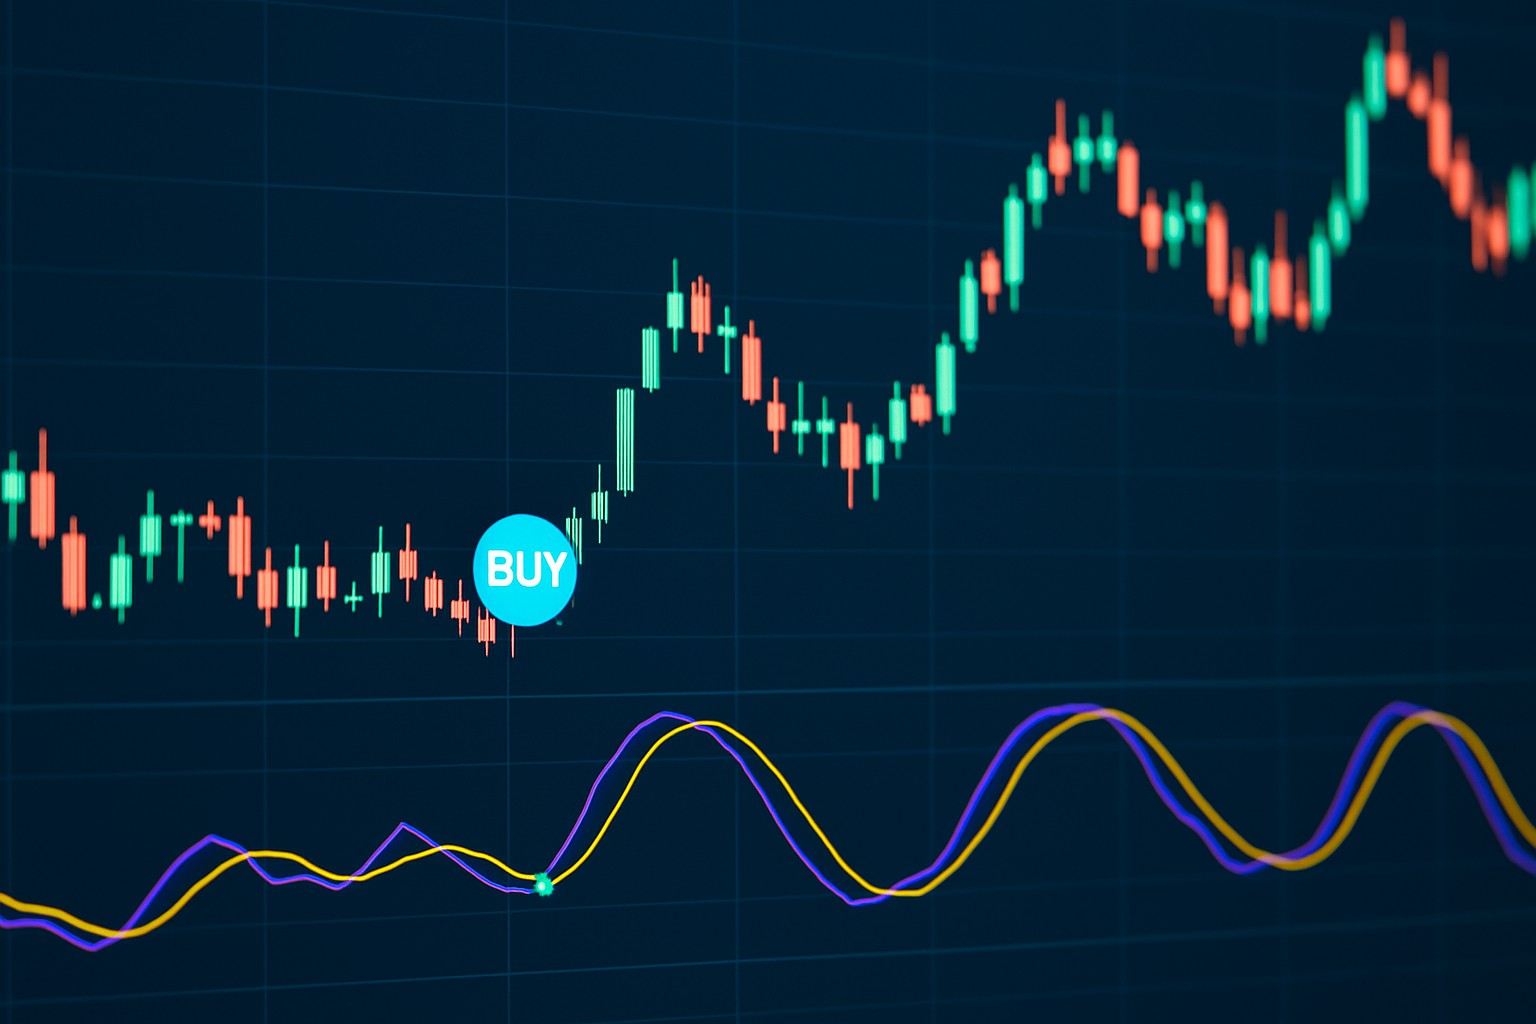
The stochastic index is a go-to tool in technical analysis, prized for its ability to deliver clearer trade signals by measuring momentum and market conditions.
The stochastic index dreamed up by George Lane back in the late 1950s is a momentum indicator that pits an asset’s closing price against its price range over a chosen time frame.
The stochastic index is worked out by first spotting the difference between the current closing price and the lowest price over a chosen number of periods. Then you divide that by the range between the highest high and the lowest low during that time. After that you multiply the result by 100 to turn it into a neat percentage. This percentage, called %K, shows where the closing price falls within the recent trading range. The %D line is the moving average of the %K, usually a simple 3-period moving average which helps smooth out the day-to-day noise.
| Period | Highest High | Lowest Low | Close Price | %K Calculation | %K Value |
|---|---|---|---|---|---|
| 1 | 50 | 45 | 48 | ((48 - 45) / (50 - 45)) * 100 | 60% |
| 2 | 51 | 45 | 50 | ((50 - 45) / (51 - 45)) * 100 | 83.33% |
| ... | ... | ... | ... | ... | ... |
| 14 | 55 | 46 | 54 | ((54 - 46) / (55 - 46)) * 100 | 88.89% |
| Moving Average for %D (3-period SMA of %K) | For instance, averaging (60%, 83.33%, and 88.89%) gives you about 77.41%, which isn’t too shabby for a moving average! |
Understanding the stochastic index mostly boils down to watching where the %K and %D lines are in relation to key thresholds. When the %K line nudges above 80 the asset often looks overbought—like it’s had too much caffeine—which might mean its momentum is ready to take a breather or flip direction. Conversely if it dips below 20 the asset usually feels oversold and this hints at a possible rebound. Watching how the %K and %D lines cross or dance around each other can offer handy buy or sell signals that show shifts in momentum.
The stochastic index is undeniably handy, but traders often get tripped up by expecting it to predict immediate reversals on the dot or to magically guarantee profits. Another common pitfall is brushing off the bigger market picture or ignoring those sneaky divergence signals, which can really throw a wrench into trading decisions.
To get more reliable trade signals from the stochastic index it helps to consider its values alongside other technical analysis tools and the overall market context. Taking a careful approach means double-checking overbought or oversold levels with %K and %D crossovers and spotting any divergences. Make sure those signals line up with the broader trend.
Keep an eye on the stochastic index when it climbs above 80—that’s your classic overbought zone—or dips below 20 which usually signals oversold conditions. These are often the sweet spots where trading opportunities pop up.
Double-check your buy or sell signals by watching for crossovers between the %K and %D lines. It’s especially telling when the %K line crosses the %D line from below or above like a little traffic light for your trades.
Pay attention to any divergence between the stochastic index and price action since this can hint at weakening momentum and possible market reversals like a warning sign flashing just when you need it.
Pair your stochastic signals with other tools such as trend analyses or moving averages. This combo helps zero in on trades that align with the market’s main direction and makes your decisions less stressful.
And hey, no matter how confident you feel don’t skip solid risk management. Setting stop-loss orders and choosing sensible position sizes are your best friends for keeping your capital safe and sound.
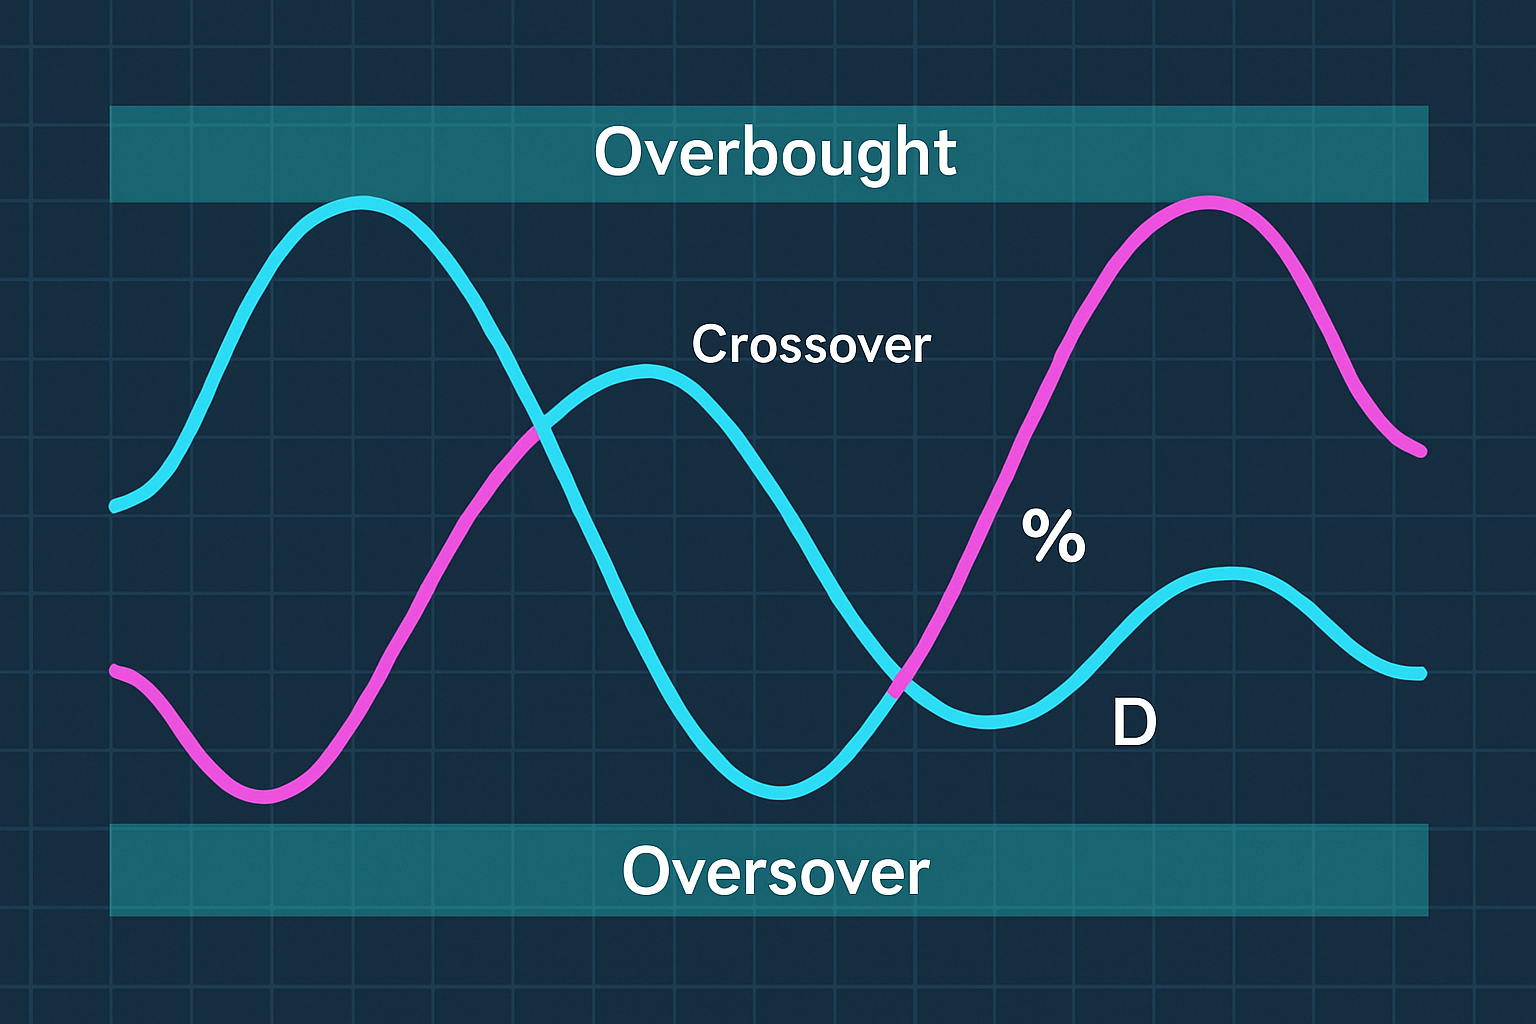
Chart example showing stochastic index with %K and %D lines, overbought and oversold areas, and crossover signals.
Combining the stochastic index with indicators like RSI or MACD usually sharpens signal clarity quite a bit. This little tag team helps confirm momentum shifts and cuts down on those pesky false signals.
The stochastic index tends to play by a different set of rules when the market is trending versus when it’s just meandering sideways. Taking a peek at chart examples from both scenarios can really help traders sharpen their radar for spotting those genuine reversals in oversold or overbought zones.
The stochastic index is a handy tool, even if it’s not the crystal ball everyone hopes for. Its true magic reveals itself when you pair it with other market indicators and keep a firm handle on the market’s bigger picture—that’s when you start seeing the best trading results.
Tweaking your stochastic index parameters to better suit your specific market environment and trading style can often give the signals a bit more punch.

Tired of missing opportunities and making suboptimal trading decisions? TrendSpider's cutting-edge platform automates complex technical analysis, saving you time and reducing human error.
With multi-timeframe analysis, dynamic alerts, backtesting, and customizable charting, you'll gain a competitive edge in identifying trends and making informed trades across global markets.

19 posts written
Unlock the power of the head and shoulders pattern with this complete guide. Learn to spot, trade, a...

Discover the doji candlestick—a powerful price action signal revealing market indecision. This begin...

Discover the bullish harami candlestick pattern—a key technical signal that can hint at trend revers...

Learn how the harami candlestick pattern signals potential market reversals. This guide breaks down...