


Technical Analysis
Understanding the Bullish Harami Candlestick Pattern
Discover the bullish harami candlestick pattern—a key technical signal that can hint at trend revers...

Bullish pennants are a classic chart pattern in technical analysis that often signal the uptrend is ready to pick up right where it left off. We’ll walk through how a bullish pennant shows up on price charts, why it catches the eye of savvy traders.
A bullish pennant is a technical chart pattern that starts with a sharp upward price move then settles into a small, symmetrical triangle where the price action tightens up and takes a breather. Picture it like a flagpole shooting up, topped by a pennant—the triangle—that signals a brief pause in the bullish momentum before the uptrend picks up steam again.
Bullish pennants typically show up right after a sharp rally when traders seem to take a collective breath and pause for a moment. The price squeezes into a tighter and tighter range, much like a spring that is wound just so—building this electric kind of tension before it finally snaps higher on a breakout.
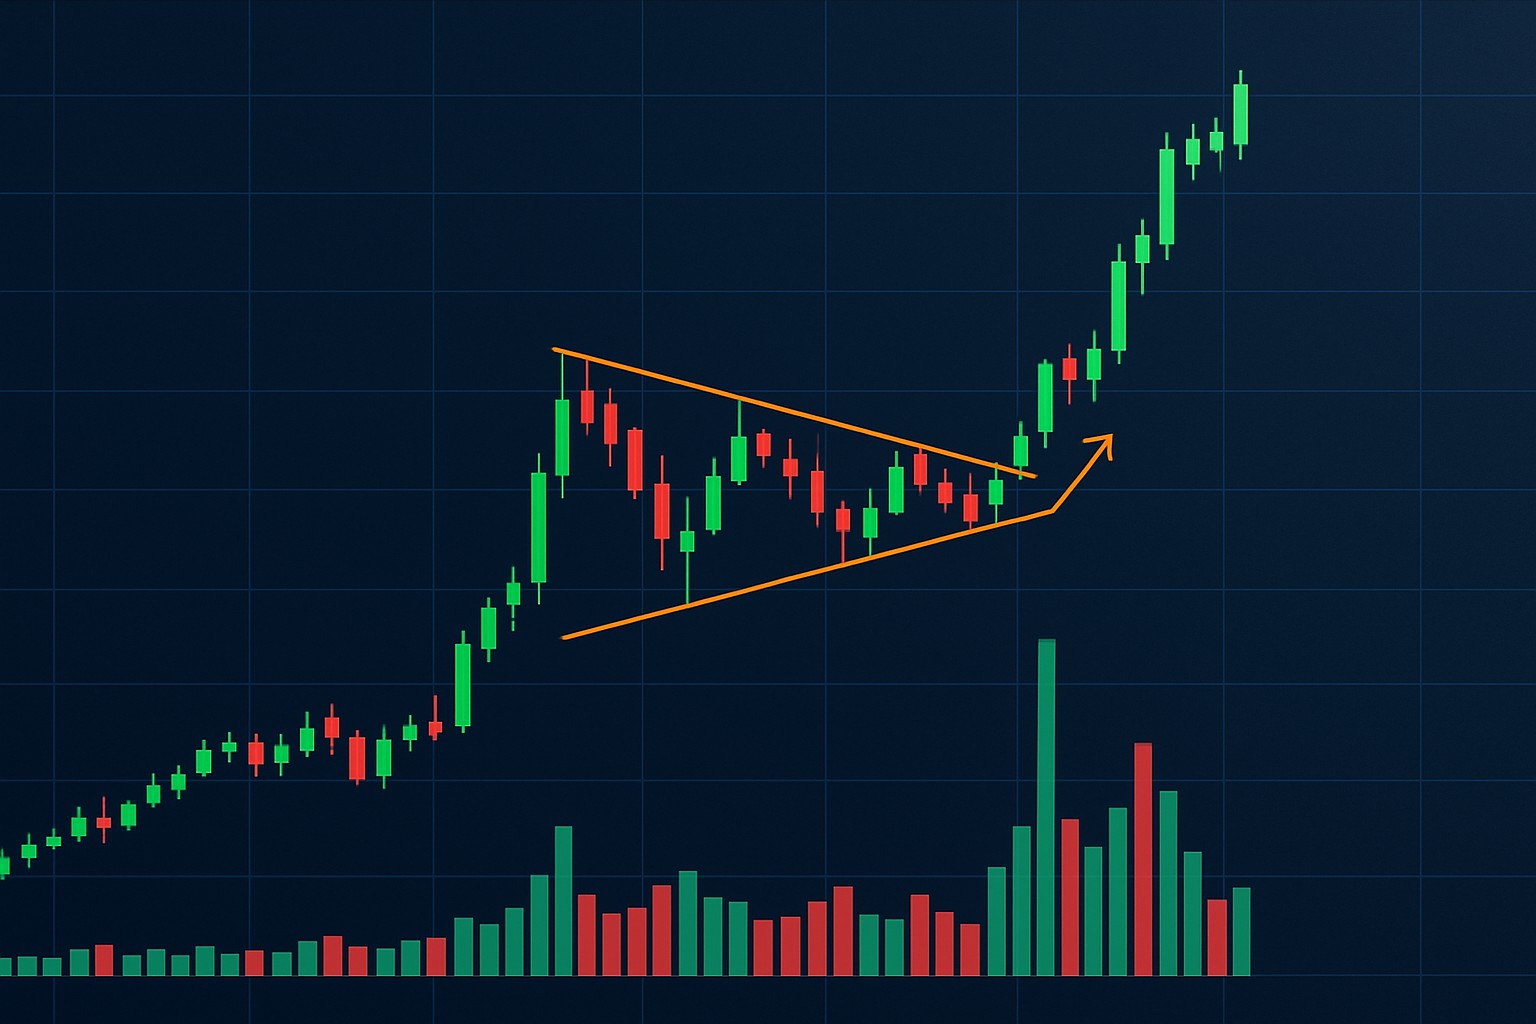
A clear and powerful price jump shoots up like a flagpole, signaling that buyers have firmly taken the reins.
The price settles into a consolidation phase, bobbing around inside tightening trendlines that shape the classic pennant pattern.
When the price finally breaks out above the upper trendline, it’s a green light for fresh buying momentum and a strong hint that the uptrend is here to stay.
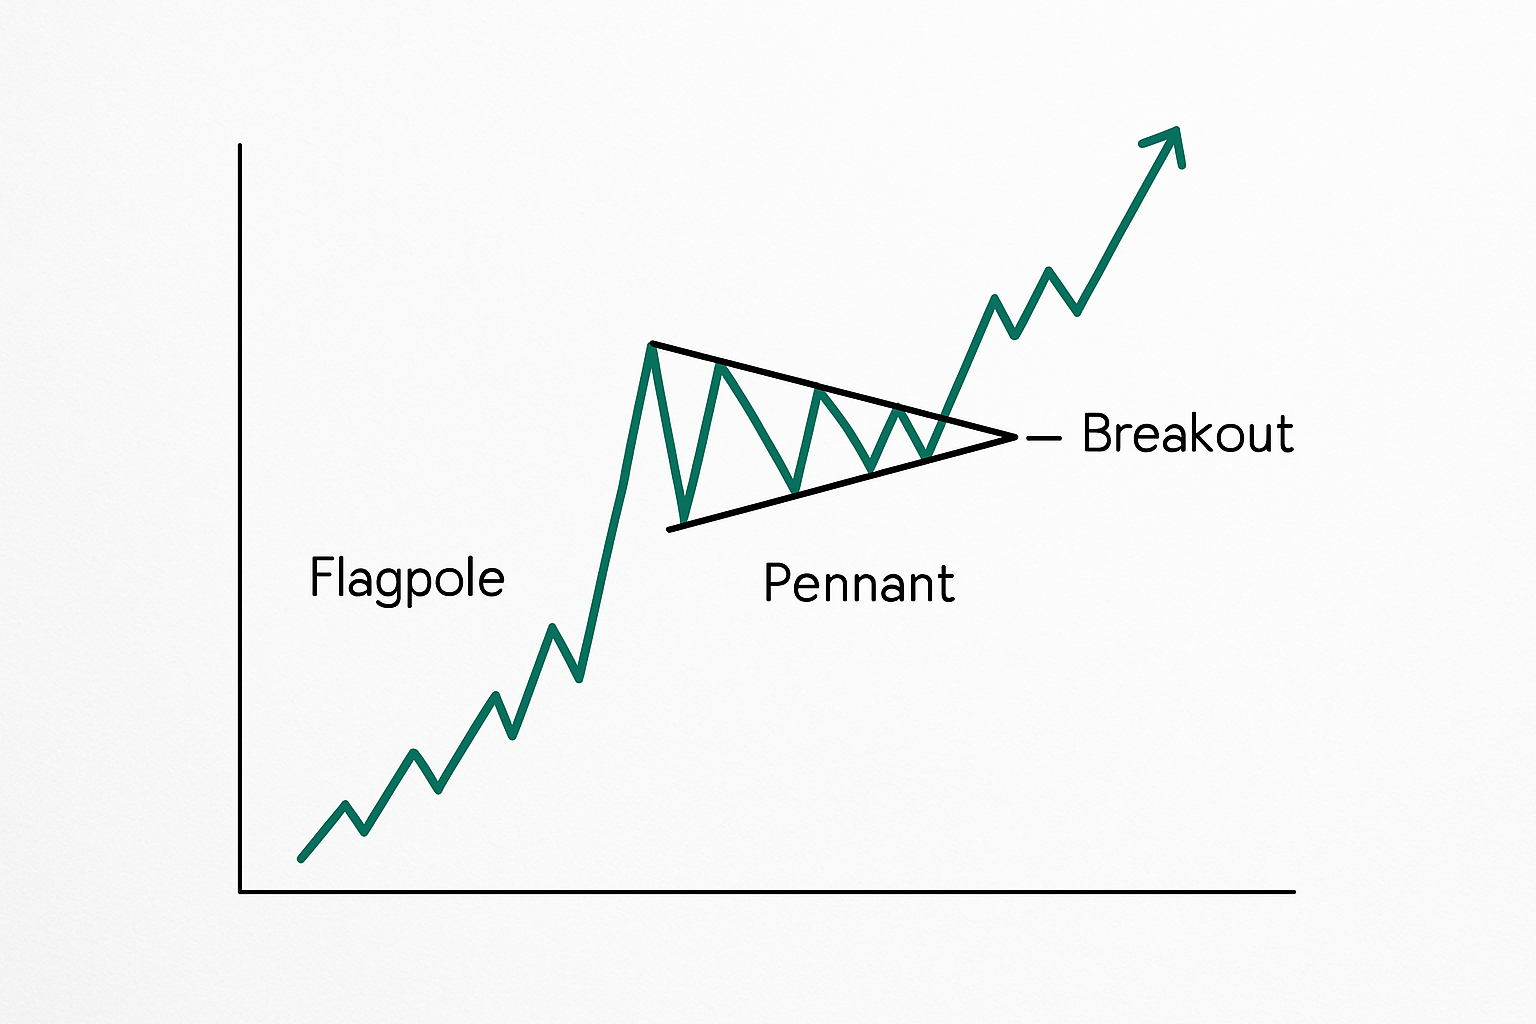
Illustration highlighting the flagpole, pennant consolidation, and breakout areas on a bullish pennant price chart
Bullish pennants often get mistaken for patterns like flags, symmetrical triangles and wedges—it’s an easy mix-up given their visual similarities. Yet if you look closely, the length of the flagpole and the pennant’s tight symmetrical shape plus clues like volume and the context of the breakout usually help you tell a bullish pennant apart from these lookalike patterns.
| Pattern Name | Visual Traits | Typical Market Context | Key Differences from Bullish Pennants |
|---|---|---|---|
| Flag | Rectangular consolidation with a slight tilt | A brief pause after a strong move | Flags show parallel trendlines, unlike pennants which form a converging triangle — a subtle but telling distinction |
| Symmetrical Triangle | Converging trendlines developing over longer periods | Can signal either a reversal or continuation | Pennants tend to be smaller and typically follow a sharp, strong move (the so-called flagpole) — it’s all about context here |
| Wedge | Slanting, converging trendlines | Often points to a reversal | Wedges usually slope against the previous trend, while pennants keep it neutral or pretty much horizontal — a neat way to tell them apart |
Confidently spot a bullish pennant by looking for key chart features like a sharp steep flagpole followed by a small symmetrical triangle where the price squeezes in tight. You will usually notice volume taking a breather during the pennant before ramping up dramatically once the price breaks out.
Volume is absolutely key when confirming a bullish pennant. Typically, you’ll see volume dip during the pennant’s formation. This usually signals hesitation and a pause in trading as buyers catch their breath and reassess. Then, right when the price breaks above the pennant’s upper boundary, volume tends to surge noticeably, flashing renewed buyer enthusiasm and underscoring the breakout’s muscle.
It’s like the rocket ready to launch.
Kind of like drawing the borders of a cozy little tent.
Typically, volume takes a nosedive during consolidation like everyone’s holding their breath.
As if finally bursting out of a tight squeeze.
That’s your green light to believe the move’s legit.
When it comes to spotting bullish pennants, it is easy to slip up by mistaking a quick little price pullback for genuine consolidation or jumping into a trade before the breakout is properly confirmed. Keeping a close eye on volume is absolutely key to dodge those pesky false signals. I have found that assuming a breakout without seeing volume step up usually ends in disappointment.
Recognizing bullish pennants can give traders a bit of an edge when it comes to timing their entries during those powerful uptrends. Since this pattern signals a continuation, many traders like to place their stop-loss orders just below the pennant consolidation—kind of like setting a safety net to keep risks at bay.
Waiting patiently for a clean breakout from the bullish pennant before diving into a trade usually pays off by boosting gains and cutting down the risk of false signals. At least, that’s been my go-to approach as an Experienced Technical Analyst.
Take a recent cryptocurrency chart for instance where Bitcoin suddenly kicked into high gear with a sharp rally. Then as if catching its breath it settled into a neat bullish pennant pattern - a symmetrical triangle tightening up like clockwork. The volume took a bit of a nap during this pennant phase but then woke up with a bang right at the breakout.
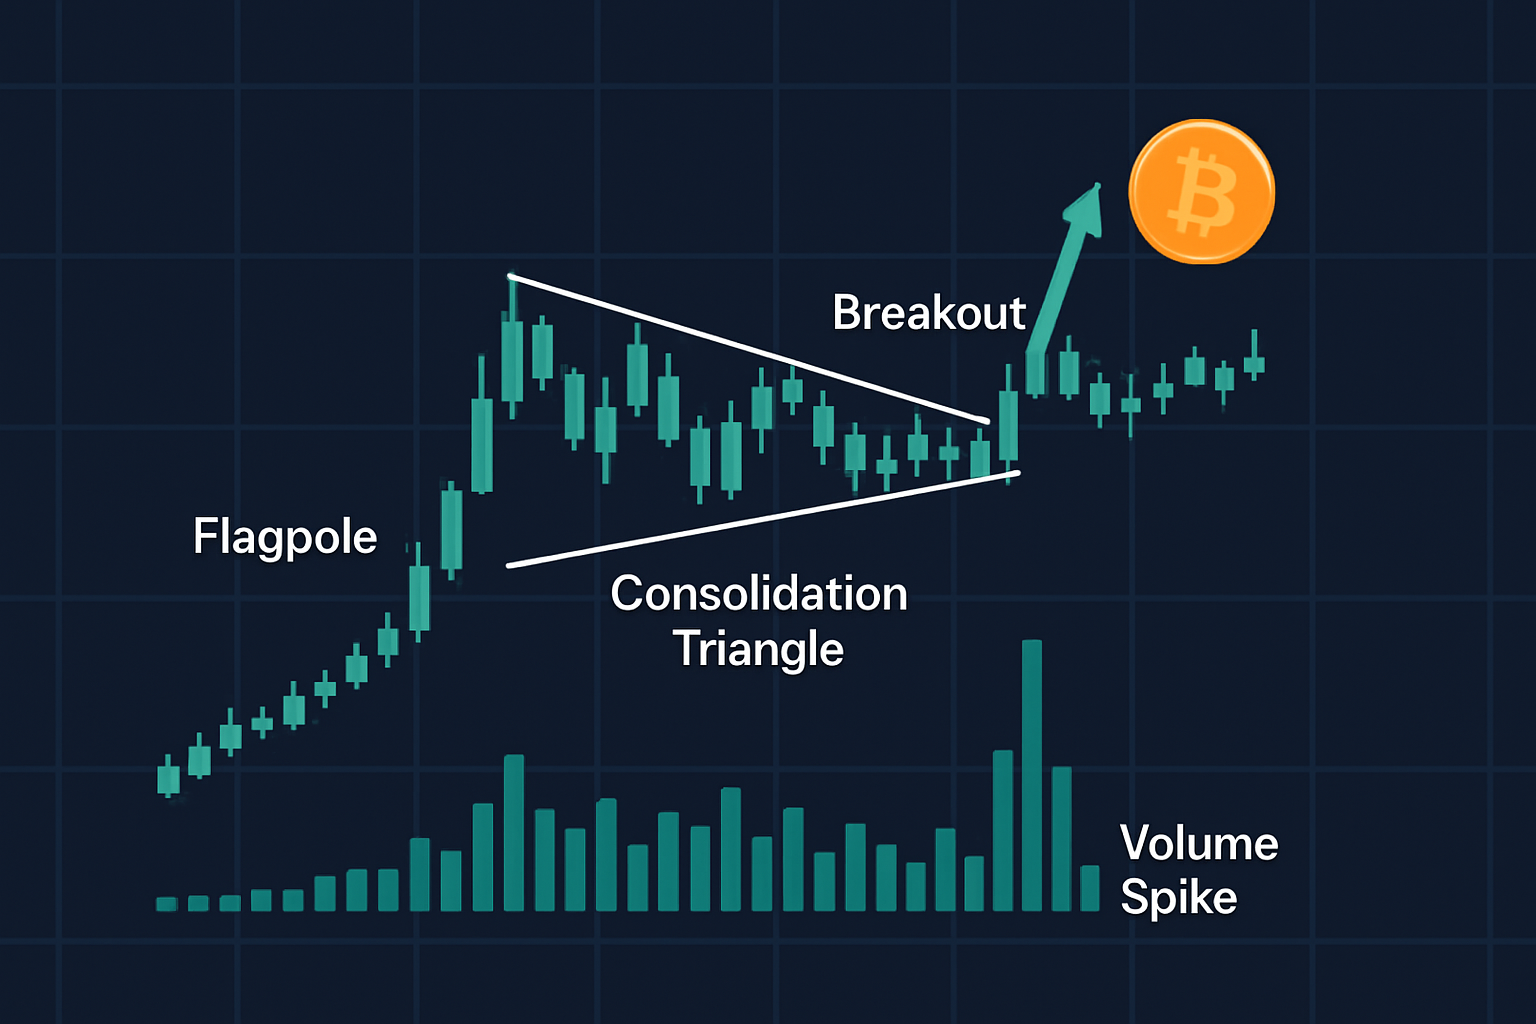
Real chart screenshot showing bullish pennant formation and breakout annotated for clarity

Are you tired of juggling multiple tools for your trading needs? TradingView is the all-in-one platform that streamlines your analysis and decision-making.
With its powerful charting capabilities, real-time data, and vibrant community, TradingView empowers traders like you to stay ahead of the market. Join thousands who trust TradingView for their trading success.

23 posts written
Discover the bullish harami candlestick pattern—a key technical signal that can hint at trend revers...

Discover what IOUs mean in finance, their role as informal debt acknowledgments, and how understandi...

Unlock the power of candle patterns to decode market psychology and improve your trading precision....

Unlock the power of the head and shoulders pattern with this complete guide. Learn to spot, trade, a...